MongoTop
Download
Focus Mode
Font Size
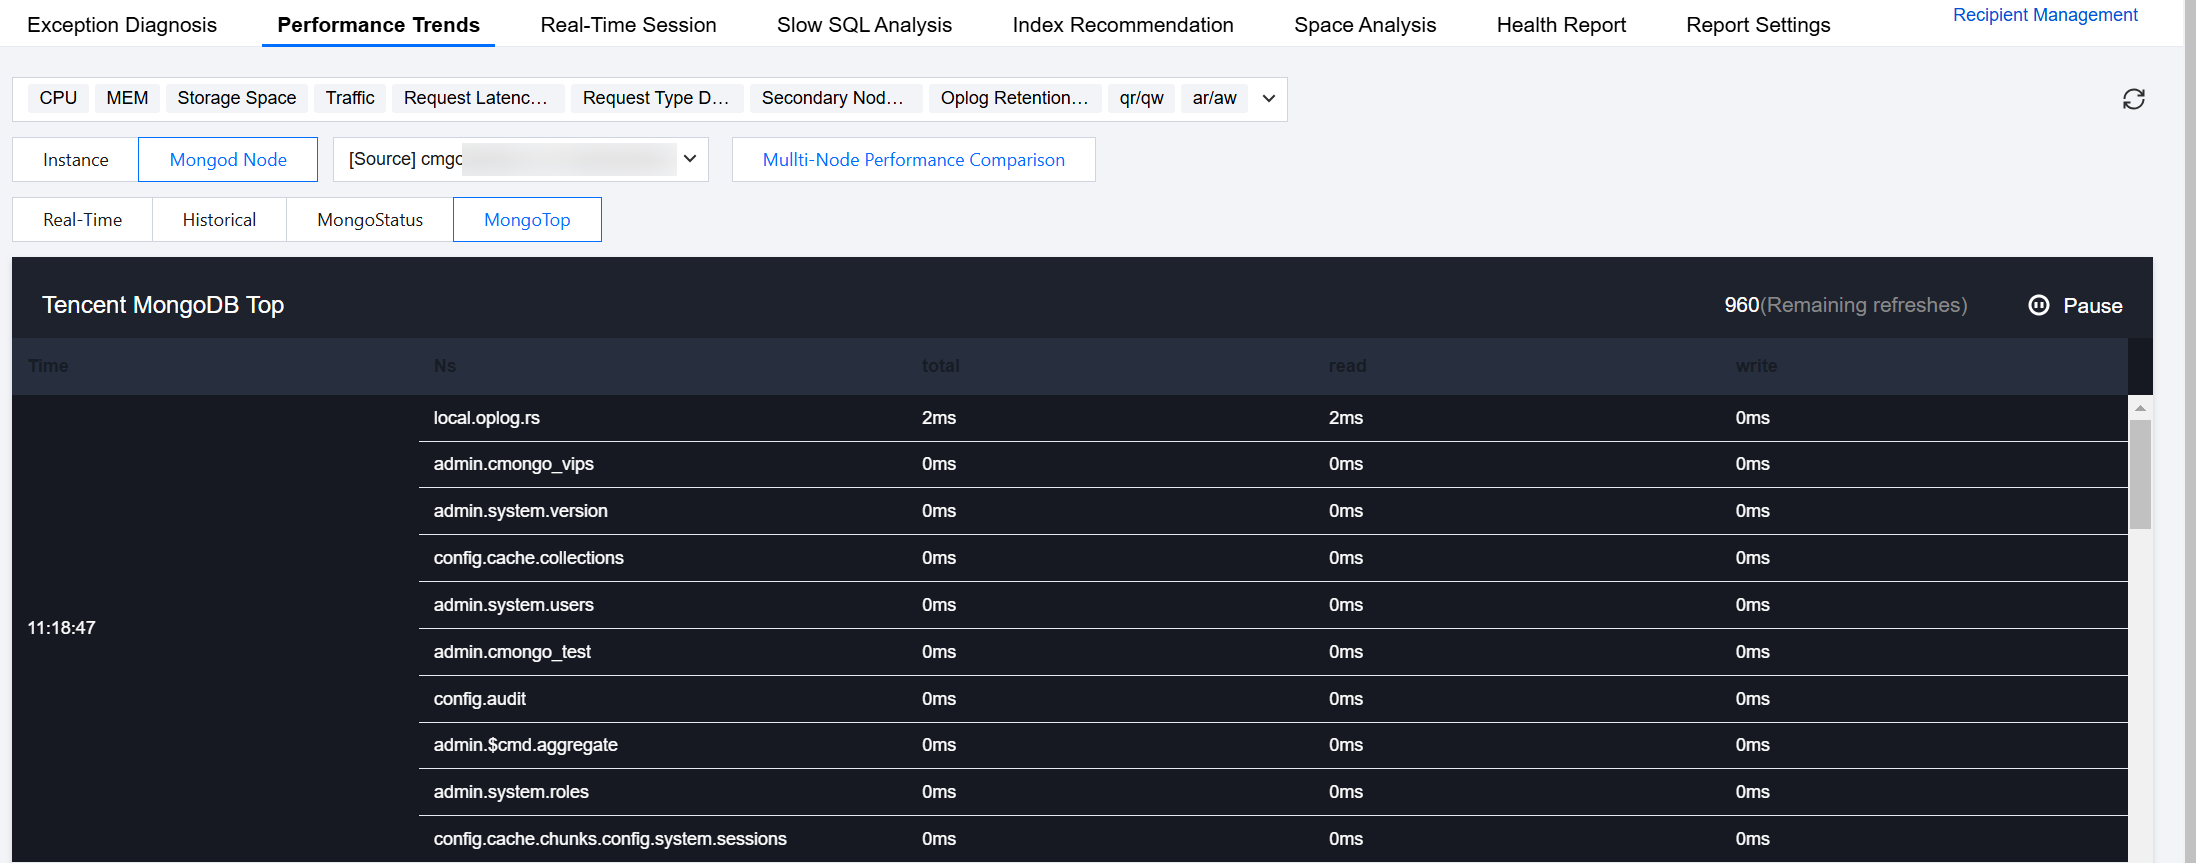
To facilitate daily database Ops, DBbrain provides the TencentDB for MongoDB MongoTop tool. Like MongoDB's official tool, this tool allows you to view the monitoring data of top tables at the node level in real time.
Directions
1. Log in to the DBbrain Console.
2. In the left sidebar, choose Performance Optimization.
3. Select MongoDB database type and instance ID at the top, and select the Performance Trends tab.
4. Select Mongod Node > MongoTop.
5. From the dropdown list, select a node to view.

6. Click the Pause button at the top right to pause and view the data situation.

MongoTop table monitoring fields
MongoTop fields are as described below:
Time:
Current time of the database.
Ns:
Namespace of the database.
total:
The total time mongod spent in the namespace.
read:
The time spent by mongod performing read operations in the namespace.
write:
The time spent by mongod performing write operations in the namespace.
Help and Support
Was this page helpful?
You can also Contact sales or Submit a Ticket for help.
Help us improve! Rate your documentation experience in 5 mins.
Feedback