MongoStatus
Download
Focus Mode
Font Size
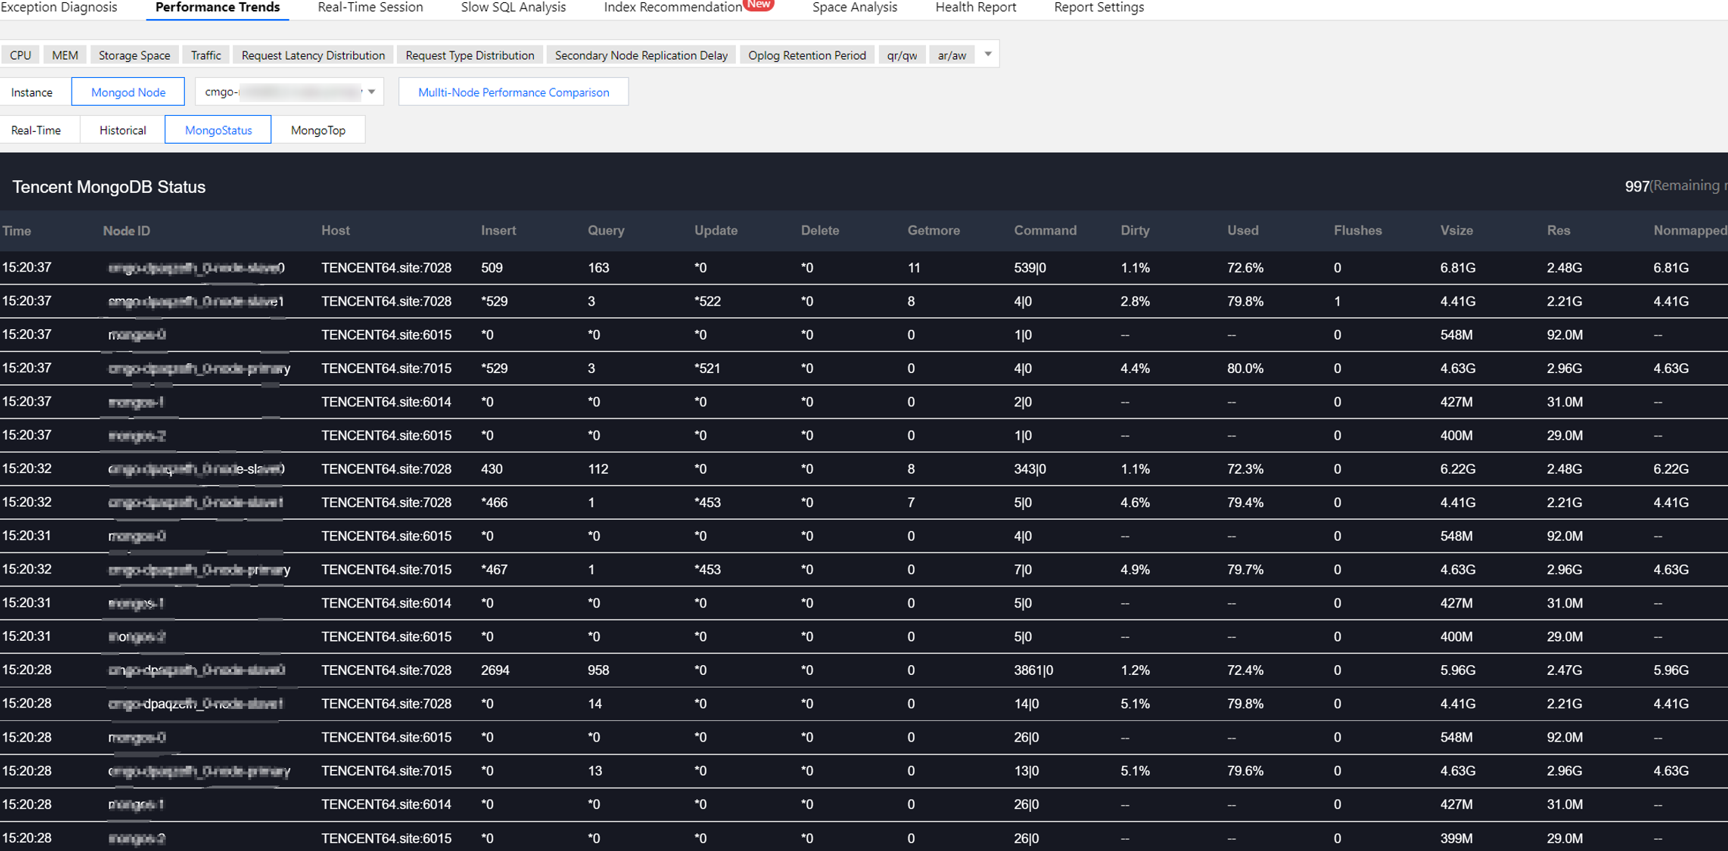
To facilitate daily database Ops, DBbrain provides the TencentDB for MongoDB MongoStatus tool. This tool monitors the MongoDB status at the instance or node level by checking the traffic and storage engine in real time.
Directions
Instance-Level MongoDB Status
1. Log in to the DBbrain Console.
2. In the left sidebar, choose Performance Optimization.
3. Select MongoDB database type and instance ID at the top of the page, and select the Performance Trends tab.
4. Select Instance > MongoStatus.
5. Click the Pause button at the top right to pause and view the data situation.

Single Node MongoDB Status
1. Log in to the DBbrain Console.
2. In the left sidebar, choose Performance Optimization.
3. Select MongoDB database type and instance ID at the top of the page, and select the Performance Trends tab.
4. Select Mongod Node > MongoStatus.
5. From the dropdown list, select a node to view.

6. Click the Pause button at the top right to pause and view the data situation.

MongoStaus Monitoring List Field Description
The feature descriptions of various parameters in MongoStaus are as follows:
Monitoring List Field | Note: | Performance Impact and Optimization Methods |
Time | Monitoring time point | - |
Node ID | Node ID | |
Host | Node address information | - |
Insert | Number of insertions per second | If update continuity is very high, it can be optimized with dirty and used analysis. |
Query | Number of query requests per second | Check the index to ensure that the query has a corresponding index. |
Update | Number of updates per second | 1. Check the index to ensure that the query has a corresponding index. 2. If update continuity is very high, it can be optimized with dirty and used analysis. |
Delete | Number of deletions per second | 1. Check the index to ensure that the query has a corresponding index. 2. If delete continuity is very high, it can be optimized with dirty and used analysis. |
Getmore | Number of getMore requests per second | - |
Command | Command statistics per second | - |
Dirty | The proportion of dirty data in storage engine cache | If dirty data persists at a high proportion (more than 20% by default), it is recommended to increase the number of threads_max in the storage engine. |
Used | The percentage of used cache in the storage engine | If dirty data persists at a high proportion (more than 95% by default), it is recommended to increase the number of threads_max in the storage engine. |
Flushes | Number of flushes per second | - |
Vsize | Amount of virtual memory used by the process | - |
Res | Amount of resident memory used by the process | - |
Nonmapped | Data that is not mapped to memory | If a large amount of data is in the Nonmapped status, it is recommended to scale or optimize the memory configuration. |
Faults | Number of page errors | If the number of page errors is high, it is recommended to increase physical memory, optimize query and index, use shard, or take other measures to reduce disk I/O pressure. |
Qrw | Read/write waiting queue information of the client | If arw continuity approaches 128 and qrw continuity exceeds 0, it indicates that the requests are queued. |
Arw | Read/write active queue information of the client | - |
Net_in | Inbound traffic | - |
Net_out | Outbound traffic | - |
Conn | Number of connections | - |
Set | Name of replica set | - |
Repl | Primary/Secondary status information | - |
Help and Support
Was this page helpful?
You can also Contact sales or Submit a Ticket for help.
Help us improve! Rate your documentation experience in 5 mins.
Feedback