Release Notes
Announcements
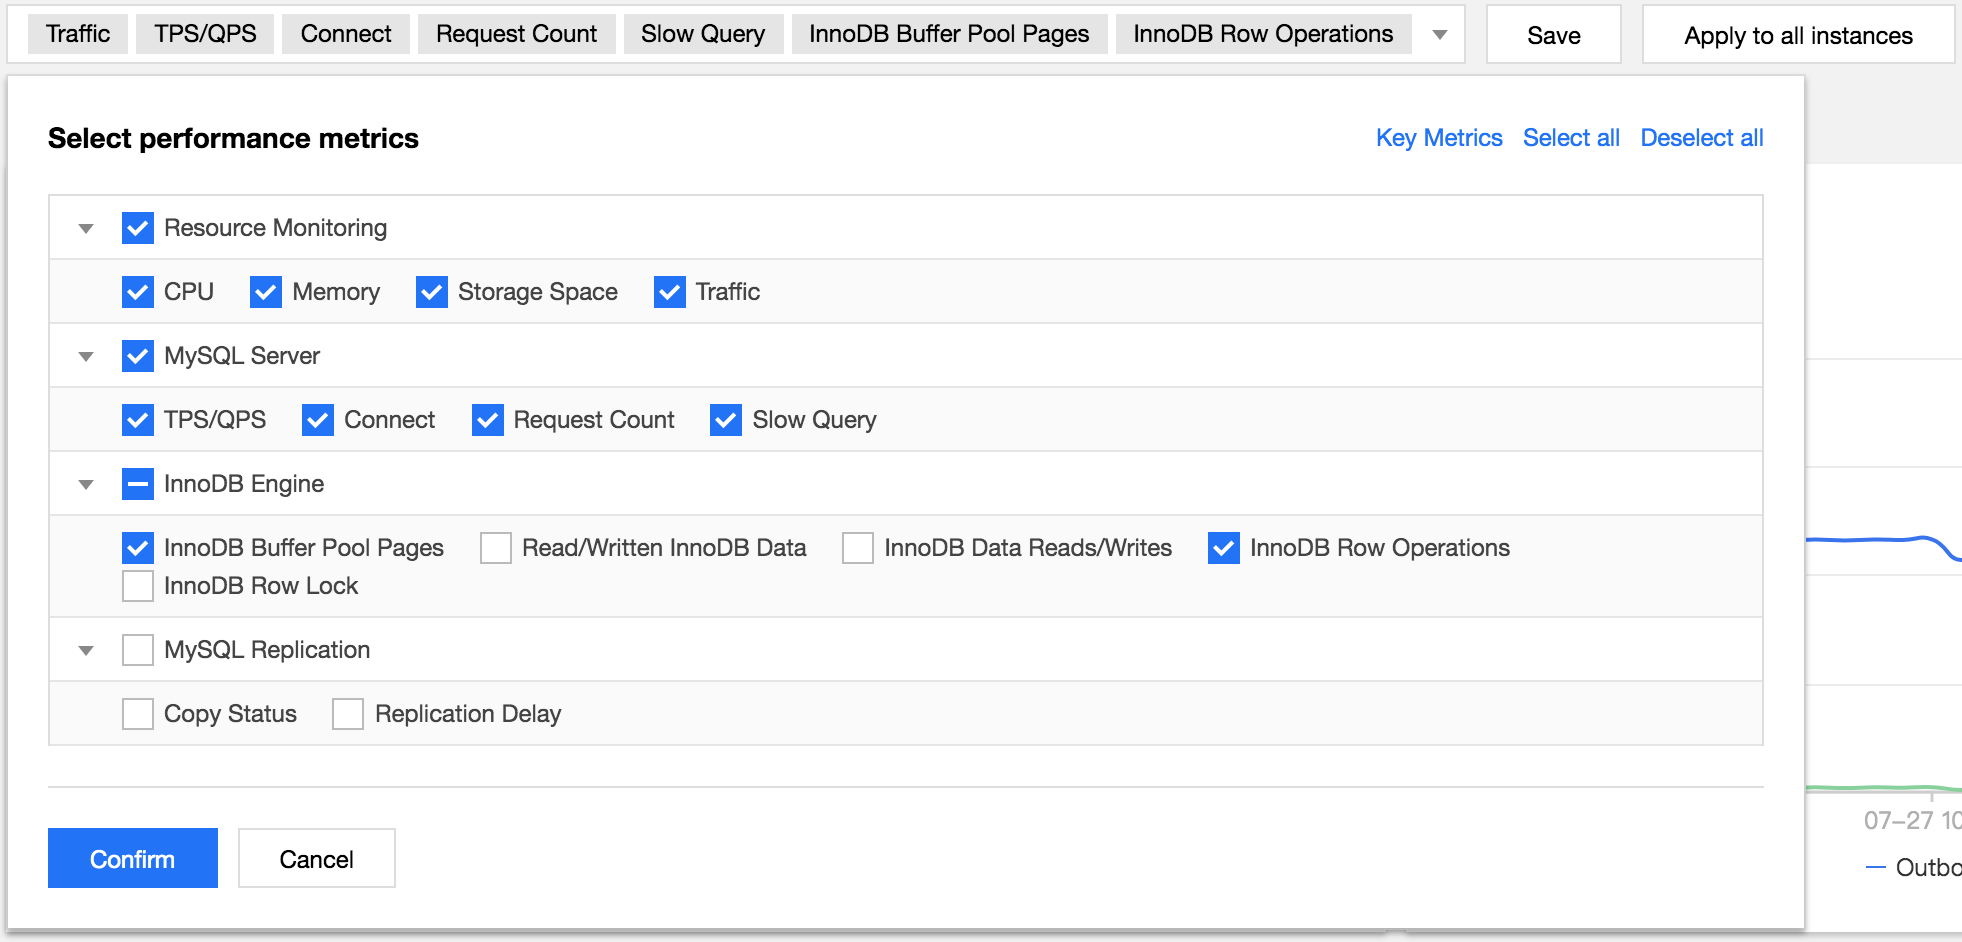
Category | Subcategory | Metric |
Resource Monitoring | CPU | CPU |
| Memory | Memory |
| | Memory Usage |
| Storage Space | Disk Utilization |
| | Occupied Disk Space |
| Traffic | Outbound Traffic |
| | Inbound Traffic |
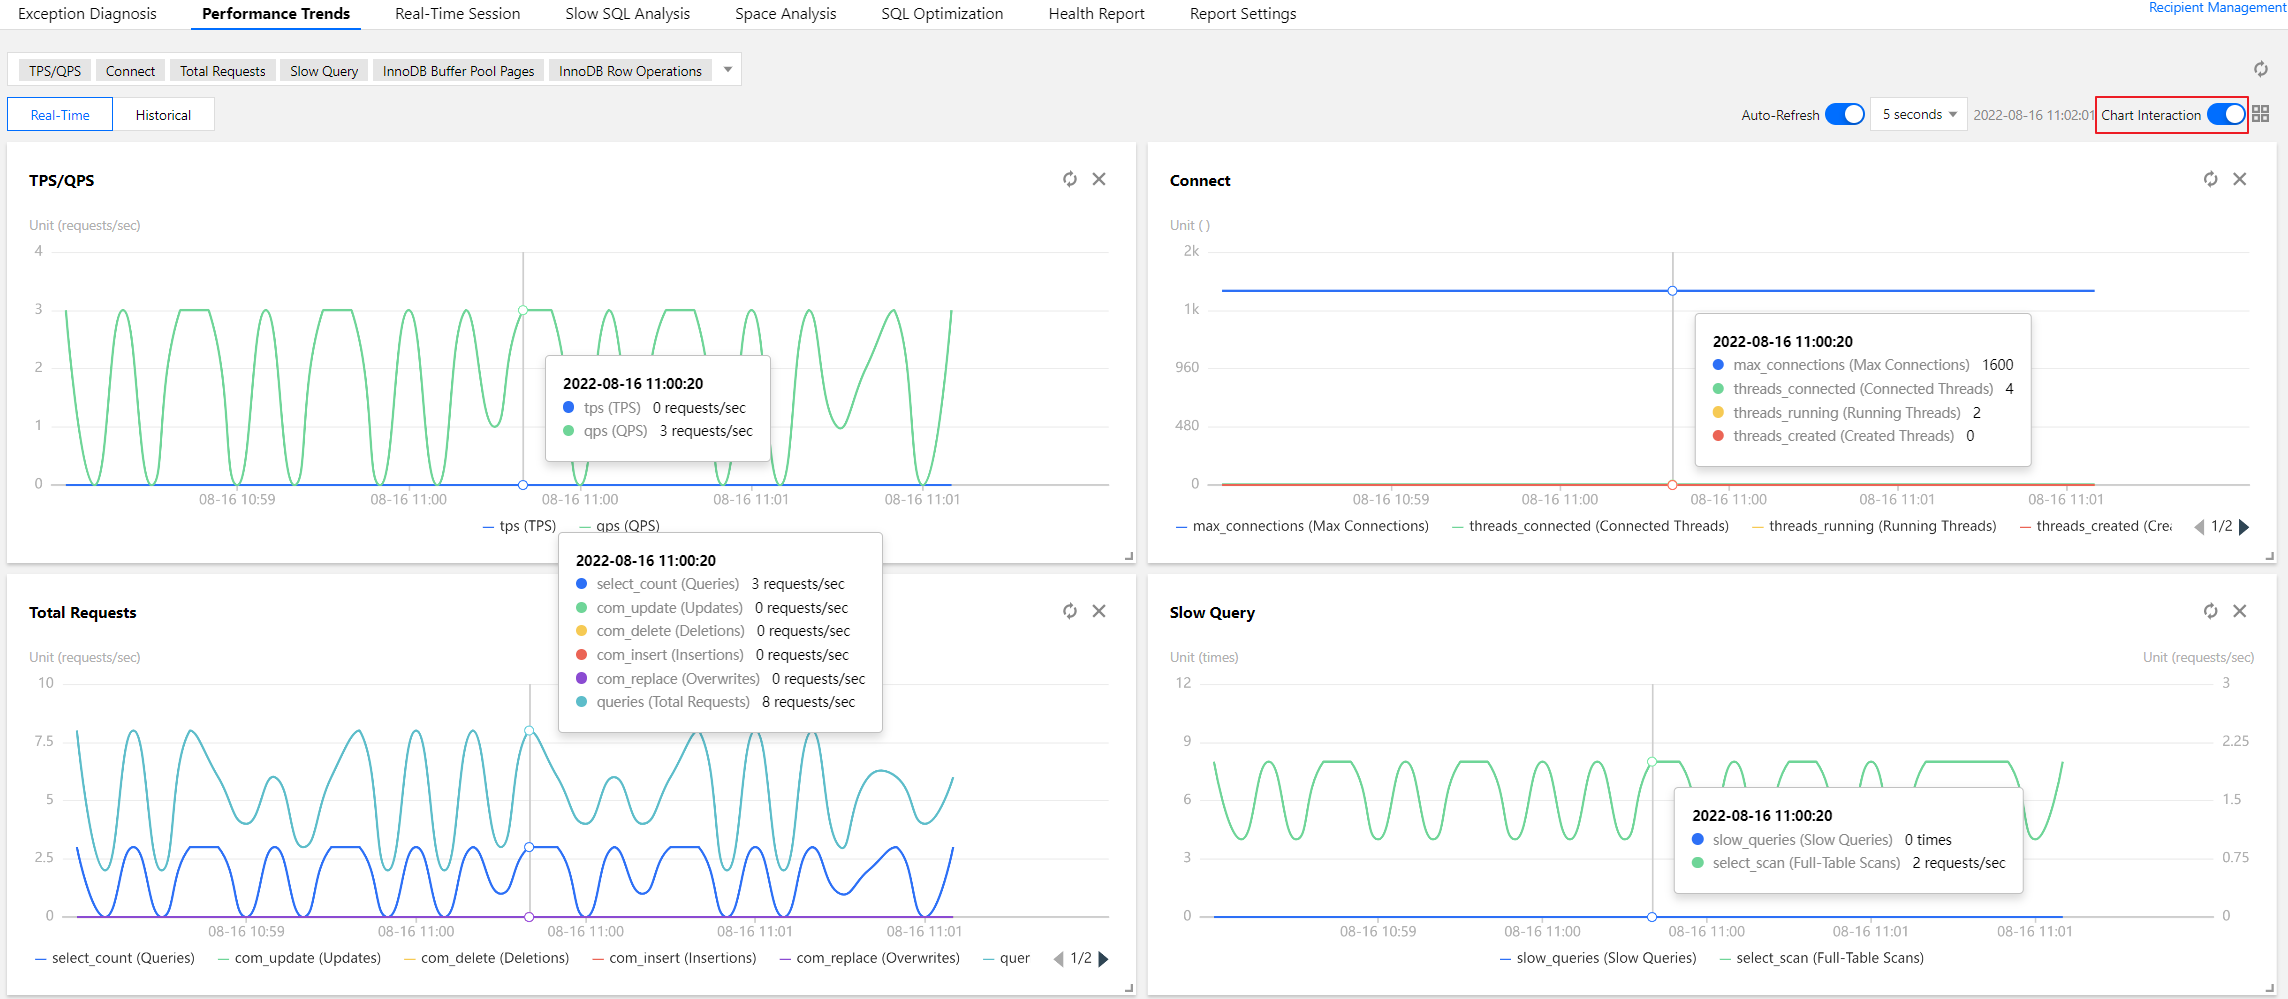
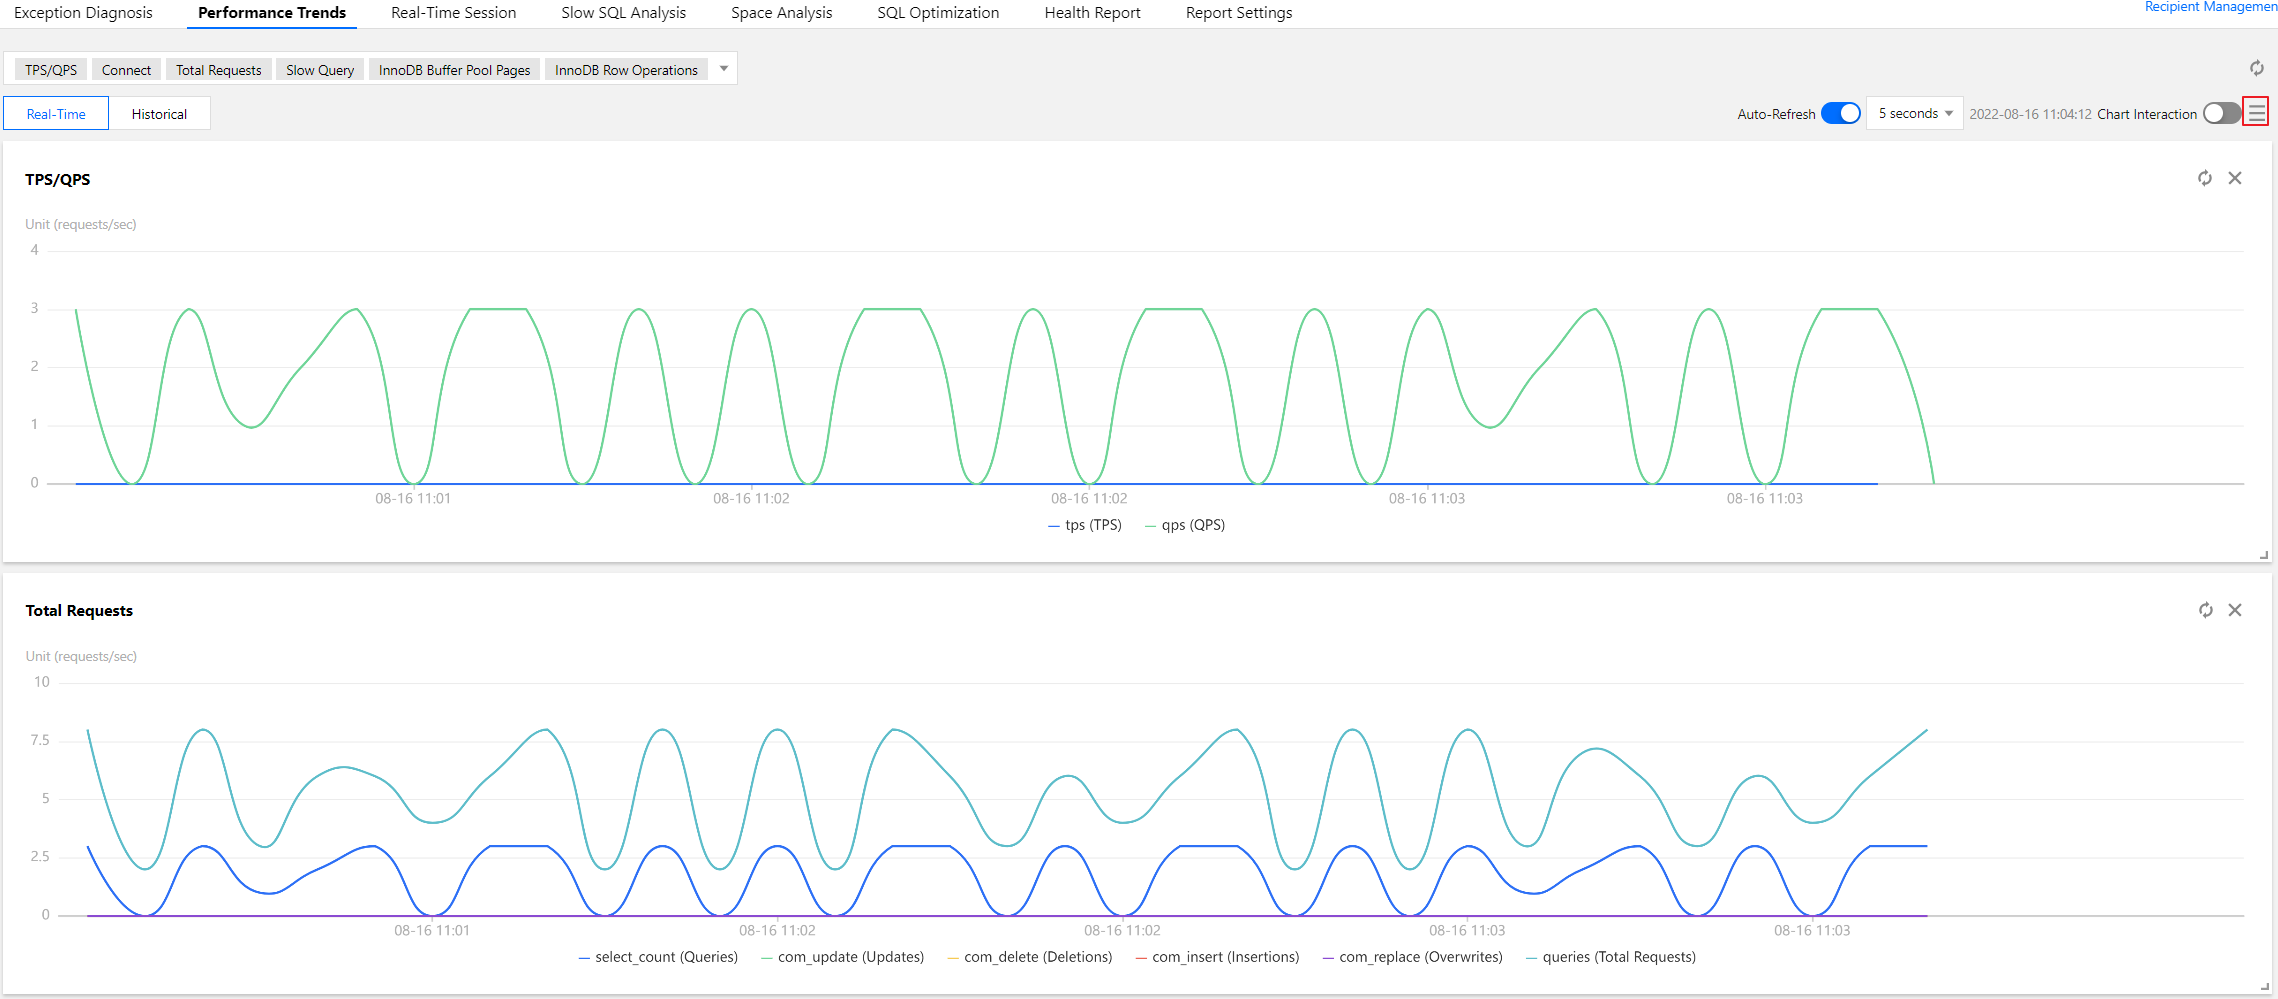
MySQL Server | TPS/QPS | TPS/QPS |
| Connection | Max Connections |
| | Connected Threads |
| | Running Threads |
| | Created Threads |
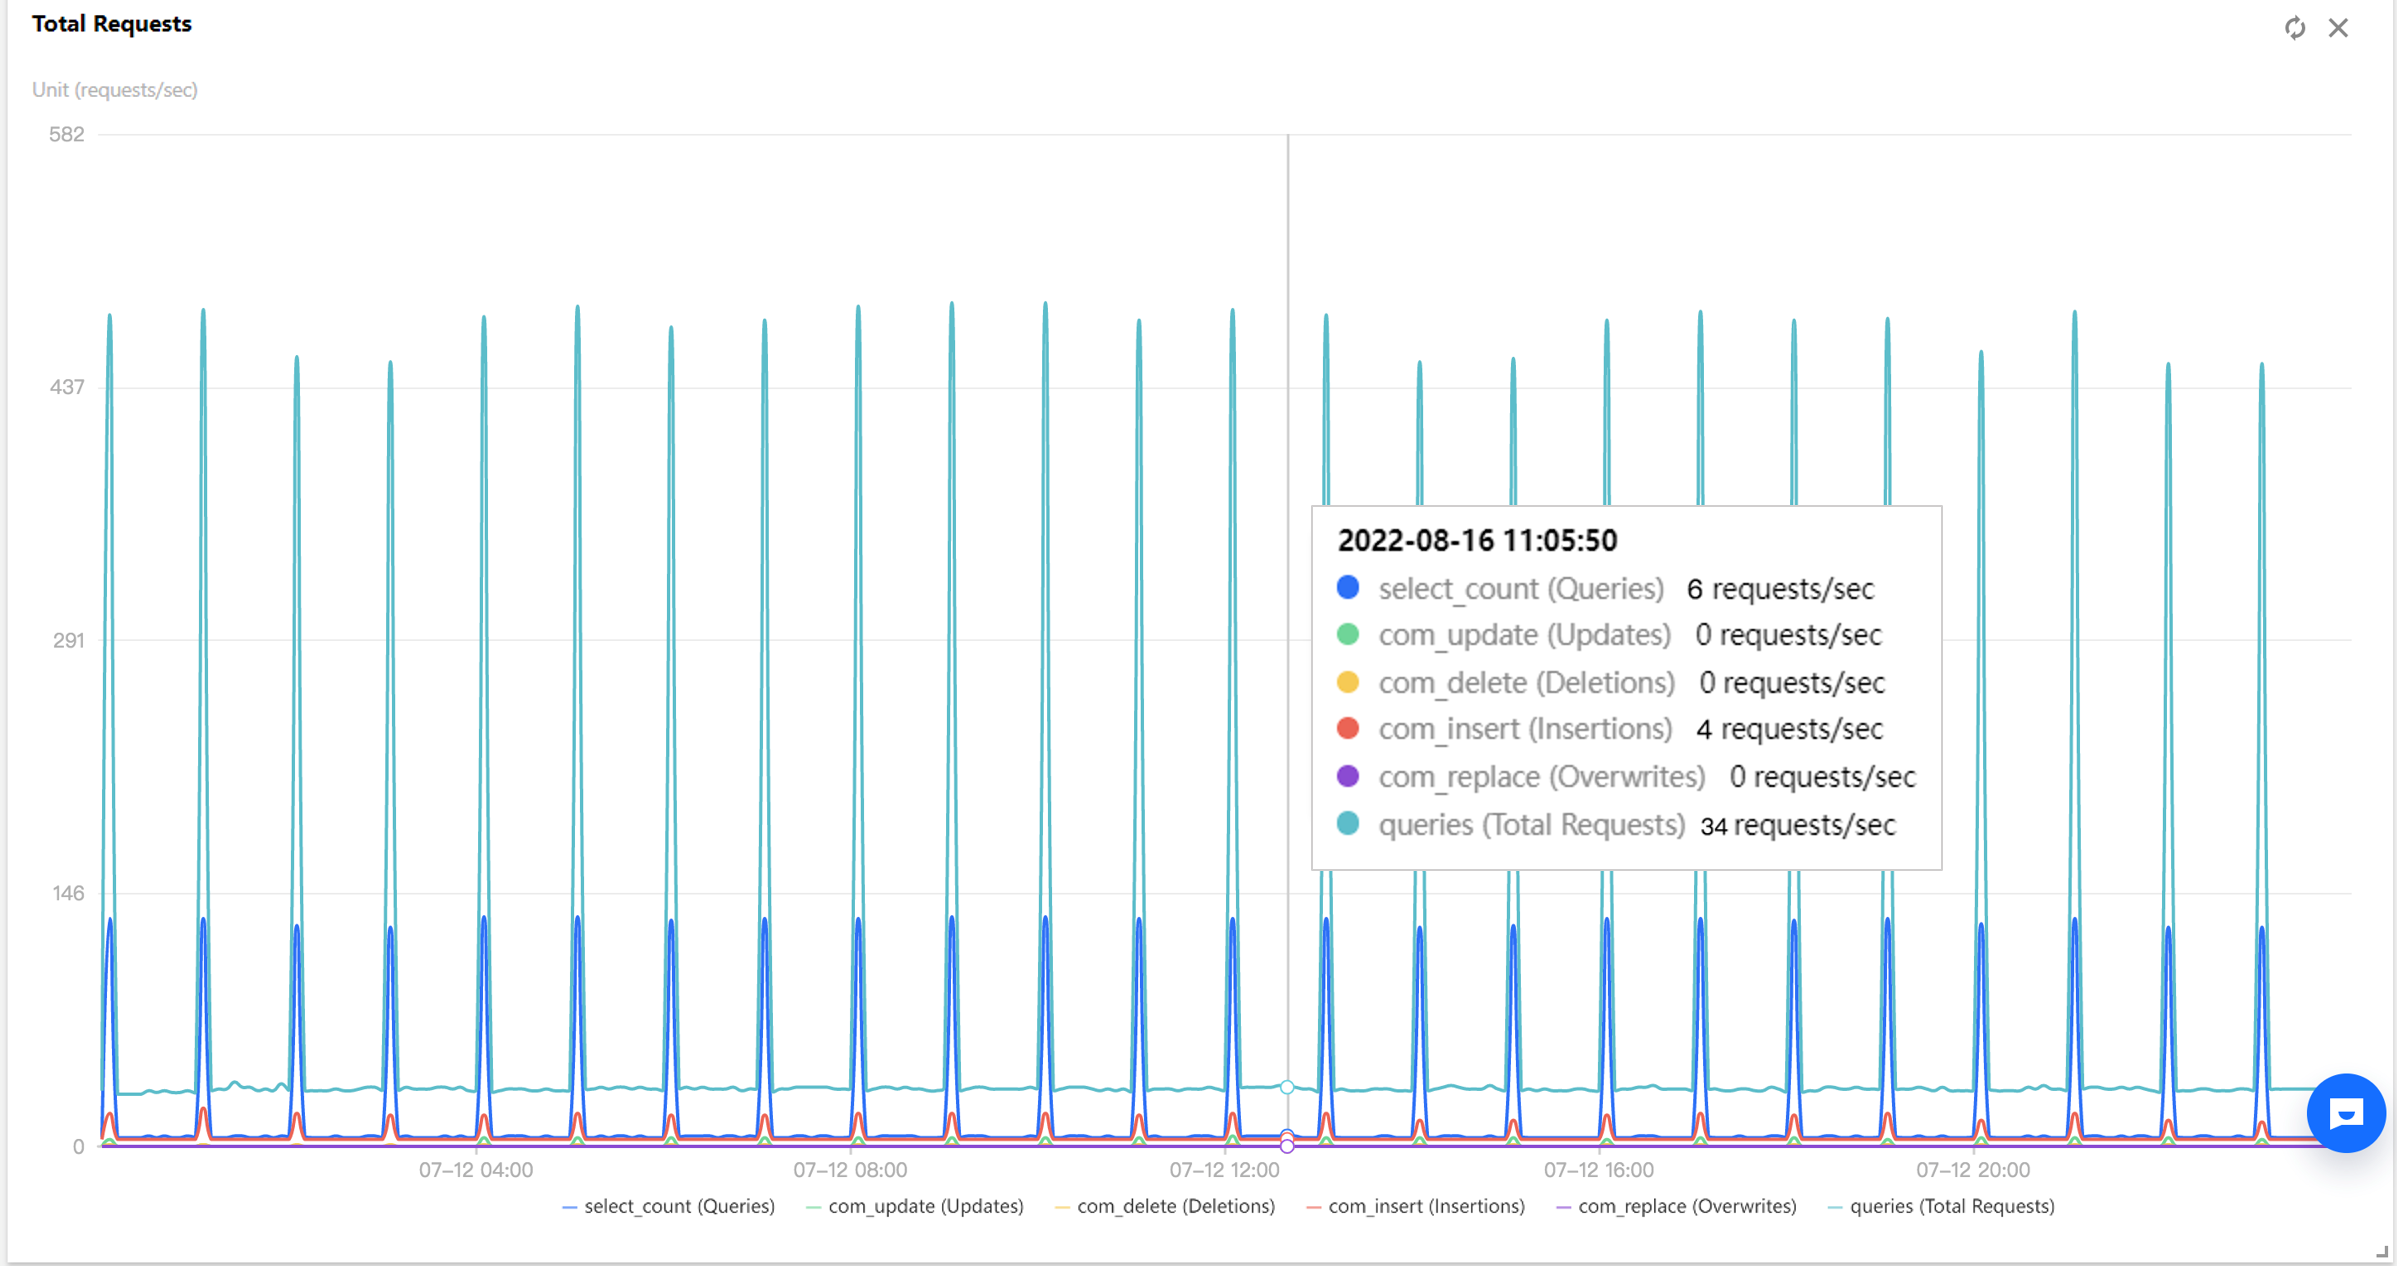
| Requests | Select |
| | Update |
| | Delete |
| | Insert |
| | Replace |
| | Total Requests |
| Slow Query | Slow Queries |
| | Full-Table Scans |
InnoDB Engine | InnoDB Buffer Pool Pages | InnoDB Empty Pages |
| | Total InnoDB Pages |
| | InnoDB Logical Reads |
| | InnoDB Physical Reads |
| Read/Written InnoDB Data | InnoDB Reads |
| | InnoDB Writes |
| InnoDB Data Reads/Writes | Total InnoDB Reads |
| | Total InnoDB Writes |
| InnoDB Row Operations | InnoDB Rows Deleted |
| | InnoDB Rows Inserted |
| | InnoDB Rows Updated |
| | InnoDB Rows Read |
| InnoDB Row Lock | InnoDB Row Lock Waits |
| | Average InnoDB Row Lock Acquiring Time |
MySQL Replication | Replication Status | Source-Replica Delay Distance |
| | Source-Replica Delay Time |
| Replication Delay | IO Thread Status |
| | SQL Thread Status |
Monitoring Metric | Agent Access | Direct Access | ||
Resource Monitoring | CPU | CPU | ✓ | × |
| Memory | Memory | ✓ | × |
| | Memory Usage | ✓ | × |
| Storage Space | Storage Utilization | ✓ | × |
| | Used Storage Space | ✓ | × |
| Traffic | Outbound Traffic | ✓ | ✓ |
| | Inbound Traffic | ✓ | ✓ |
MySQL Server | TPS/QPS | TPS/QPS | ✓ | ✓ |
| Connection | Max Connections | ✓ | ✓ |
| | Connected Threads | ✓ | ✓ |
| | Running Threads | ✓ | ✓ |
| | Created Threads | ✓ | ✓ |
| Requests | Select | ✓ | ✓ |
| | Update | ✓ | ✓ |
| | Delete | ✓ | ✓ |
| | Insert | ✓ | ✓ |
| | Replace | ✓ | ✓ |
| | Total Requests | ✓ | ✓ |
| Slow Query | Slow Queries | ✓ | ✓ |
| | Full-Table Scans | ✓ | ✓ |
InnoDB Engine | InnoDB Buffer Pool Pages | InnoDB Empty Pages | ✓ | ✓ |
| | Total InnoDB Pages | ✓ | ✓ |
| | InnoDB Logical Reads | ✓ | ✓ |
| | InnoDB Physical Reads | ✓ | ✓ |
| Read/Written InnoDB Data | InnoDB Reads | ✓ | ✓ |
| | InnoDB Writes | ✓ | ✓ |
| InnoDB Data Reads/Writes | Total InnoDB Reads | ✓ | ✓ |
| | Total InnoDB Writes | ✓ | ✓ |
| InnoDB Row Operations | InnoDB Rows Deleted | ✓ | ✓ |
| | InnoDB Rows Inserted | ✓ | ✓ |
| | InnoDB Rows Updated | ✓ | ✓ |
| | InnoDB Rows Read | ✓ | ✓ |
| InnoDB Row Lock | InnoDB Row Lock Waits | ✓ | ✓ |
| | Average InnoDB Row Lock Acquiring Time | ✓ | ✓ |
Category | Subcategory | Metric |
Resource Monitoring | CPU | CPU |
| Memory | Memory |
| | Memory Usage |
| Storage Space | Storage Utilization |
| | Used Storage Space |
| Traffic | Outbound Traffic |
| | Inbound Traffic |
MySQL Server | TPS/QPS | TPS/QPS |
| Connection | Max Connections |
| | Connected Threads |
| | Running Threads |
| | Created Threads |
| Requests | Select |
| | Update |
| | Delete |
| | Insert |
| | Replace |
| | Total Requests |
| Slow Query | Slow Queries |
| | Full-Table Scans |
InnoDB Engine | InnoDB Row Operations | InnoDB Rows Deleted |
| | InnoDB Rows Inserted |
| | InnoDB Rows Updated |
| | InnoDB Rows Read |
| InnoDB Buffer Pool Pages | InnoDB Logical Reads |
| | InnoDB Logical Writes |
MySQL Replication | Replication Status | Replication Status of Replica Instance |
| Replication Delay | Redo Log LSN Difference between Source and Replica Instances |
| | Replica Instance Delay in Redo Log Based Replication |


Was this page helpful?
You can also Contact sales or Submit a Ticket for help.
Help us improve! Rate your documentation experience in 5 mins.
Feedback