Integrating with TMP of Cloud Monitor
TDMQ for RocketMQ has integrated with the TencentCloud Managed Service for Prometheus (TMP) - Cloud Monitor module on Tencent Cloud Observability Platform (TCOP). This module integrates fundamental monitoring capabilities of cloud products. TMP ensures unified data collection, storage, and visualized display, enabling more automated online Ops.
Step 1: Creating a TDMQ for RocketMQ Cluster Instance
1. Log in to the TDMQ for RocketMQ console.
2. In the left sidebar, choose Resource > Cluster, and click Create Cluster in the upper-left corner to go to the purchase page.
3. On the purchase page, select the region, availability zone (AZ), cluster type and model, cluster specifications, and other information. For detailed parameter descriptions, see Creating a Cluster.
4. After the information is specified, click Buy Now, wait for the cluster to be created, and record the cluster ID for subsequent use in TMP monitoring data collection configuration.

Step 2: Collecting Monitoring Data with TMP
1. Log in to TCOP and select TMP. If no TMP instance exists, click Create to create one. For detailed instructions, see Creating a TMP Instance.
Note:
When a TMP instance is created, ensure that the bound virtual private cloud (VPC) network and subnet are consistent with the vpcId and subnetId in Step 1; otherwise, network connectivity issues occur.

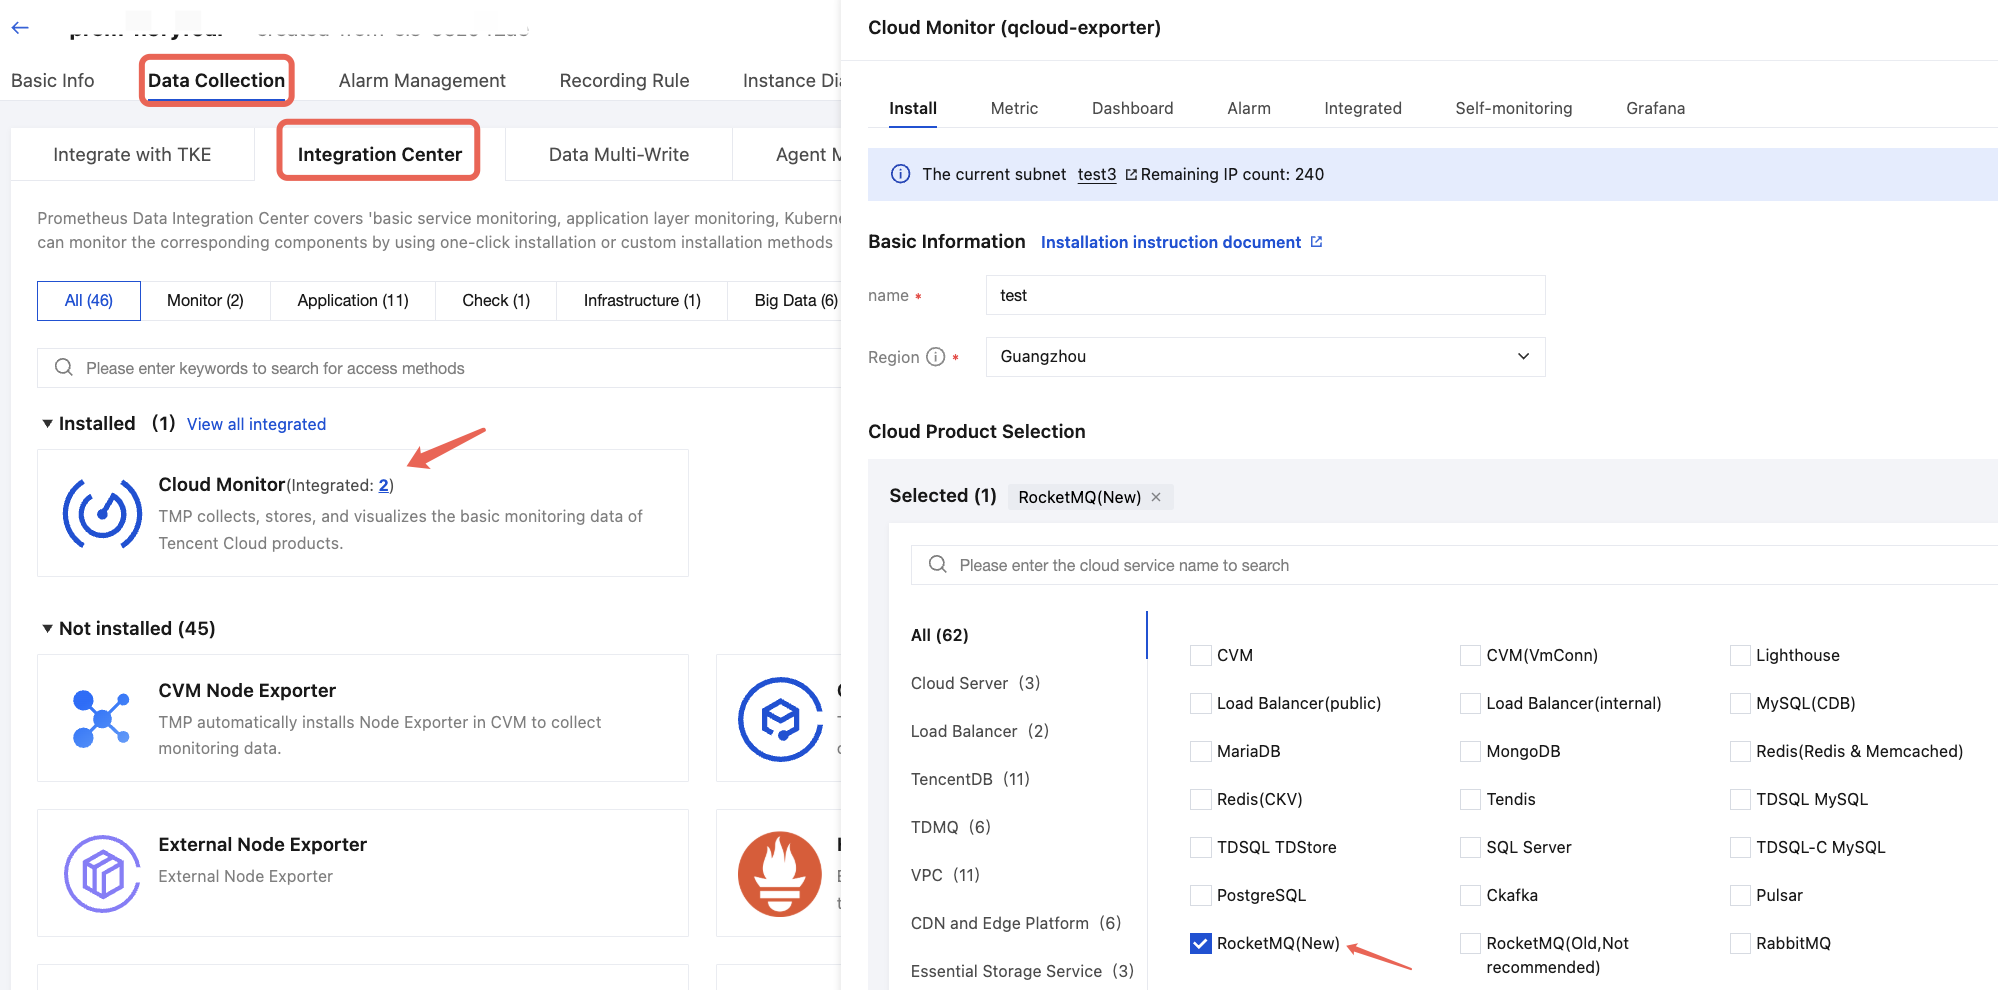
2. In the instance list, click a TMP instance to go to the instance details page. Choose Data Collection > Integration Center, locate Cloud Monitor in Monitoring, and click it to go to the details page.
3. In the pop-up window, enter the basic information and select a region. Select RocketMQ (New) for Cloud Product.


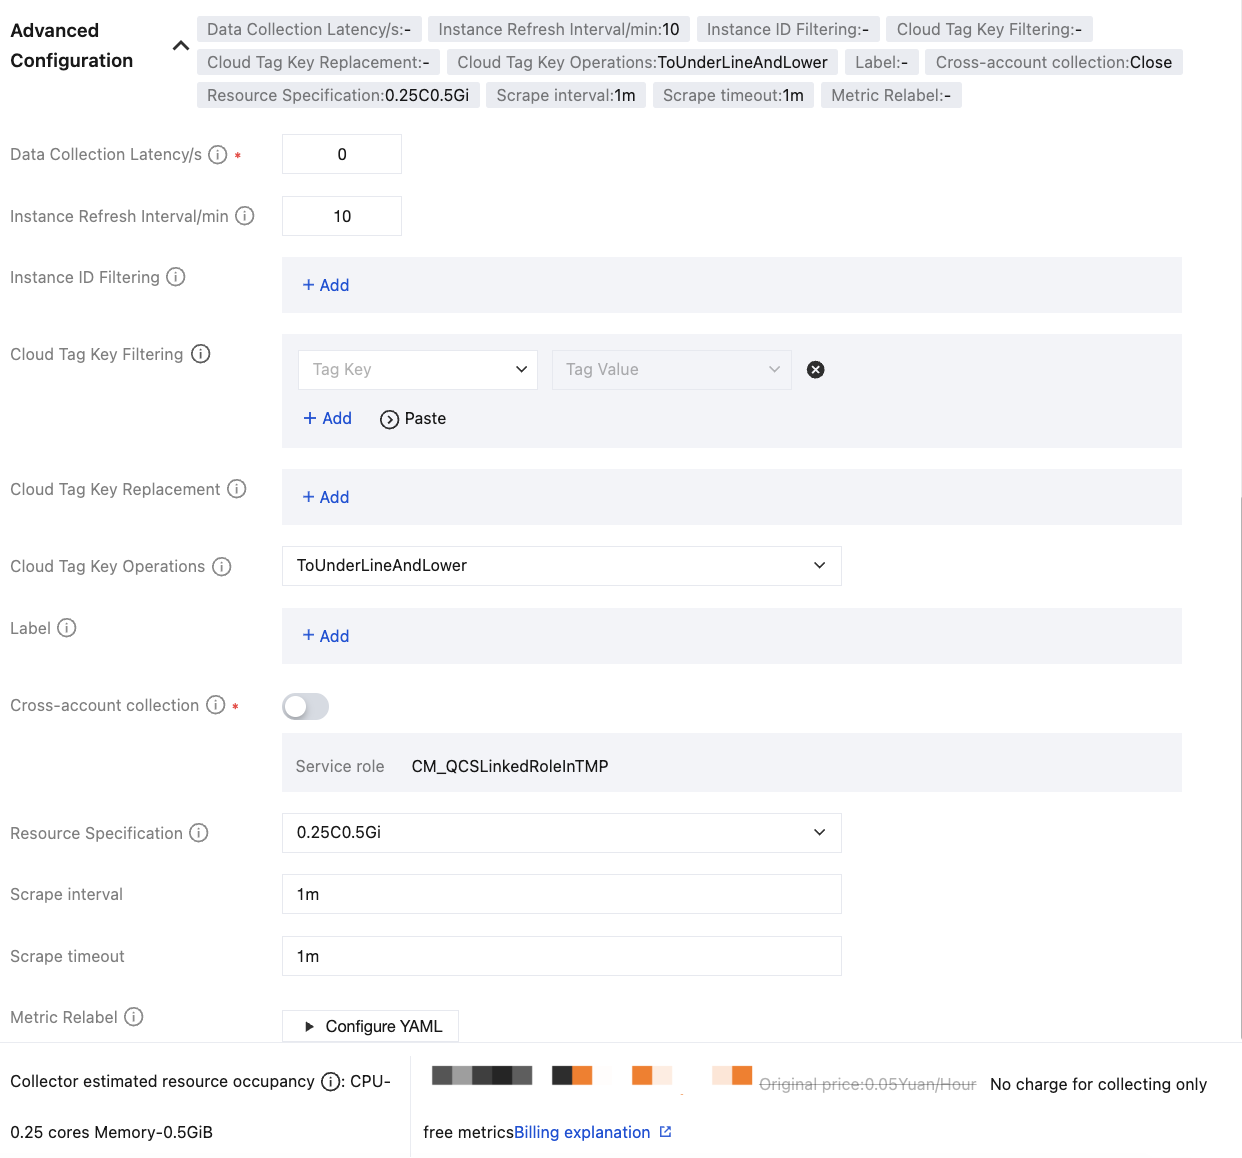
The following table describes parameter configurations.
Parameter | Description |
Name | Integration name, which should meet the following naming requirements: The name must be unique. The name should conform to the following regular expression: '^[a-z0-9]([-a-z0-9]*[a-z0-9])?(\\.[a-z0-9]([-a-z0-9]*[a-z0-9])?)*$'. |
Region | Region where the TDMQ for RocketMQ instance to be collected is located. It is required. |
Data Collection Latency/s | The unit is seconds. If it is set to 0, the timestamp of the original data will be ignored. If it is set to a value greater than 0, the timestamp of the original data will be reported. Since there is a certain delay in reporting monitoring data to the Basic Monitoring module, this delay will be reflected in the latest data. Data pulling range: (Current time – Data collection delay – Fixed interval, Current time – Data collection delay) |
Instance Refresh Interval/min | The unit is minutes. The minimum value is 10. At each instance refresh interval, the integration center re-pulls instance information. If the instance name or cloud tag is modified or an instance is added or deleted, the monitoring data is updated within one instance refresh interval. |
Instance ID Filtering | It is optional. If it is left blank, data from all instances under the root account is collected by default. If a key-value pair is specified, only data from the specified instances is selected. When a key-value pair is specified, the key is RocketMQ (New), and the value is the TDMQ for RocketMQ instance IDs you want to monitor, which are separated by commas (,). |
Cloud Tag Key Filtering | It is optional. A key-value pair is specified. One tag key can correspond to multiple tag values, which are separated by vertical bars (|). Take the intersection of different tag keys and take the union of multiple tag values under the same tag key. If instance ID filtering is also configured, cloud tag filtering does not take effect. |
Cloud Tag Key Replacement | It is optional. It is used to replace invalid tag keys with valid values. For example, convert Chinese names to custom English names. |
Cloud Tag Key Operations | By default, the integration module converts uppercase letters in tag keys into underscores followed by lowercase letters. Supported tag key conversion operations are as follows: ToUnderLineAndLower: default operation. ToLower: indicates converting all letters to lowercase. NoOperation: indicates that no conversion is performed. |
Label | It is optional. You can add additional custom tags to the metrics collected by the integration module. |
Cross-account collection | Current account role: custom role, used to obtain the temporary key for the current account. Target account role: custom role, used to obtain the temporary key for the target account. Target account UIN: root account ID of the target account. |
Metric Relabel | It is optional. It is the native metricRelabelings configuration for Prometheus Operator. The configuration method is the same as metric_relabel_configs in TMP scrapping configuration, with only different naming conventions for certain fields. |
4. In the scraping task, click the Integrated tab and wait for 2 to 3 minutes. You can see that Operation Status is changed to Deployed. In Targets, you can view specific data scraping targets. Click Metric Details, and you can see the scraped monitoring metrics.

Step 3: Viewing Monitoring Data
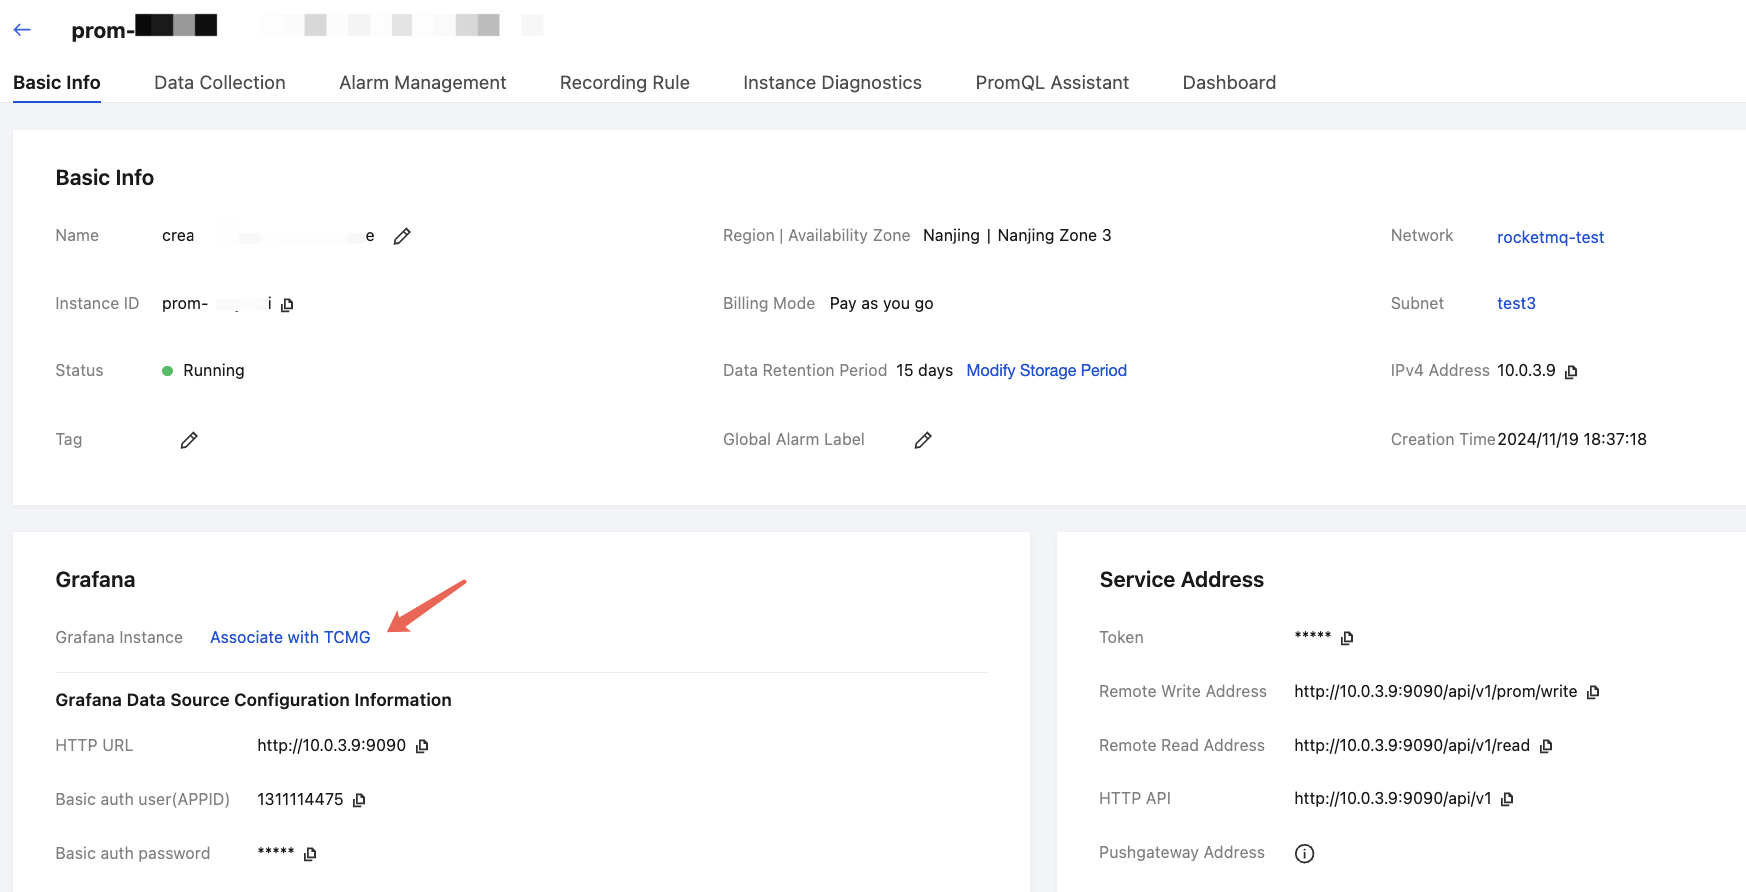
1. Return to the TMP instance details page, click the Basic Information tab, and bind a TencentCloud Managed Service for Grafana (TCMG) instance in the Grafana card. If no TCMG instance exists, create one first. For detailed creation instructions, see TencentCloud Managed Service for Grafana.
Note:
The VPC network and subnet of the bound or newly created TCMG instance must match the vpcId and subnetId specified in 4 of Step 1; otherwise, network connectivity issues occur.

2. After a TCMG instance is bound, choose Data Collection > Integration Center. On the Integration Center page, locate and click Cloud Monitor, and then choose Dashboard > Dashboard Operation > Install/Upgrade Dashboard, and click Install/Upgrade to install the Grafana dashboard.
3. Select Integrated, and click the Grafana icon in the integrated list to automatically open the Cloud Monitor integration dashboard list. Select RocketMQ (New) to view instance-related monitoring data.
Help and Support
Was this page helpful?
You can also Contact sales or Submit a Ticket for help.
Help us improve! Rate your documentation experience in 5 mins.
Feedback