- Product Introduction
- Purchase Guide
- Getting Started
- Operation Guide
- Best Practice
- Integration Guide
- Scrape Configuration Description
- Custom Monitoring
- EMR Integration
- Java Application Integration
- Go Application Integration
- Exporter Integration
- Elasticsearch Exporter Integration
- Kafka Exporter Integration
- MongoDB Exporter Integration
- PostgreSQL Exporter Integration
- NGINX Exporter Integration
- Redis Exporter Integration
- MySQL Exporter Integration
- Consul Exporter Integration
- Memcached Exporter Integration
- Integration with Other Exporters
- CVM Node Exporter
- Health Check
- Cloud Monitoring
- Read Cloud-Hosted Prometheus Instance Data via Remote Read
- FAQs
- Service Agreement
- TMP Policy
Scrape Configuration
Last updated: 2021-12-15 18:00:52
This document is currently invalid. Please refer to the documentation page of the product.
You can monitor services in TKE by managing ServiceMonitor or PodMonitor.
Preparations
- The Prometheus agent has been installed in the TKE cluster. For more information, please see Agent Management.
- Click a Cluster ID in the TKE cluster list to enter the Integrate with TKE page.
Directions
- Click Scrape Configuration on the Integrate with TKE page to enter the scrape configuration management page.
- Click Create to pop up the scrape configuration creation page, select the scrape configuration type, and modify the YAML configuration as prompted.
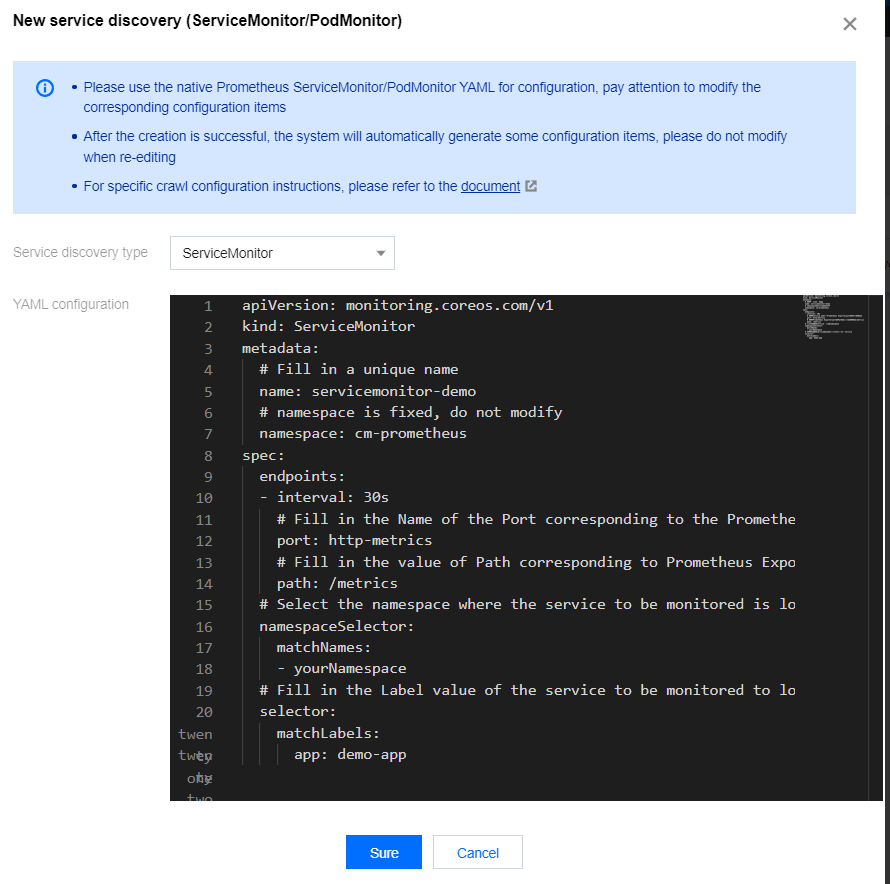
- After completing the configuration, click OK.
Note:
Some configuration items will be automatically generated after the scrape configuration is created. Please do not modify them.

 Yes
Yes
 No
No
Was this page helpful?