- Product Introduction
- Purchase Guide
- Getting Started
- Operation Guide
- Best Practice
- Integration Guide
- Scrape Configuration Description
- Custom Monitoring
- EMR Integration
- Java Application Integration
- Go Application Integration
- Exporter Integration
- Elasticsearch Exporter Integration
- Kafka Exporter Integration
- MongoDB Exporter Integration
- PostgreSQL Exporter Integration
- NGINX Exporter Integration
- Redis Exporter Integration
- MySQL Exporter Integration
- Consul Exporter Integration
- Memcached Exporter Integration
- Integration with Other Exporters
- CVM Node Exporter
- Health Check
- Cloud Monitoring
- Read Cloud-Hosted Prometheus Instance Data via Remote Read
- FAQs
- Service Agreement
- TMP Policy
Basic Monitoring
Last updated: 2021-12-15 18:00:52
This document is currently invalid. Please refer to the documentation page of the product.
You can choose the basic monitoring components you need when installing the Prometheus agent, but in some cases, you may want to turn on or off some monitoring components later.
Preparations
- The Prometheus agent has been installed in the TKE cluster. For more information, please see Agent Management.
- Click a Cluster ID in the TKE cluster list to enter the Integrate with TKE page.
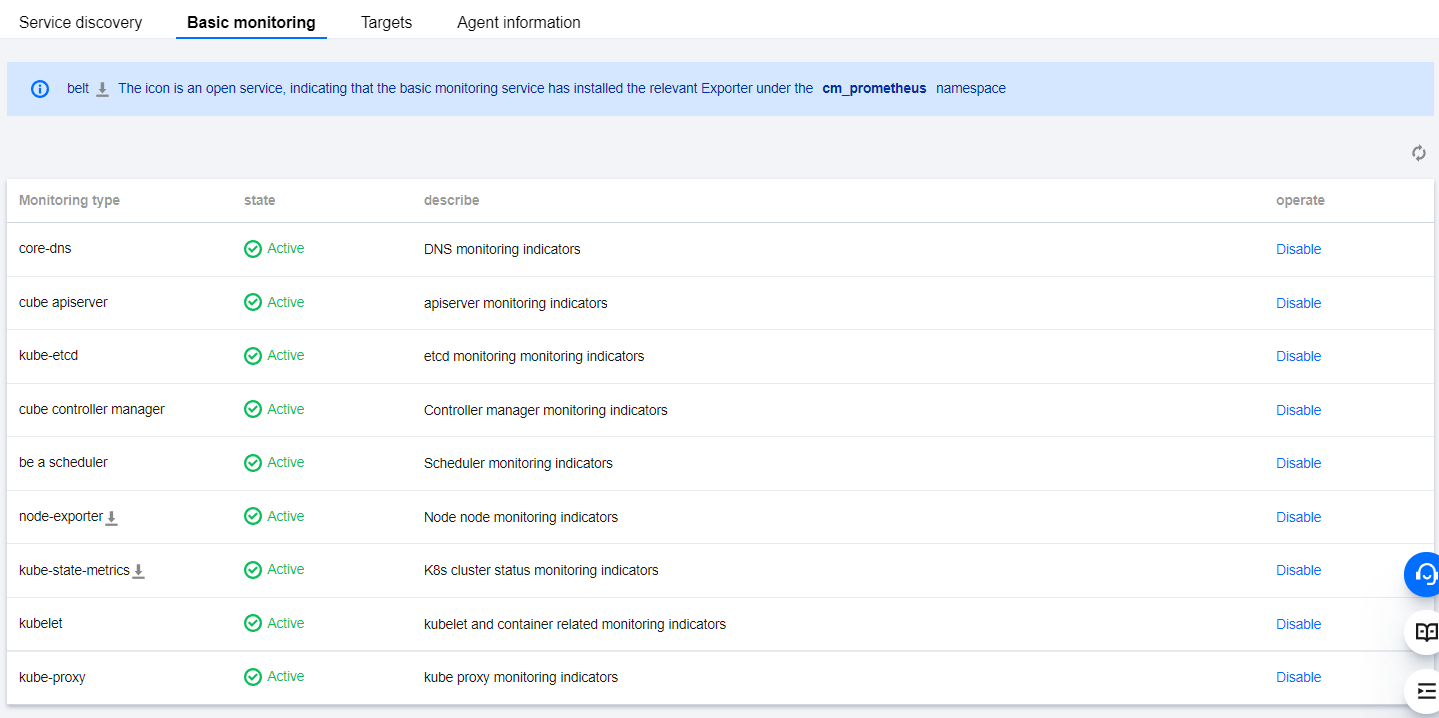
Monitoring Components
| Component | Usage |
|---|---|
| core-dns | Collects DNS monitoring metric data |
| kube-apiserver | Collects APISever monitoring metric data |
| kube-etcd | Collects Etcd monitoring metric data |
| kube-controller-manager | Collects Controller Manager monitoring metric data |
| kube-scheduler | Collects Scheduler monitoring metric data |
| node-exporter | Collects node monitoring metric data |
| kube-state-metrics | Collects TKE cluster status monitoring metric data |
| kubelet | Collects Kubelet and container monitoring metric data |
| kube-proxy | Collects Kube Proxy monitoring metric data |
Directions
- In the basic monitoring component list, you can enable components in the Disabled status.
- In the basic monitoring component list, you can disable components in the Enabled status.
 Note:
Note:The corresponding operation is asynchronous and takes about 2–3 minutes.

 Yes
Yes
 No
No
Was this page helpful?