Evaluation-based visual comparison provides an intuitive display of metric comparison effects for different models through radar charts. It allows direct, quick selection and comparison based on evaluation metrics from the completed automated evaluation and manual evaluation. It also provides an effect comparison for different models on the same aggregated metrics after the aggregated metrics are configured. The detailed description of its feature is as follows:
Method 1 comparison of evaluation metrics: You can directly perform horizontal comparison on multiple metrics of different models after automated evaluation and manual evaluation are completed.
Method 2 comparison of aggregated metrics: After aggregated metrics are configured, you can select the automated evaluation task to perform horizontal comparison on the same aggregated metrics of different models.
Method 1: Comparison of Evaluation Metrics
Prerequisites
You have completed model evaluation through Automated Evaluation and Manual Evaluation. The status of the automated evaluation task is Completed, and the status of the manual evaluation task is Scoring Completed.
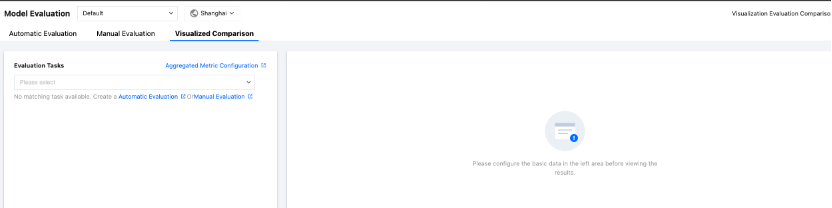
Configuring the Visual Comparison Chart
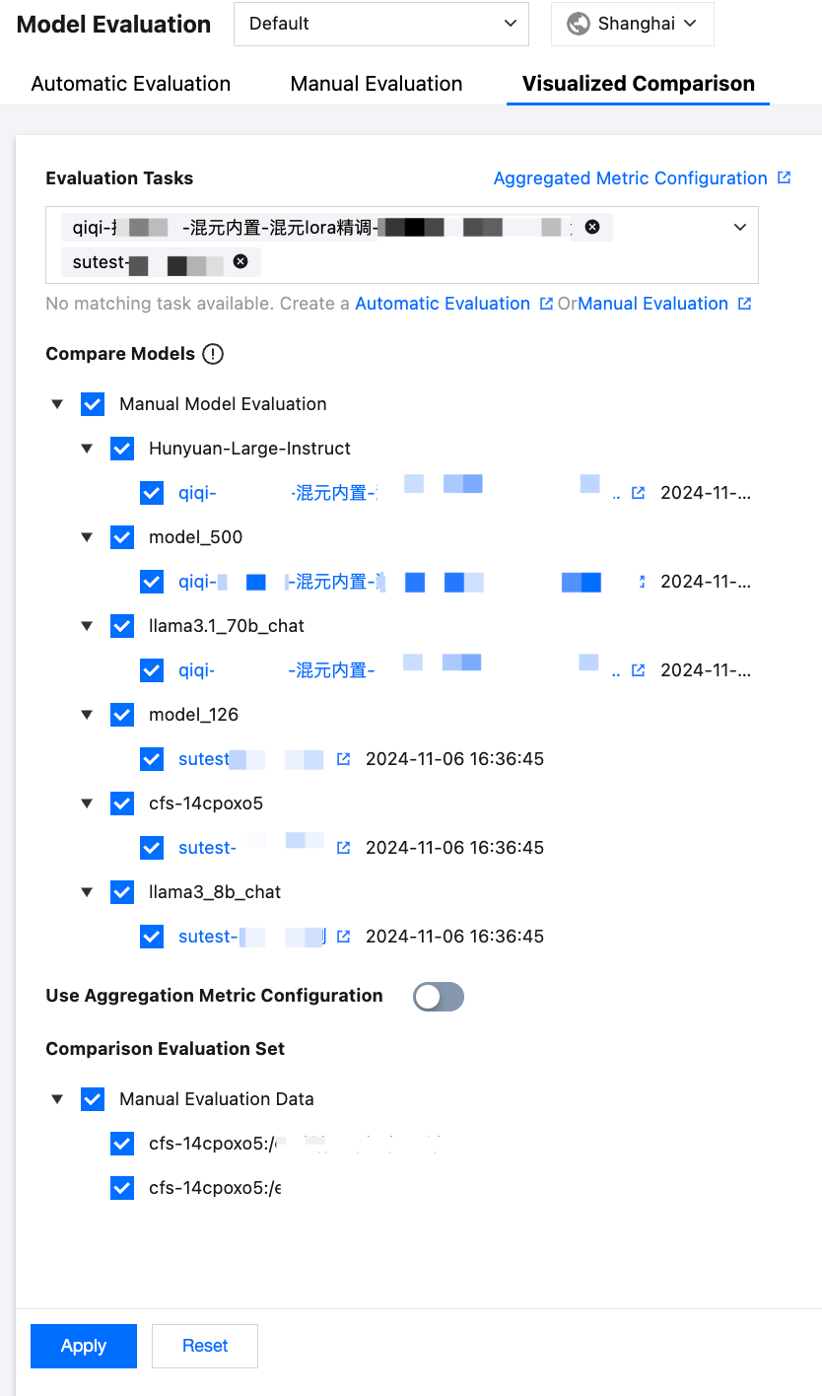
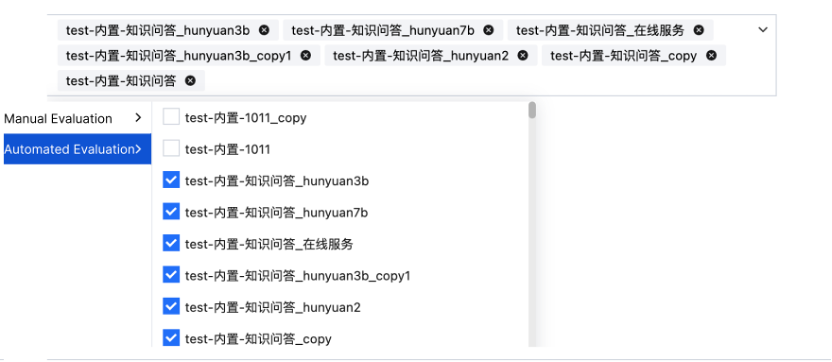
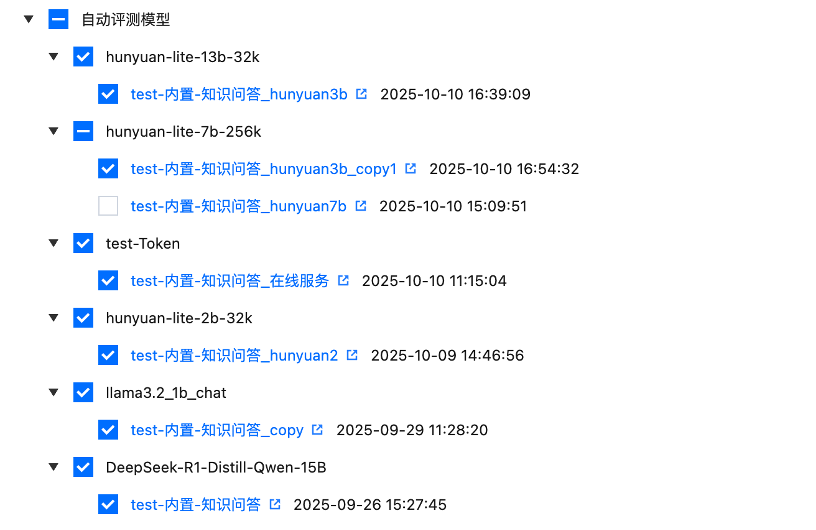
1. Select evaluation tasks. You can select the automated evaluation tasks in Completed status and the manual evaluation tasks in the Scoring Completed status. A maximum of 10 tasks can be selected.
2. After evaluation tasks are selected, the evaluation data sets and models used by the selected tasks will be automatically displayed. Both data sets and models are selected by default, but you can deselect them as needed. Evaluation tasks related to these models will be listed according to the latest evaluation time, and you can select related evaluation tasks, as shown in the following figure:
Note:
You can select multiple evaluation tasks. If you select multiple evaluation tasks that contain the same model and evaluation set, the values for the same model on the same evaluation set will be averaged.
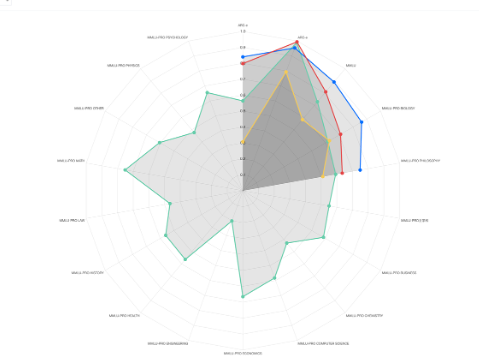
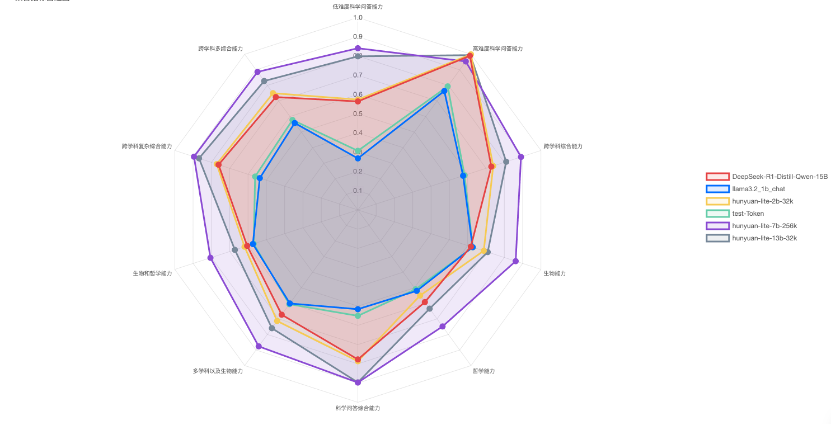
3. Click Apply. The selected evaluation tasks will be displayed on the right side, and a comparison of evaluation metrics will be displayed through a radar chart based on the selected model and data set, as shown in the following figure:
Method 2: Comparison of Aggregated Metrics
Prerequisites
You have configured aggregated metrics, and the status of the automated evaluation task is Completed.
Configuring Aggregated Metrics
Overview:
Aggregated metrics are used to measure specific capabilities of a model. Generally, aggregation is carried out using different metrics from different evaluation sets.
For example, if you want to evaluate the comprehensive general capabilities of a model across multiple disciplines, you can configure aggregated metrics in various dimensions such as low difficulty, high difficulty, interdisciplinary research, biology, and philosophy. In the subsequent comparative evaluation, you can obtain comparison results on the aggregated metrics directly by selecting this configuration.
Usage method:
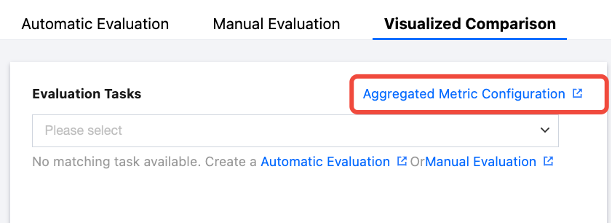
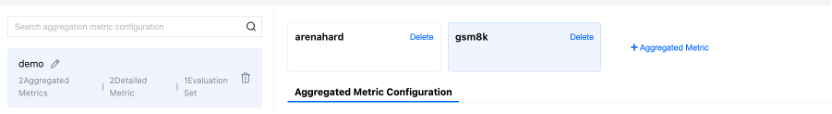
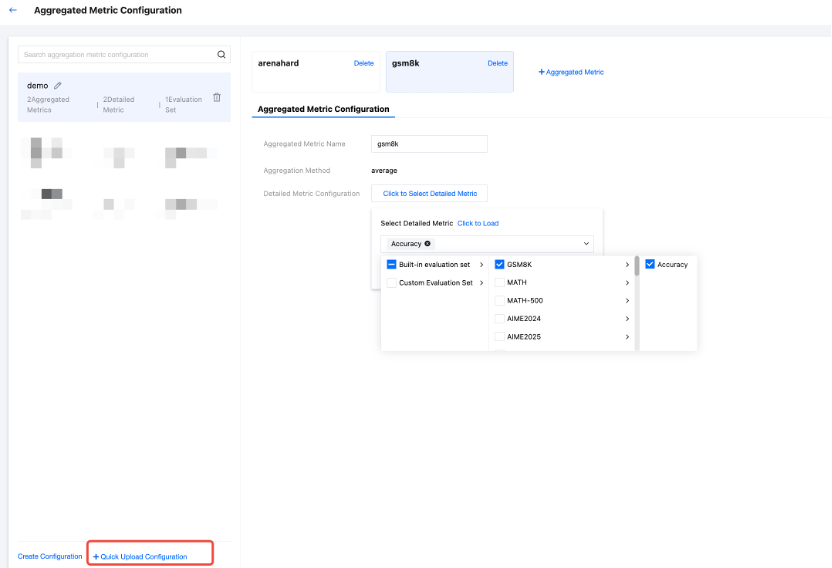
1. Click Aggregated Metrics Configuration to go to the aggregated metric configuration page.
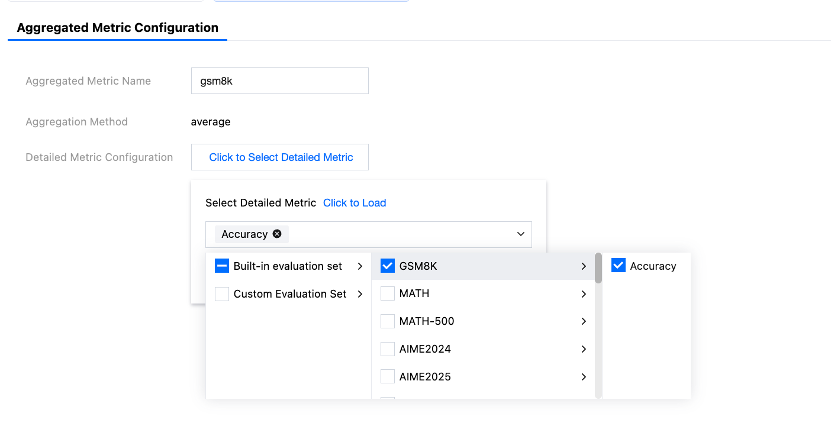
2. Click +Aggregated Metrics to add an aggregated metric card and configure the aggregated metric name.
3. Click Select Detailed Metrics, and select the corresponding evaluation set and metric based on the corresponding aggregated metric.
4. Quick configuration is supported. You can rapidly define and manage the aggregation rules of evaluation metrics for multiple data sets through a YAML configuration file.
Configuration file format: Only the YAML format is supported. Supported file extensions: .yaml and .yml.
Basic structure: A configuration file for aggregated metrics can contain multiple aggregated metrics, and you can configure them separately.
-name: test # Name of an aggregated metric.
method: average # Aggregation method.
metrics:# Metric configuration list.
-data_name:"MMLU"# Data set name.
metric_names:# List of metric names.
-"accuracy"
-"pass@1"
-data_name:"aime2025"
metric_names:
-"fluency"
-"correlation"
Configuration parameter description
Parameter Name
Parameter Description
Parameter Example
name
Name of an aggregated metric.
test
method
Aggregation calculation method. Currently, average (average value) is supported.
average
metrics
Metric configuration array. It is used to define the data sets and metrics to be aggregated.
-
data_name
Data set name. It corresponds to the data set of an evaluation task.
"MMLU"
metric_names
Metric name array. It is used to list the metrics to be aggregated under the data set.
"accuracy"
Usage example
Create aggregated metric configurations and a YAML file (for example, aggregation_config.yaml), and define aggregation rules in the format above:
-name:"comprehensive evaluation metric"
method: average
metrics:
-data_name:"MMLU"
metric_names:
-"accuracy"
-"pass@1"
-data_name:"GSM8K"
metric_names:
-"accuracy"
-"exact_match"
-data_name:"HumanEval"
metric_names:
-"pass@1"
-"pass@10"
-name:"mathematical inference capability"
method: average
metrics:
-data_name:"GSM8K"
metric_names:
-"accuracy"
-data_name:"MATH"
metric_names:
-"accuracy"
-"step_accuracy"
Configuring the Visual Comparison Chart
1. Select Evaluation Tasks. A maximum of 10 automated evaluation tasks in the Completed status can be selected.
2. After evaluation tasks are selected, the model used by the selected tasks will be automatically displayed. The evaluation tasks related to this model will be listed based on the latest evaluation time. You can select related evaluation tasks.
Note:
You can select multiple evaluation tasks. If multiple evaluation tasks that contain "a model evaluates an evaluation set" are selected, the values of the evaluation metrics of this model on this evaluation set will be averaged.
3. Enable the Use Aggregated Metric Configuration switch and select aggregated metric configuration.
The evaluation sets in the aggregated metric configuration will be listed. You can select the evaluation sets to be compared as needed. Note: When an evaluation set is deselected, the aggregated metrics related to this evaluation set will not be involved in the comparison.
4. In addition, you can also select the evaluation result file (in JSONL format) through Cloud File Storage (CFS). During the comparison evaluation, the platform will display comparison results based on the evaluation result file and the selected tasks mentioned above.
Description for local evaluation result specifications:
5. Click Apply. The selected evaluation tasks will be displayed on the right side, and a comparison will be displayed through a radar chart based on the selected model and aggregated metrics, as shown in the following figure.
In addition, the capabilities of each model on aggregated metrics will be ranked. You can also find the detailed data of each aggregated metric, as well as the detailed data of each metric on each evaluation set, from the table. The table uses cells with different shades of colors to help you easily and intuitively view the optimal value of each aggregated metric and other metric values.
You can quickly filter models in the search box in the upper-right corner to view the results of aggregated metrics.
Click the Detailed Metrics tab to view the detailed metric values of each model on the corresponding evaluation set.
It supports statistics on model participation in evaluations from the dimensions of aggregated metrics and evaluation sets, allowing you to intuitively check whether models have already been evaluated on key evaluation sets.
Note:
1. A comparison mode is selected for the radar chart by default, and it can be deselected in the upper-right corner. When it is selected, it indicates that the size is scaled from an absolute value to a relative value, making it easier to compare and display models.
2. Visualization display: You can click the model name on the right side not to display the data of the current model on the radar chart, and click it again to display its data. If you hover the mouse pointer over each point on the radar chart, the evaluation results of the current model on the corresponding data set will be displayed.
3. If you reselect an evaluation task, comparison data set, and comparison model, you can click Apply, and the information displayed on the chart on the right side will be updated based on your latest selections. Otherwise, every time you go to this page, the chart will display the corresponding information based on the configurations submitted to which you clicked Apply last time.