EdgeOne provides multi-dimensional, visualized cache analysis by analyzing L7 (application layer) access log data, including time trend curves of traffic, requests, and other metrics, cache status distribution, and TOP rankings.
Supported Capabilities
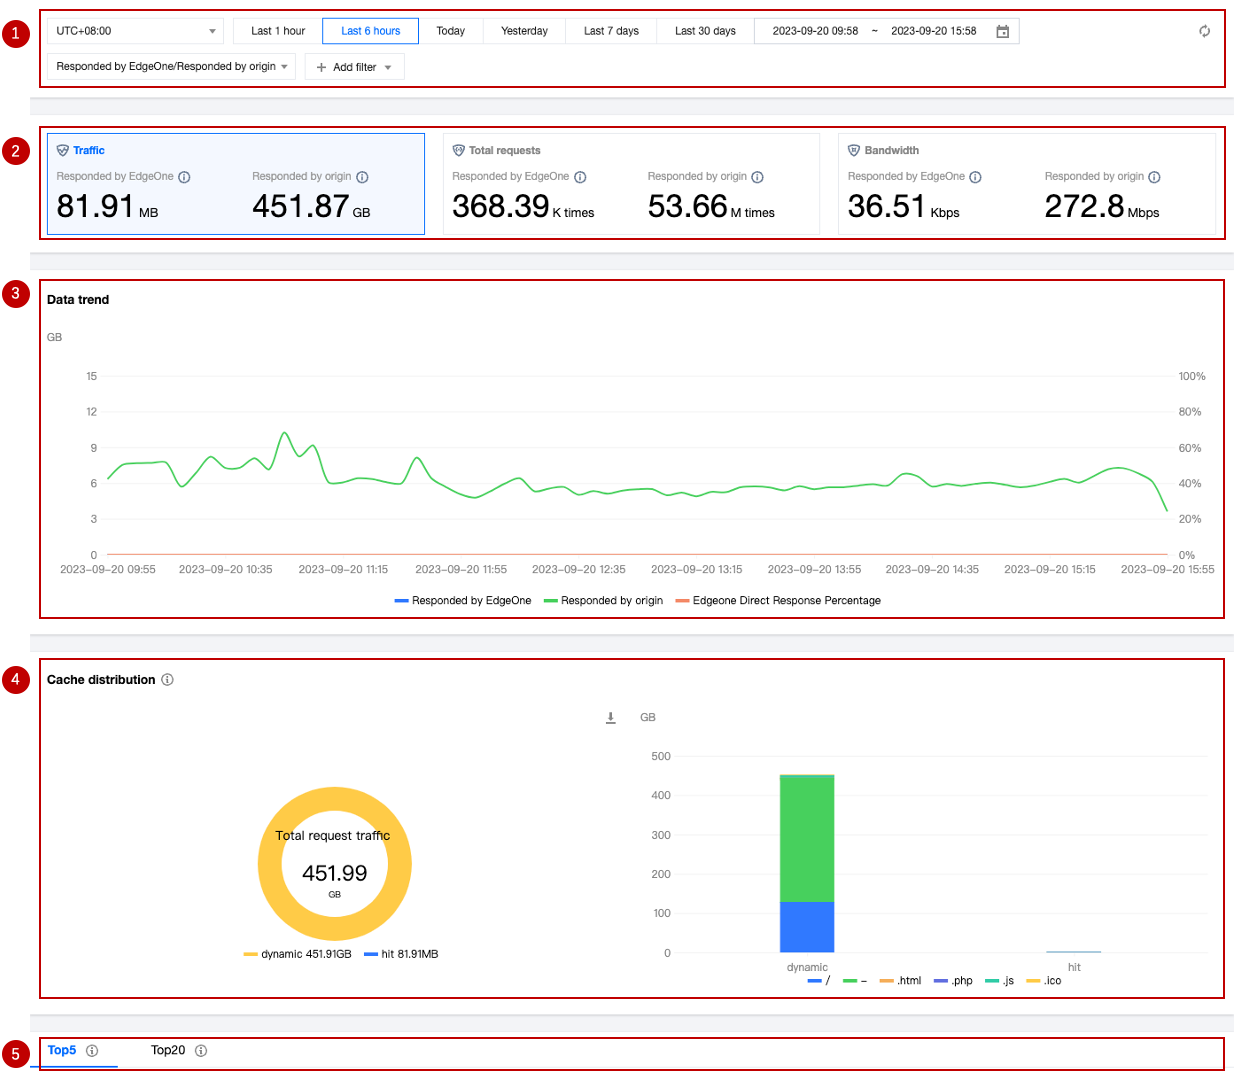
Cache analysis supports data statistics for traffic, requests, and bandwidth. You can switch between different core metrics by clicking on the data area at the top.
1. Data Filtering and Selection
Select the time range for data query. For details, please refer to Modify Query Time.
Supports filtering by site, Host, cache status, status code, and other dimensions. For details, please refer to How to Use Filters.
Supports switching the core metrics displayed on the page.
Responded by EdgeOne: Displays the traffic/requests/bandwidth peak directly responded by EdgeOne node cache.
Responded by origin: Displays the traffic/requests/bandwidth peak responded by the origin.
2. Core Metrics
Traffic: All traffic transmitted from EdgeOne to the client, i.e., downstream traffic.
Responded by EdgeOne: Traffic directly responded by EdgeOne node cache.
Responded by origin: Traffic responded by the origin.
Total requests: Requests received by EdgeOne from the client.
Responded by EdgeOne: Requests directly responded by EdgeOne node cache.
Responded by origin: Requests responded by the origin.
Bandwidth: The peak of all bandwidth transmitted from EdgeOne to the client, i.e., downstream bandwidth peak.
Responded by EdgeOne: Bandwidth peak directly responded by EdgeOne node cache.
Responded by origin: Bandwidth peak responded by the origin.
Note:
The calculation method of the bandwidth peak metric varies depending on the time granularity.
1-minute granularity: Total traffic within 1 minute * 8 / 60 seconds.
5-minute granularity: Total traffic within 5 minutes * 8 / 300 seconds.
Hourly basis: The maximum value among all 5-minute granularity bandwidth peak points.
Daily basis: The maximum value among all 5-minute granularity bandwidth peak points.
3. Data trend
Displays the time trend of the absolute values of the core metrics directly responded by EdgeOne and Origin response, as well as the time trend of the EdgeOne direct response proportion (i.e., cache hit rate) under the current core metric.
4. Cache Distribution
Cache status distribution, values include:
hit:The request hits EdgeOne's cache, and the resource is directly responded by EdgeOne.
miss:The resource can be cached, but it does not hit EdgeOne's cache, and the resource is responded by the origin.
dynamic:The resource is not eligible for caching, and the resource is responded by the origin.
other:Unable to Identify Cache state.
Cross-analysis of cache status and resource type: Displays the resource type distribution in each cache status category through bar charts.
Note:
When the core metric is "bandwidth," cache distribution is not supported.
5. TOP Ranking
The dimensions supported by cache analysis TOP ranking are as follows:
Resource Type: The resource type requested by the client, such as ".png" and ".json."
Hosts: The subdomains requested by the client.
URLs: The specific resource paths requested by the client.
Status Code: The status code responded by EdgeOne node to the client.
Note:
1. Due to the delay and algorithm's influence, TOP ranking data is for reference only. It is suggested to rely on actual log analytics results.
2. When the core metric is "bandwidth," TOP ranking is not supported.
Analysis Example
Scenario 1: Monitor the cache hit rate of the domain
Continuously monitor the cache hit rate of the specified domain through the trend chart in cache analysis, combined with different filter items.
Scenario Example
After you Add Acceleration Domain Name and Configure Cache Policy, you want to monitor the cache hit rate of the domain www.example.com to evaluate and optimize the cache configuration. You can perform the following operations in the Data Analysis > Cache Analysis page.
Directions
1. Log in to the EdgeOne console, click on the site list in the left menu bar, click on the site you are interested in within the site list, and enter the site details page.
2. In the site details page, click on Data Analysis > Cache Analysis to enter the cache analysis page.
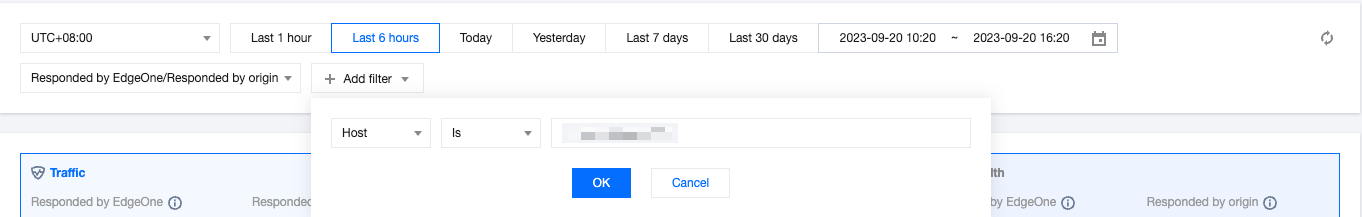
3. In the Cache analysis page, click on Add Filter, add the filter condition Host=www.example.com, and click OK.
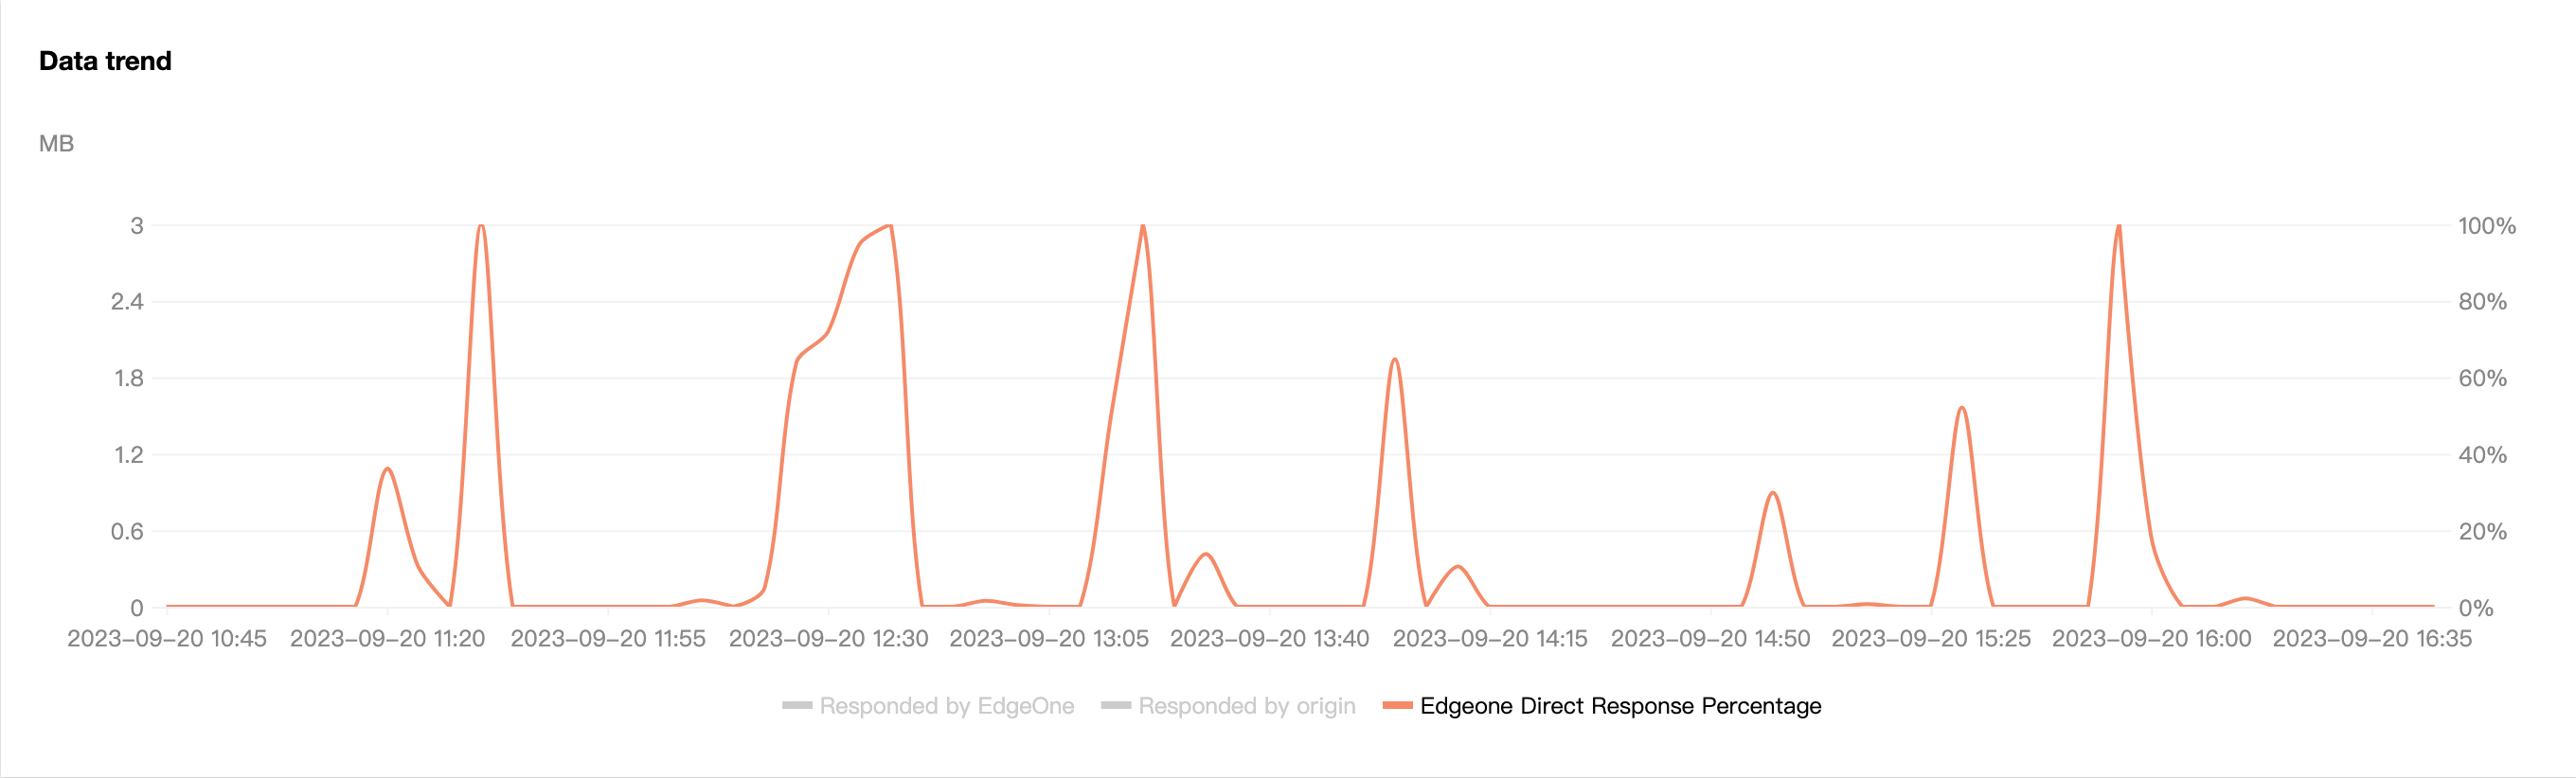
4. In the Time Trend Chart, view the Responded by EdgeOne curve trend, which represents the cache hit rate trend of www.example.com.
5. If you think the cache hit rate is low, you can add the filter condition Cache Status=miss, and then view the TOP Ranking to troubleshoot the reasons for the cache hit rate not meeting expectations.
For example, observe the TOP Ranking of resource types and find that a large number of ".mp4" file extensions have not hit the cache. You can refer to Node Cache TTL Configuration to optimize the corresponding configuration.
Scenario 2: Monitor the cache hit rate of all sites
Scenario Example
When all your sites are static websites and have been running stably on EdgeOne for a while, you need to monitor the cache hit rate of static resources for all sites. You can follow the steps below.
Directions
1. Log in to the EdgeOne console, click on Data Analysis > Cache Analysis in the left menu bar, and enter the cache analysis page for multiple site aggregation.
2. View the trend curve to see the aggregated data of all sites directly responded by EdgeOne.
3. In the filter, you can further select the corresponding site to view the proportion of resources directly responded by EdgeOne for the specified site.

 Yes
Yes
 No
No
Was this page helpful?