Alarm Configuration
Download
Focus Mode
Font Size
Overview
Alarm configuration is an active monitoring capability provided by the CFW Log Analysis module. It supports users in customizing alarm policies based on log data to continuously or periodically monitor security events and abnormal traffic. When trigger conditions are met, the system automatically sends alarm notifications, helping users promptly detect and respond to potential security threats.
Scenario
This document describes how to configure and manage alarm policies in the CFW console and how to view historical alarm records. It applies to the following scenarios:
Specific types of security events (such as Intrusion Defense alarms and abnormal external connections) require real-time monitoring and alarm notification.
Threshold alarms need to be configured based on log data. For example, an alarm is triggered when a specific type of event exceeds a defined number within a unit of time.
You need to view and manage historical alarm records to perform retrospective analysis of security events.
Prerequisite
You have purchased the CFW Premium Edition or a higher edition. For details, see Billing Overview.
The Log Analysis feature is enabled. If you need to enable it, purchase it on the Log Analysis page in the CFW console.
To receive alarm notifications, you must create a notification template in Observability Platform in advance. For details, see Creating Notification Template.
Use Limits
Item | Limit | Description |
Maximum Number of Alarm Policies | 100 alerts per user | A single user can create up to 100 alarm policies. |
Operation Steps
Step 1: Go to the Alarm Configuration Page
1. Log in to the CFW console. In the left sidebar, click Log Analysis.
2. On the Log Analysis page, click Alarm Configuration to go to the Alarm Configuration page.

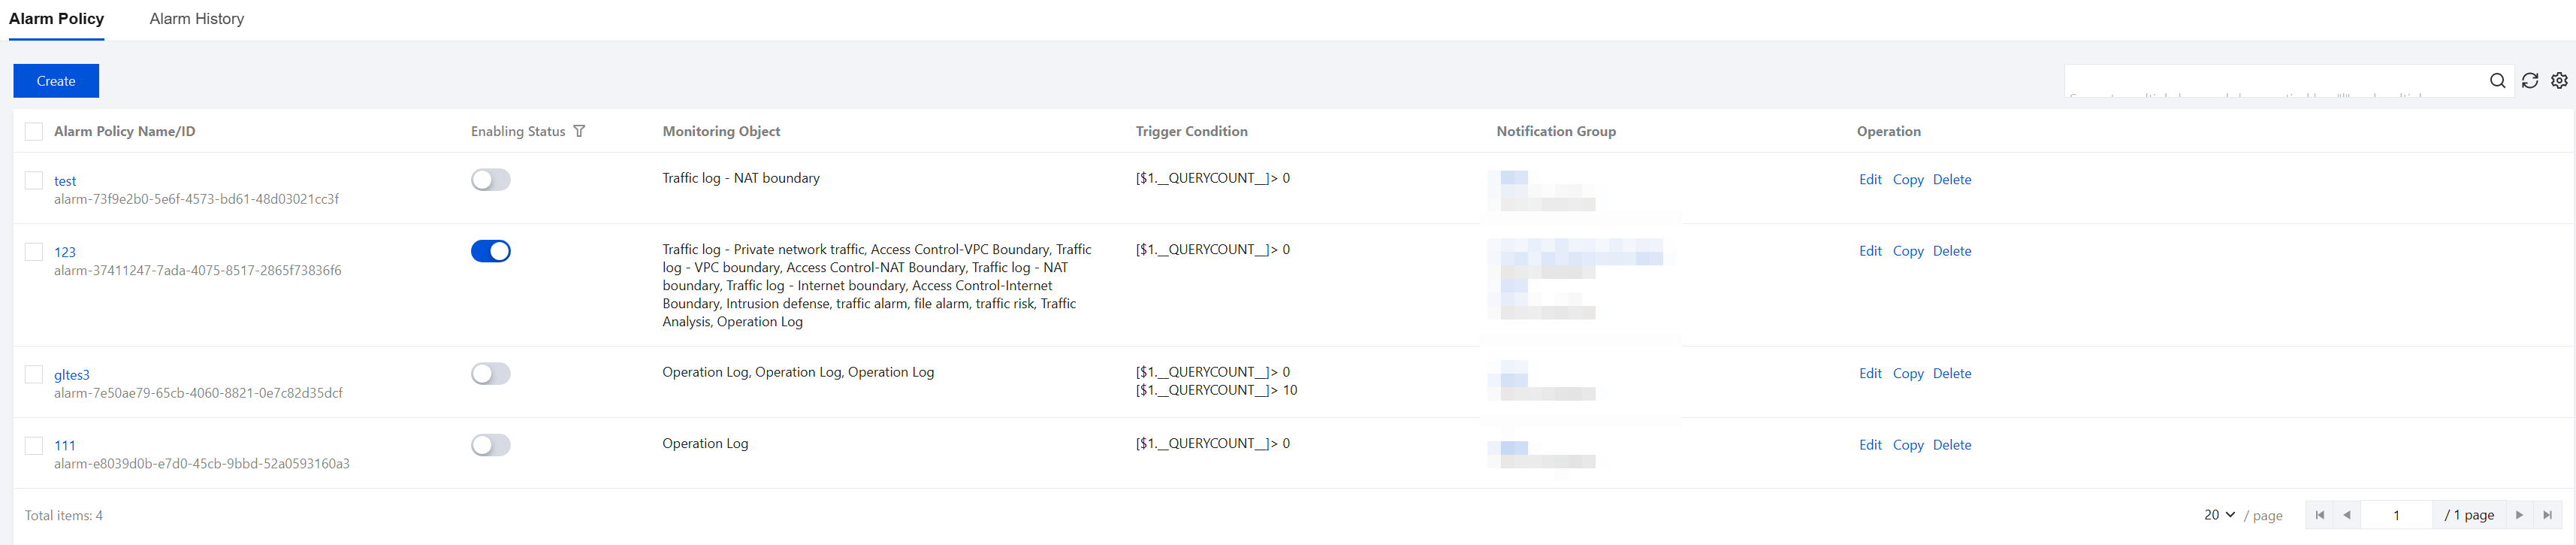
3. The Alarm Configuration page contains two tabs:
Alarm Policy: Manage the creation, editing, enabling/disabling, and deletion of alarm policies.
Alarm History: View historical alarm records and alarm details.
Step 2: Create an Alarm Policy
1. On the Alarm Policies page, click Create.
2. Query Statement
3. After the alarm policy is configured, click OK to complete the creation of the alarm policy.
4. After the alarm policy is created, monitoring is automatically executed according to the configured execution cycle. You can view and manage created policies in the alarm policy list.
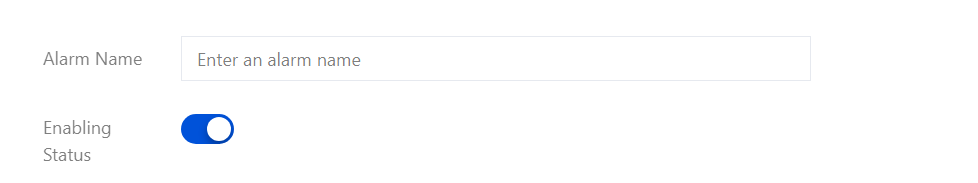
Alarm Name and Status
Configuration Item | Description |
Alarm name | Enter the name of the alarm policy to identify the policy in the alarm policy list and alarm notifications. |
Enabling Status | Controls whether the alarm policy takes effect. After the policy is enabled, it automatically runs according to the execution cycle. After the policy is disabled, its execution is paused. |
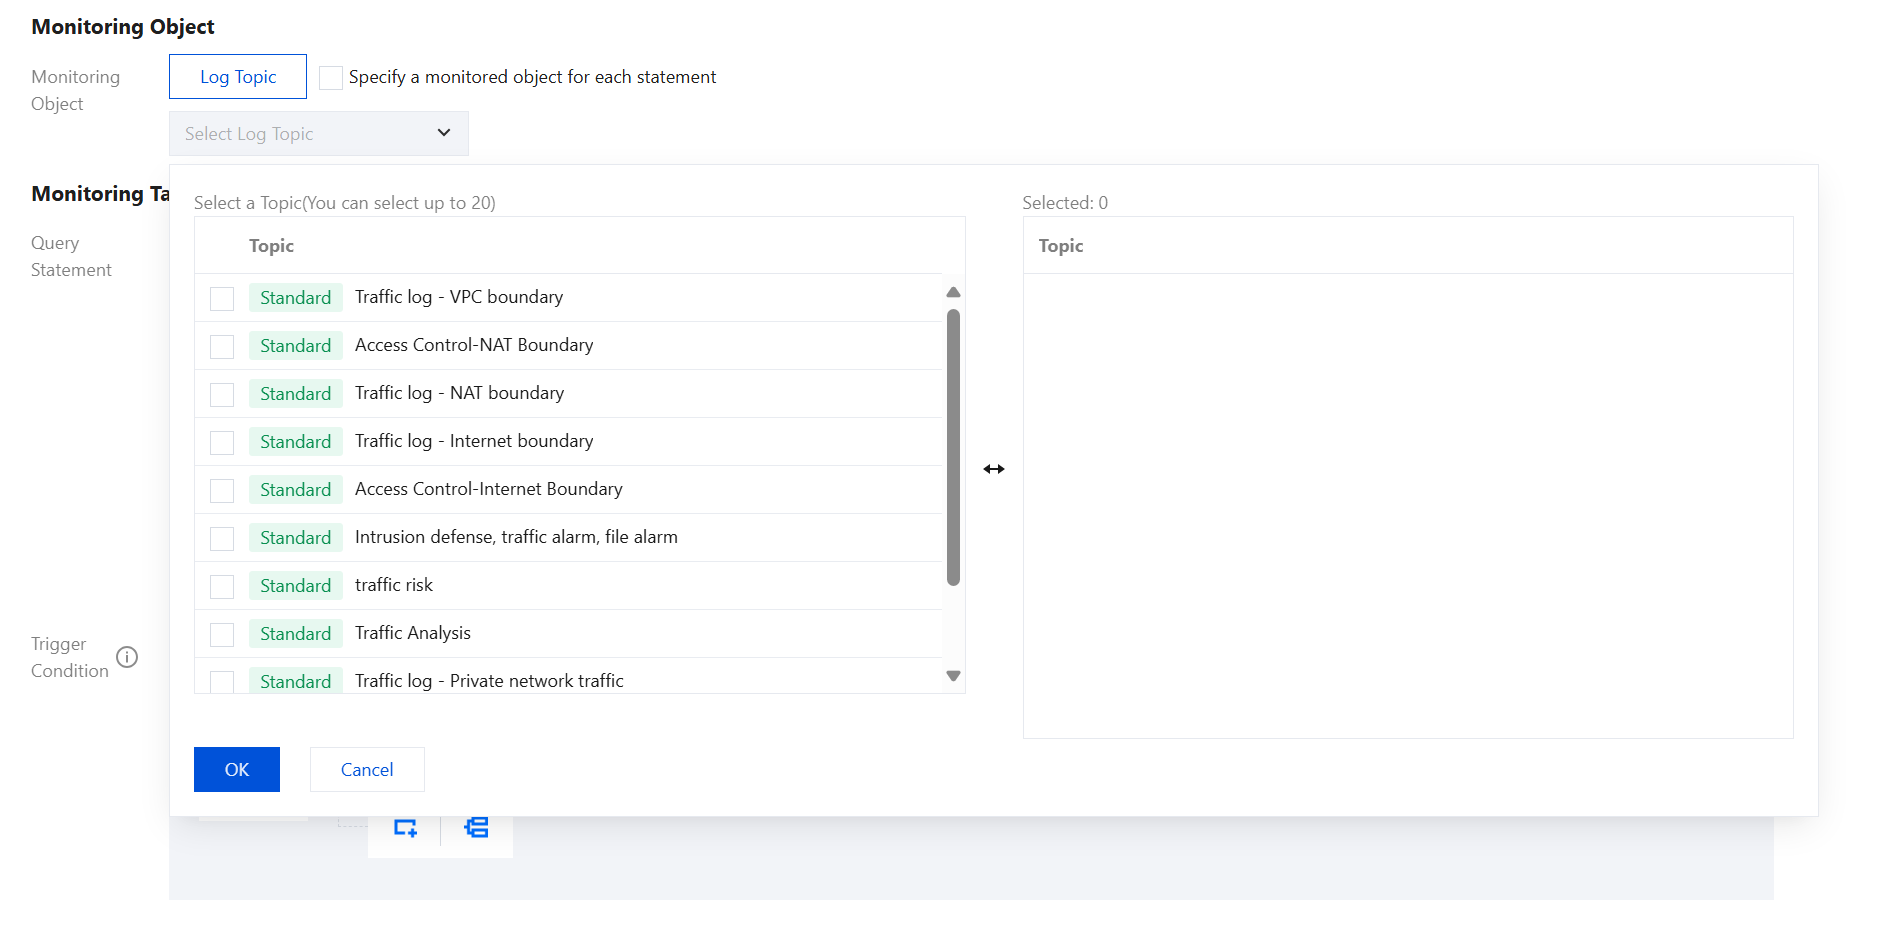
Monitored object
The monitoring object is used to specify the log source monitored by the alarm policy. Click Log Topic and select the log topic to be monitored from the drop-down list.
Note:
The log topic list is dynamically displayed based on the CFW features you have activated. For example, NDR traffic logs are visible only when the NDR feature has been purchased.
Alternatively, you can select the monitoring object individually in each execution statement instead of selecting a log topic uniformly here.
Monitoring Task
Execution statement
A monitoring task defines the execution statement for an alarm policy, which is used to extract monitoring data from logs.
Configuration Item | Description |
Query Statement | Enter a statement for searching and analyzing log data. Its syntax must be consistent with the CLS search condition syntax. Example: level:error | select count(*) as errCount (counting the number of error-level logs) |
Query Time Range | Select a query time window for the execution statement, such as the last 15 minutes or the last 1 hour. Each time it is executed, the system runs the execution statement on the log data within this time range. |
Preview | After configuring the execution statement, you can preview the query results of the raw logs in this area to verify whether the statement is correct. |
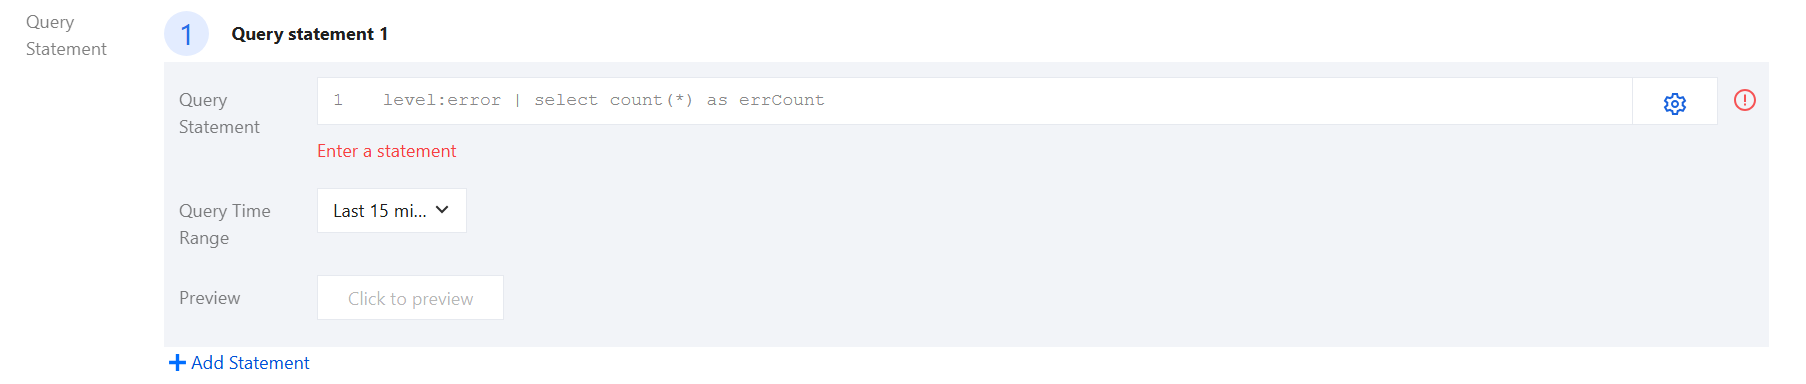
Click + Add Statement to add multiple execution statements. Each statement can independently select the log topic to be monitored and the query time range.
The results of multiple execution statements can be combined in trigger conditions.
Trigger Condition
Trigger conditions are used to determine whether the execution result of a monitoring task needs to generate an alarm. They support two configuration modes:
Interaction Mode: Configure trigger conditions through the visual interface. Each trigger condition contains the following configuration items:
Configuration Item | Description |
Alarm severity | Select the alarm severity when this condition is triggered. Options: Critical, Warning, Info. |
Query Statement | Select the associated execution statement (such as Execution Statement 1). |
Evaluation Metric | Select the evaluation criterion, for example, "Number of Results". |
Comparison Operator | Select the comparison operator, for example, "Greater Than", "Less Than", "Equal To". |
Threshold | Threshold for triggering an alarm. |
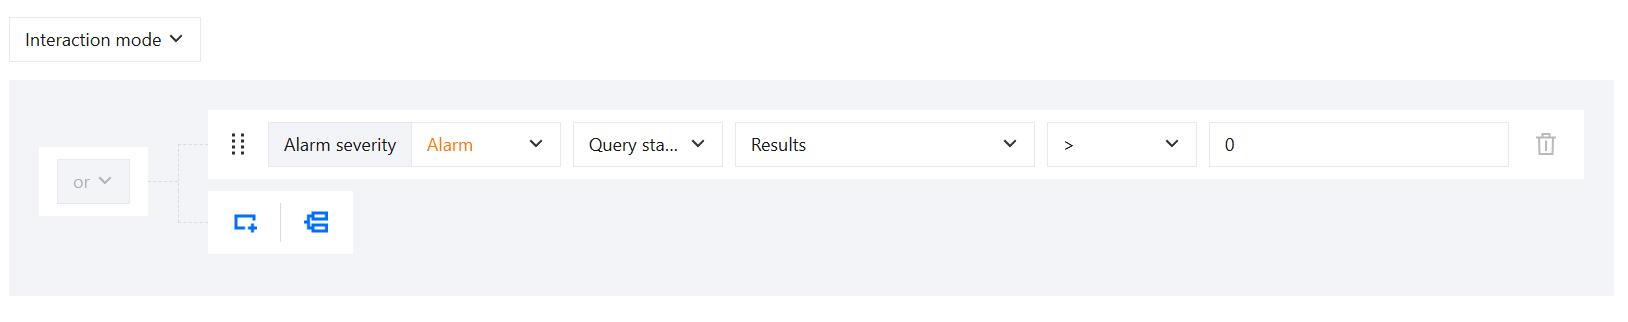
Click Add condition or Add group to add multiple trigger conditions. An alarm is triggered when any condition is met.
Note:
Conditions within the same group have an AND relationship, while conditions between different groups have an OR relationship. Click Add Condition to add a condition within the current group. Click Add Group to create a new, independent condition group.
Statement Mode: Trigger conditions are written directly using conditional expressions, which is suitable for complex judgment logic.

Trigger by group
Trigger by group is disabled by default. After you enable it, you can group monitoring data by a specific field, and each group independently evaluates the trigger conditions. For example, after grouping by source IP address, you can achieve "triggering a separate alarm when the number of error logs for a specific source IP address exceeds the threshold".
Execution Cycle
Configure the execution frequency for the alarm policy. The following methods are supported:
Fixed frequency: The task is executed once every specified number of minutes, for example, "every 1 minute". The value range is 1-1440 minutes.
Fixed time: Set the specific daily execution time for the task. Format: HH:MM (for example, 02:14). Value range: 00:00-23:59.
Cron Expression: Customize the execution time using a Cron expression. This is suitable for scenarios that require execution at specific time points.
After you configure the monitoring task, click the Test Monitoring Task button to verify whether the execution statement and trigger conditions meet expectations.
Multi-Dimensional Analysis
Multidimensional analysis is used to attach auxiliary analysis information when an alarm is triggered, helping to quickly locate the root cause of the problem.
Analysis Type | Description |
Row logs | Obtain raw logs that meet the search criteria of the execution statement. For example, when an alarm is triggered due to excessive Error logs, view the corresponding detailed logs in the alarm. |
Top 5 field values by occurrence and their percentages | For all logs within the time range that triggered the alarm, group and count the log entries by specified fields to obtain the top 5 field values and their percentages. For example, obtain the Top5 URLs, Top5 response status codes, and so on. |
Custom search and analysis | For all logs within the time range that triggered the alarm, execute a custom search and analysis statement. For example: obtain the request duration of each interface by using * | select avg(timeCost) as time, URL group by URL, and obtain error logs by using status > 499. |
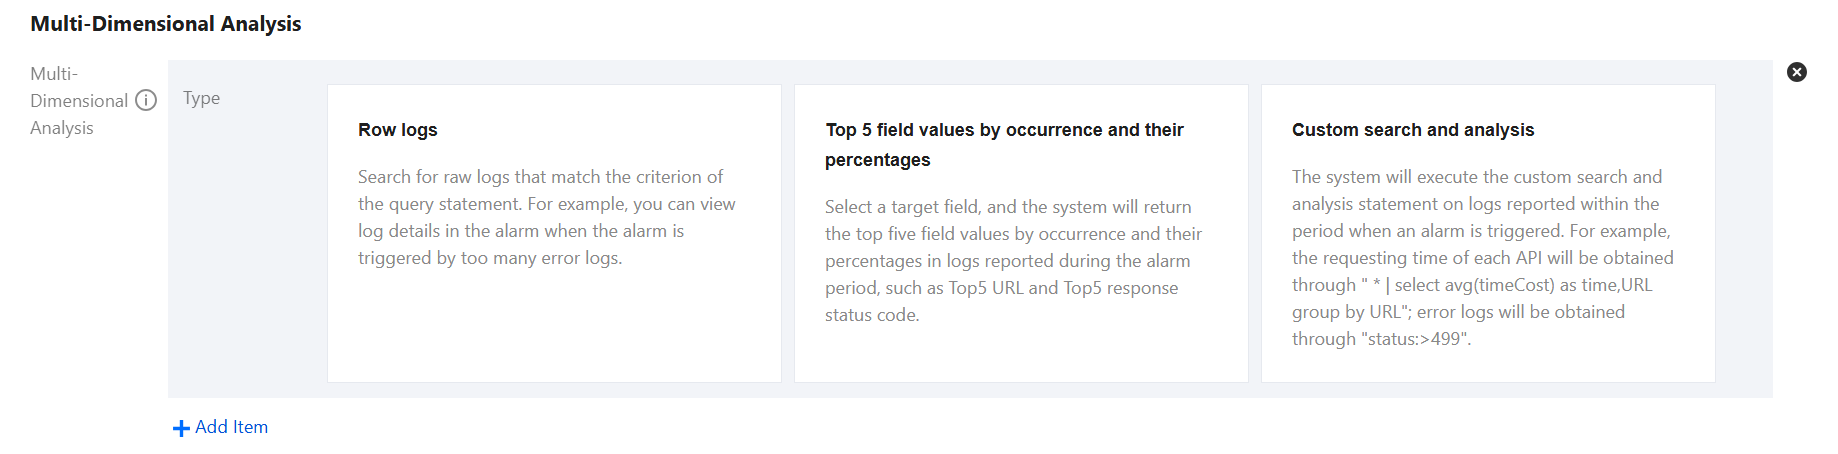
Click Effect Preview to view a sample effect.
Click + Add Item to add multiple multidimensional analyses.
Alarm Notification
Alarm notifications are used to configure the notification policy after an alarm is triggered.
Configuration Item | Description |
Alarm Frequency | Set the sending frequency for alarm notifications. The format is "If the trigger condition is met for N consecutive monitoring cycles, an alarm is sent every M minutes." |
Notification Method | Select the TCOP notification template to manage the recipients and delivery methods for alarm notifications through TCOP. |
Notification Templates | Click Add Notification Template to select an existing notification template or create a new one from the observability platform. Each alarm policy can select up to 5 notification templates. A notification template defines the alarm level, notification channels (email, SMS, and so on), and recipients. |
Extra category field | (Optional) Click + Add category field to attach custom classification Tags to alarm notifications, facilitating the classification management of alarms. |
Additional notification content | (Optional) Customize the additional content information in alarm notifications. The default value is {{ .Label}}, which means attaching the Tag information of the alarm. |
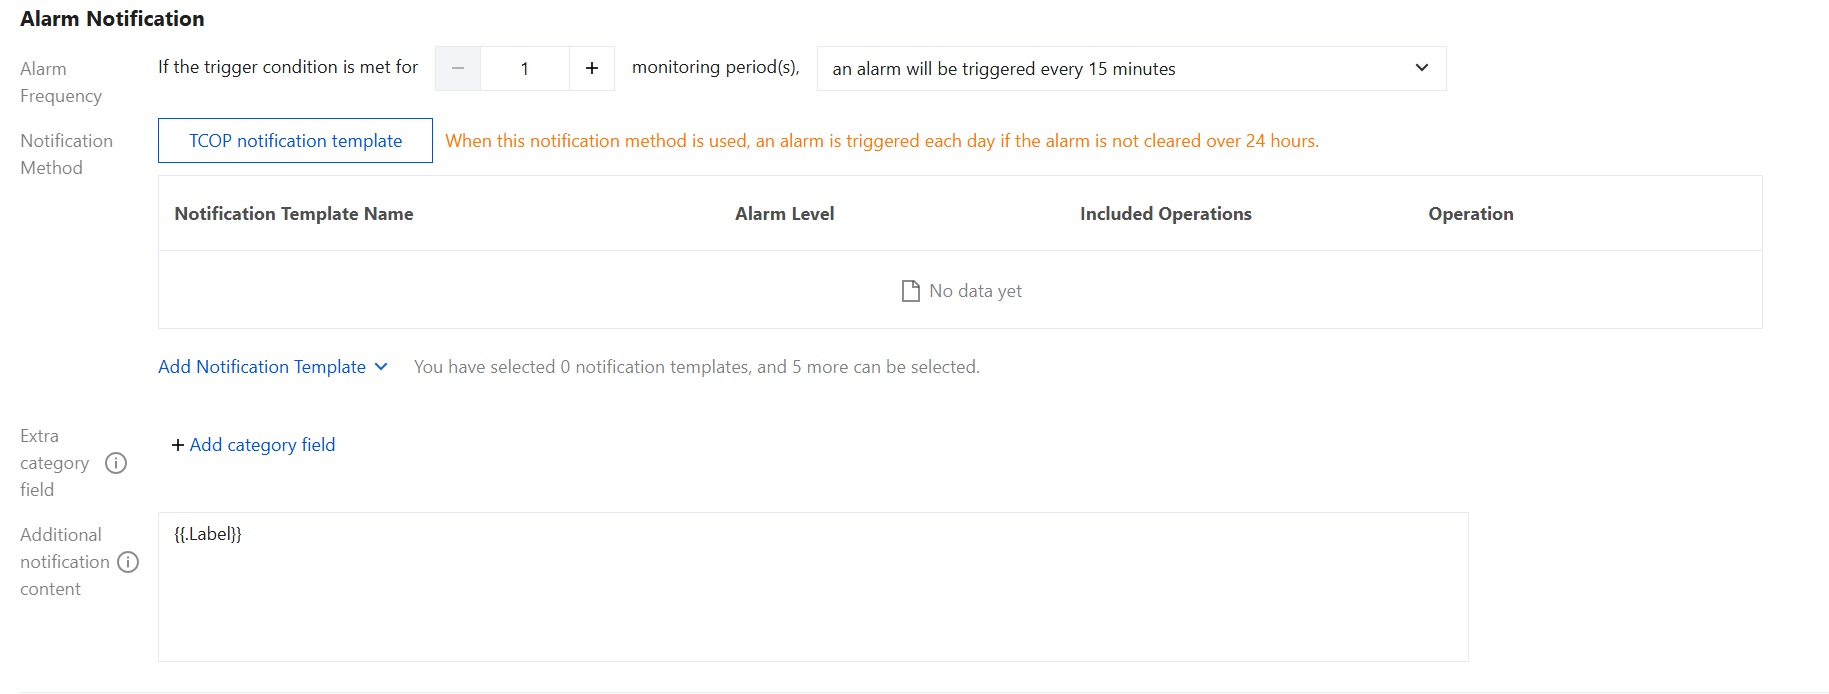
Note:
When a TCOP notification template is used, if an alarm remains unresolved for more than 24 hours, the system automatically reduces the notification frequency to once per day.
Step 3: Managing Alarm Policies
In the alarm policy list, you can perform the following management operations on created alarm policies:
Operation | Description |
Edit | Modify configurations such as the monitoring object, execution statement, trigger condition, and notification method for the alarm policy. |
Enable/Disable | Controls the running status of the alarm policy. After the policy is disabled, the policy execution is paused and no alarms are triggered. |
Copy | Quickly creates a new alarm policy based on an existing one. |
Delete | Deletes alarm policies that are no longer needed. Deleted policies cannot be recovered. Proceed with caution. |
Note:
After an alarm policy is disabled or deleted, monitoring and alarm notifications for that policy will no longer be executed. If the policy is used to monitor critical security events, confirm that other monitoring measures are in place before proceeding.
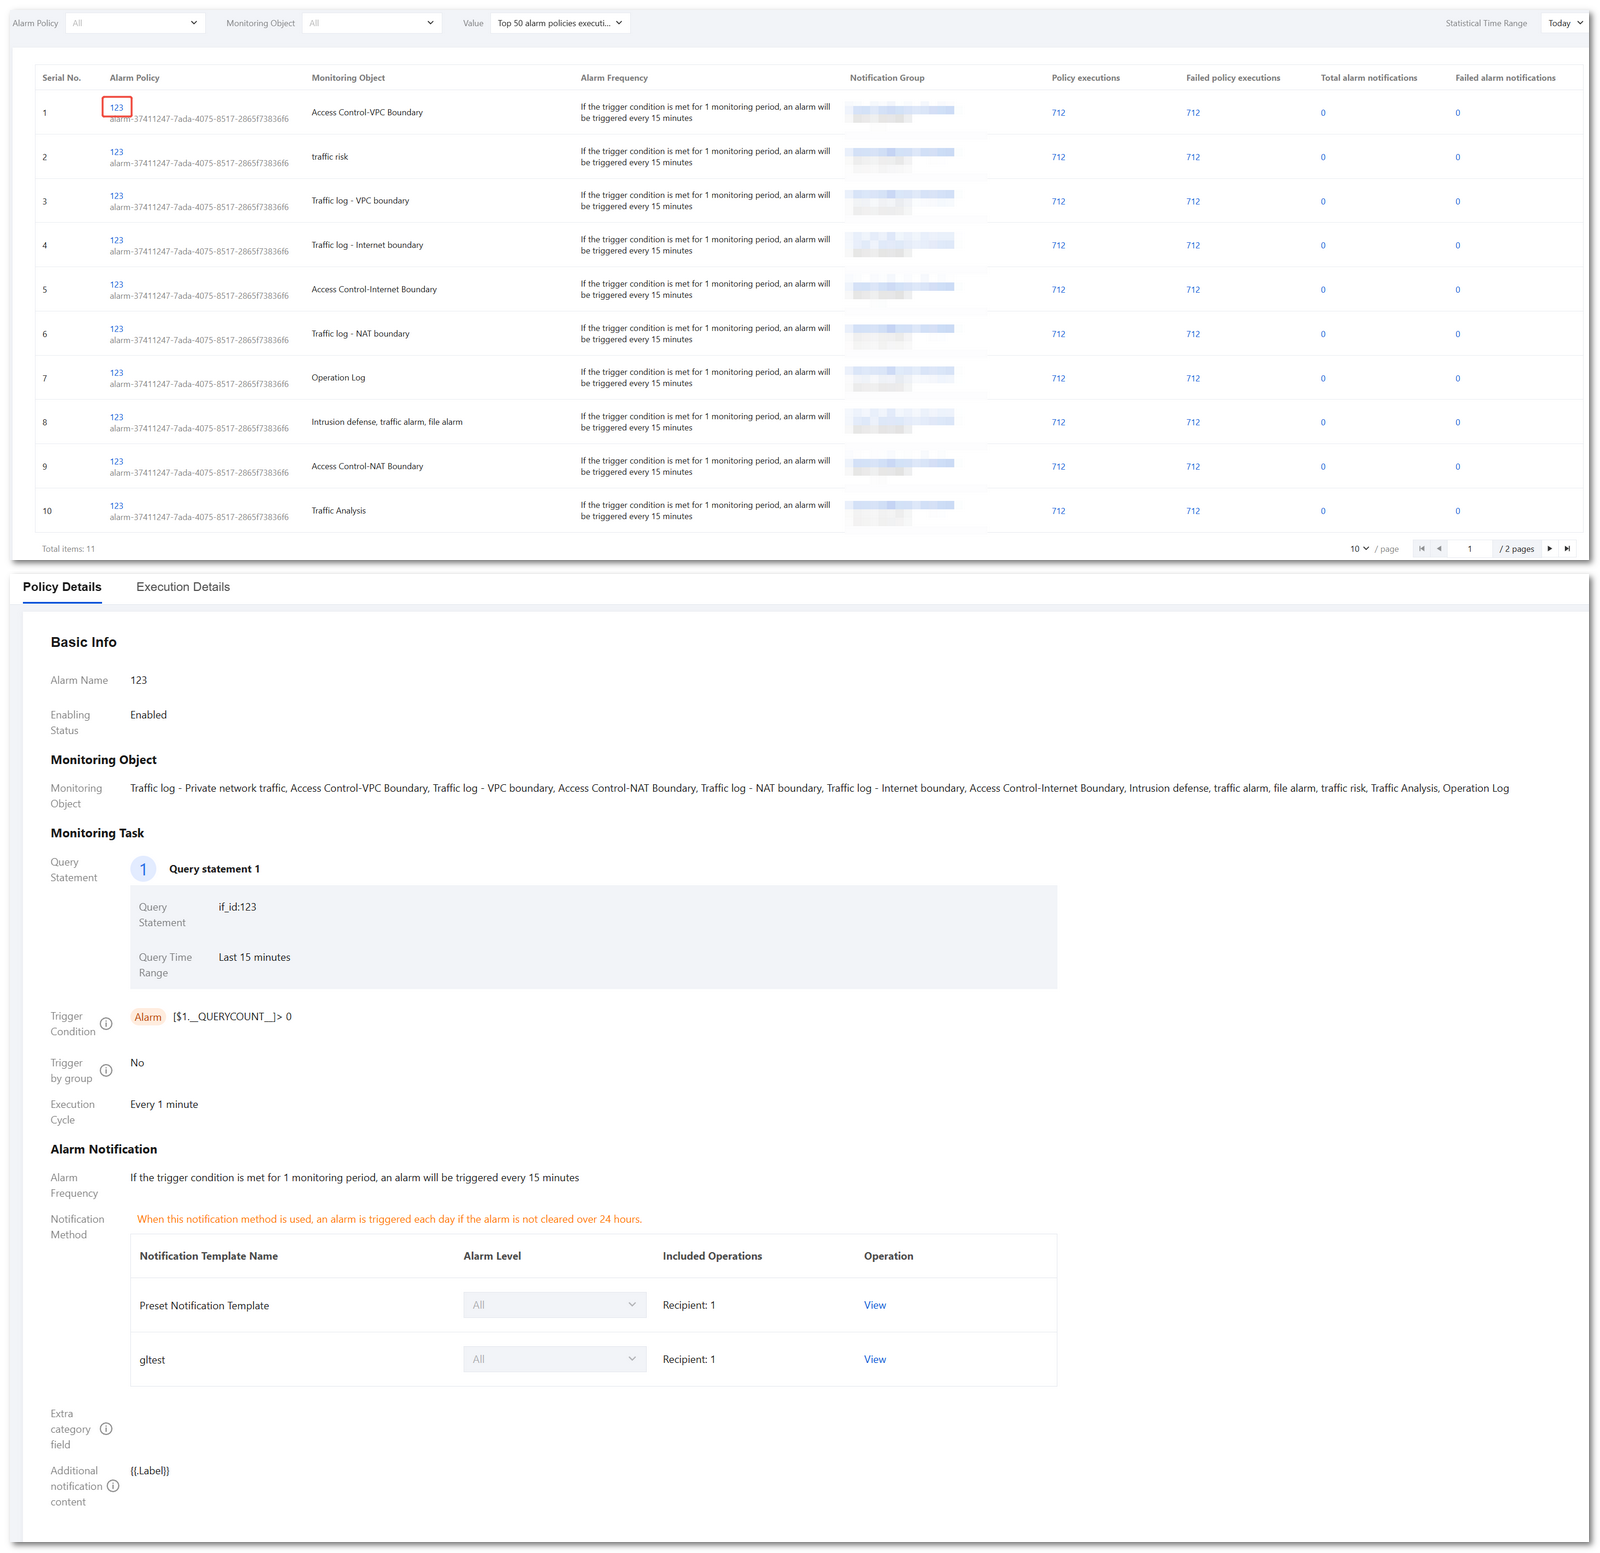
Step 4: Viewing Alarm History
1. On the Alarm Configuration page, click Alarm History.
2. The Alarm History page contains two tabs:
Alarm Records: View all triggered alarm records. Click View Details to view alarm policy details and execution details.
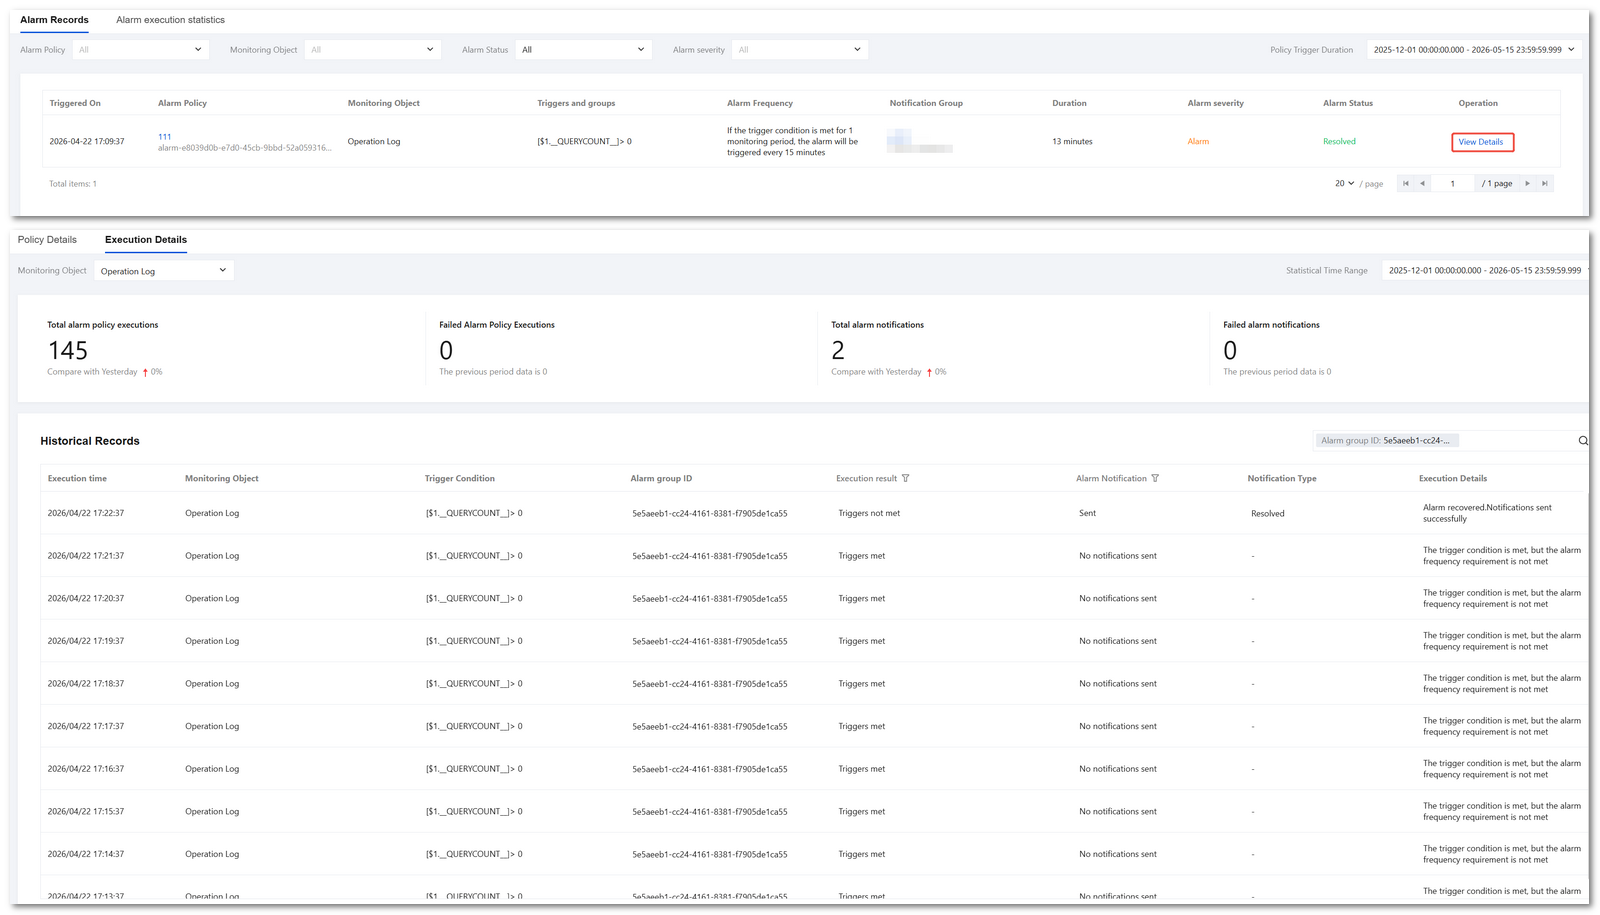
Alarm Execution Statistics: View alarm execution statistics by custom statistical methods. Click an alarm to view alarm policy details and execution details.
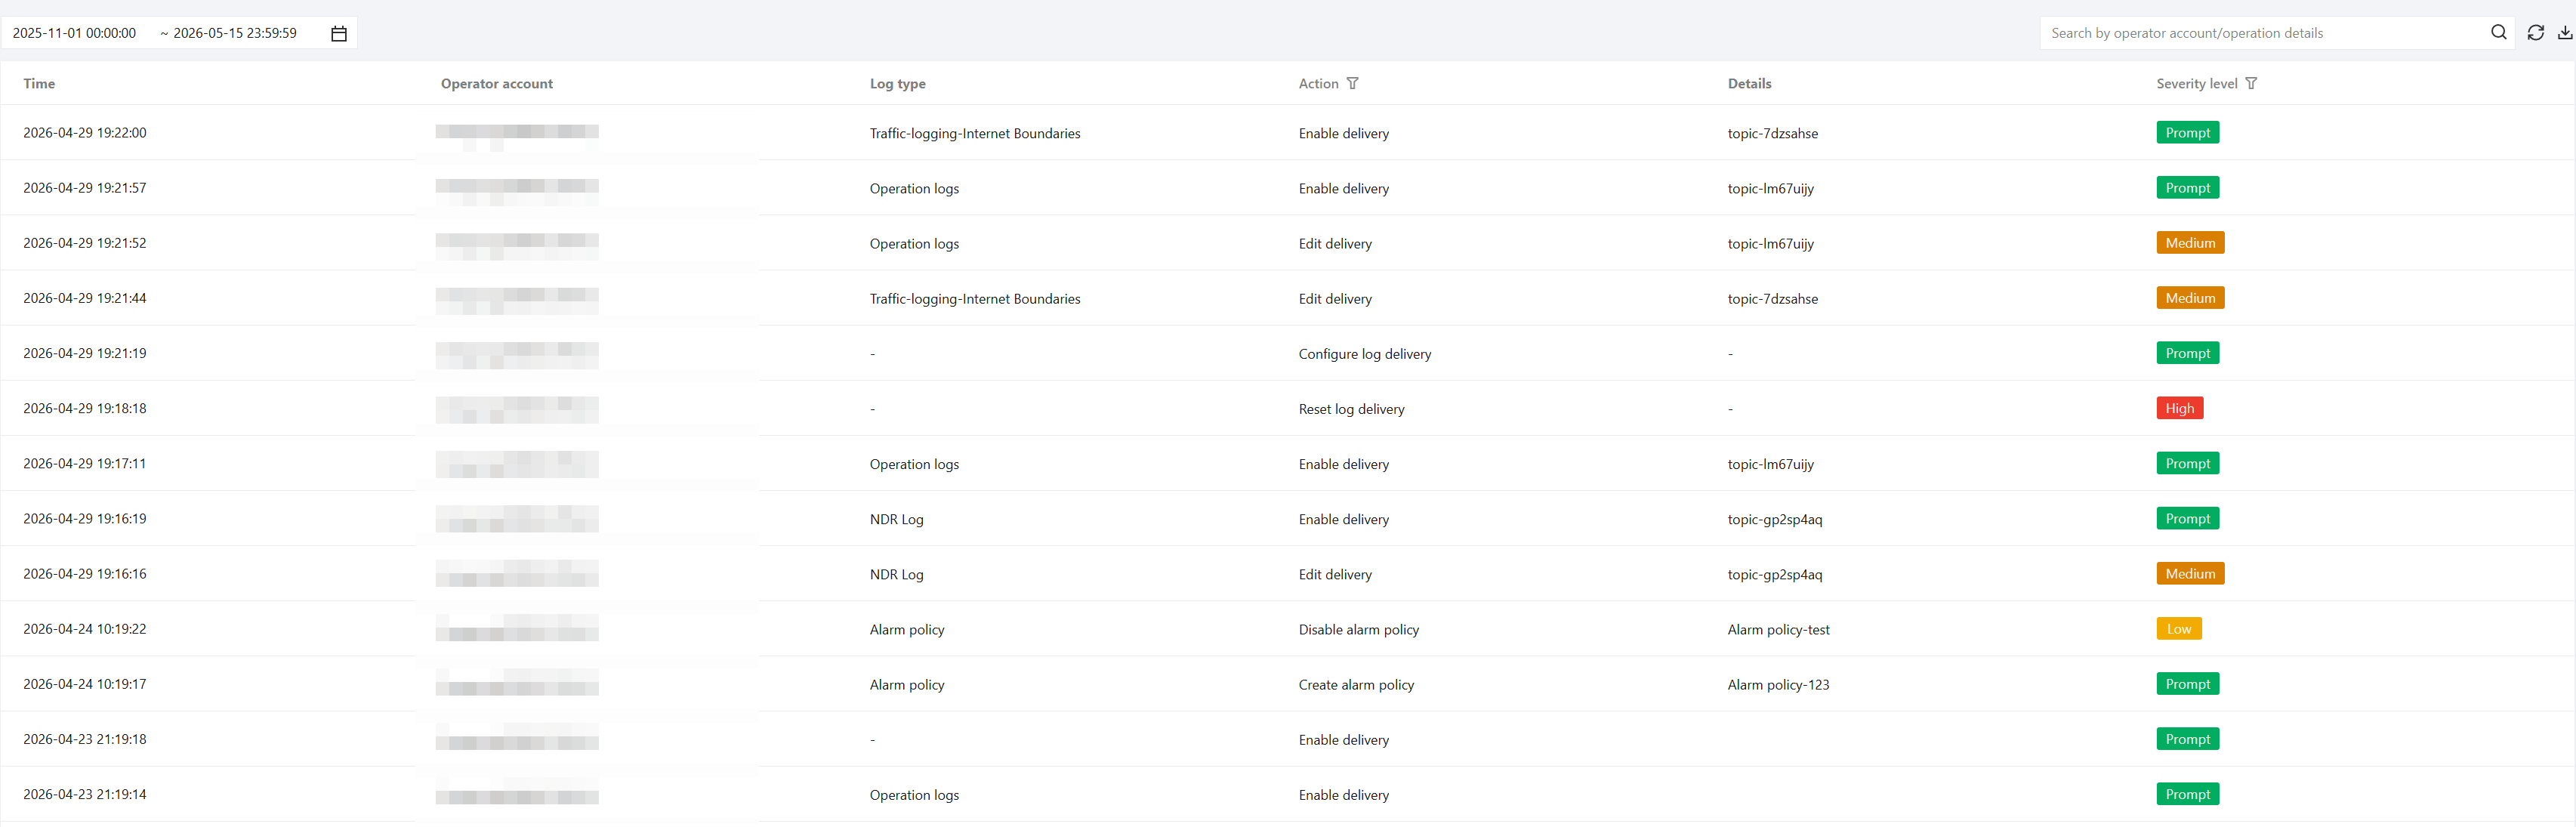
Operation Logs
Management operations performed by users on alarm policies are automatically recorded in the CFW operation logs. You can view the related records under the Log Auditing > Operation Log > Log Operation tab.
The recorded operation types include:
Operation | Danger Level | Description |
Create Alarm Policy | Prompt | Creating a new alarm policy |
Delete Alarm Policy | Prompt | Enabling a disabled alarm policy |
Edit Alarm Policy | Low | Modifying a alarm policy configuration |
Enable Alarm Policy | Low | Disabling a enabled alarm policy |
Deleting a alarm policy | Low | Deleting a alarm policy |
Note:
Note: Creating and enabling are positive operations that do not negatively impact existing alarm capabilities.
Low Risk: Existing alarm monitoring capabilities may be affected by editing, disabling, or deleting. Confirm the impact scope before you perform these operations.
Reference
For more information on Log Analysis, log shipping, and alarm capabilities, see the following documents:
Help and Support
Was this page helpful?
You can also Contact sales or Submit a Ticket for help.
Help us improve! Rate your documentation experience in 5 mins.
Feedback