1. Log in to the TCSS console and click Security Operations > Log Analysis on the left sidebar.
2. On the Log Analysis page, filter log analysis results and perform appropriate operations.
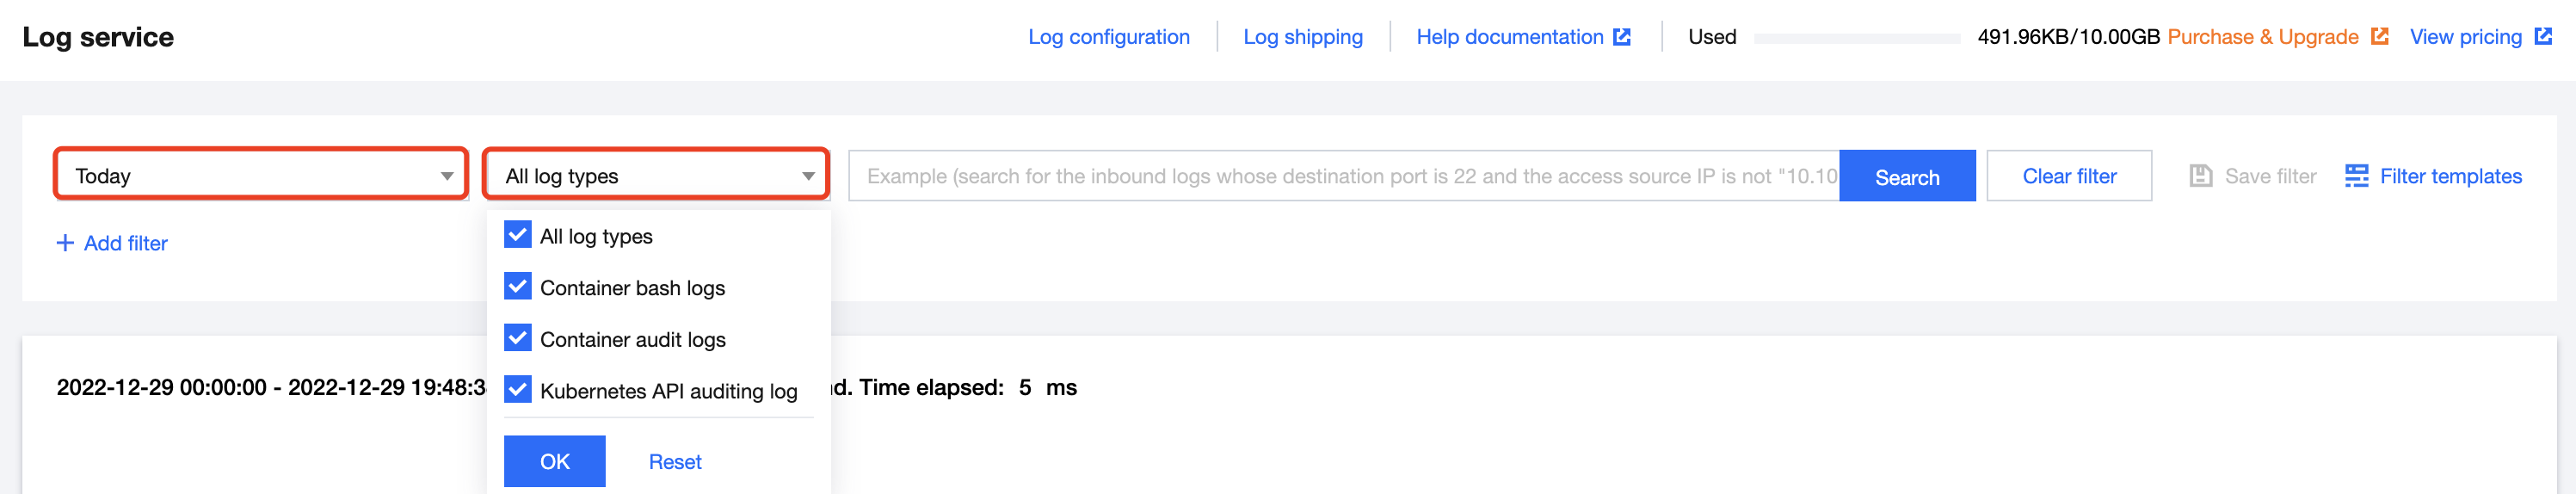
Filter logs by time or type: At the top of the Log Analysis page, filter log analysis results by time (last 15 minutes, last hour, last 12 hours, last 24 hours, today, last 7 days, last 14 days, last 30 days, last 90 days, or a custom period) or by log type and click OK.
Filter logs by record field: At the top of the Log Analysis page, filter logs by field, which can be entered manually or automatically.
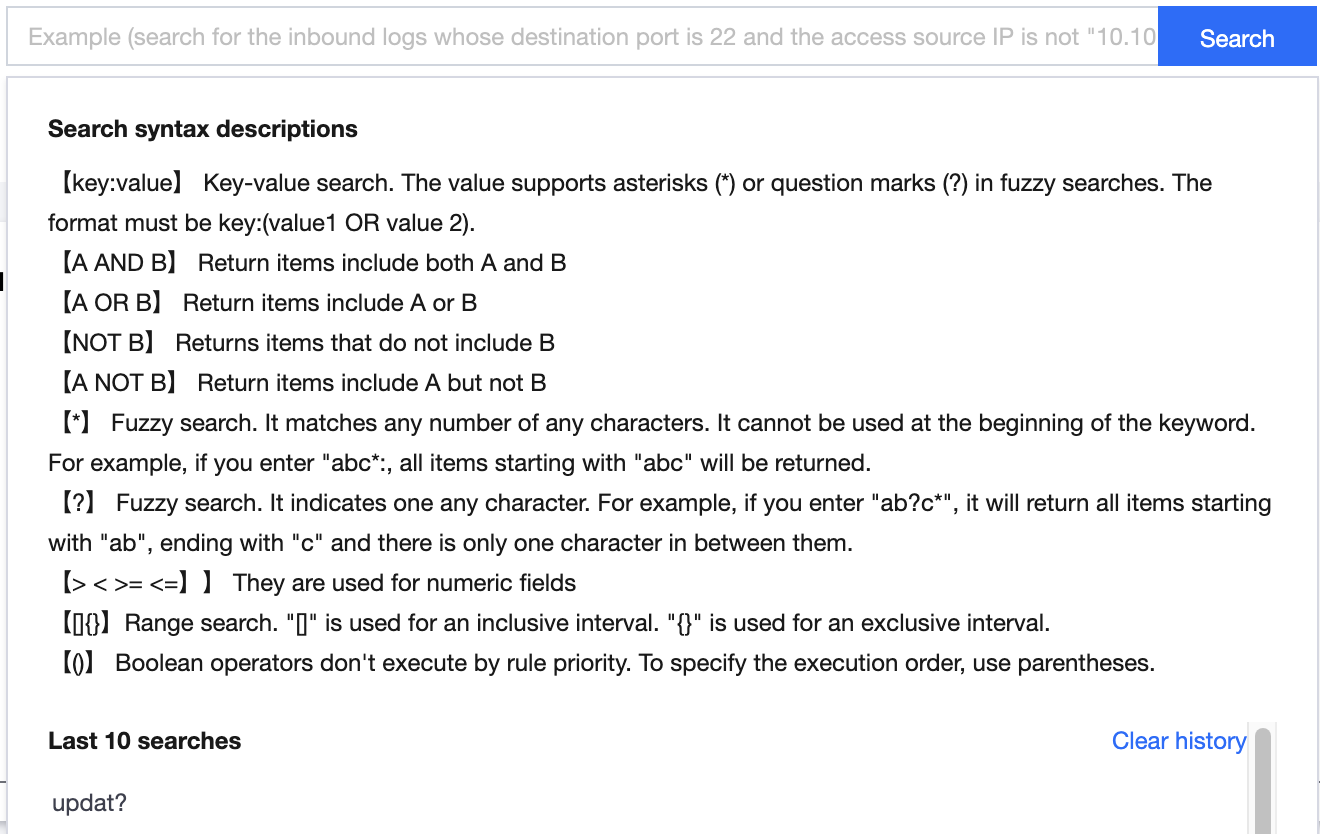
Manually enter the field: Enter the target field in the format of field name and field value and click Search. The search syntax description is as shown below.
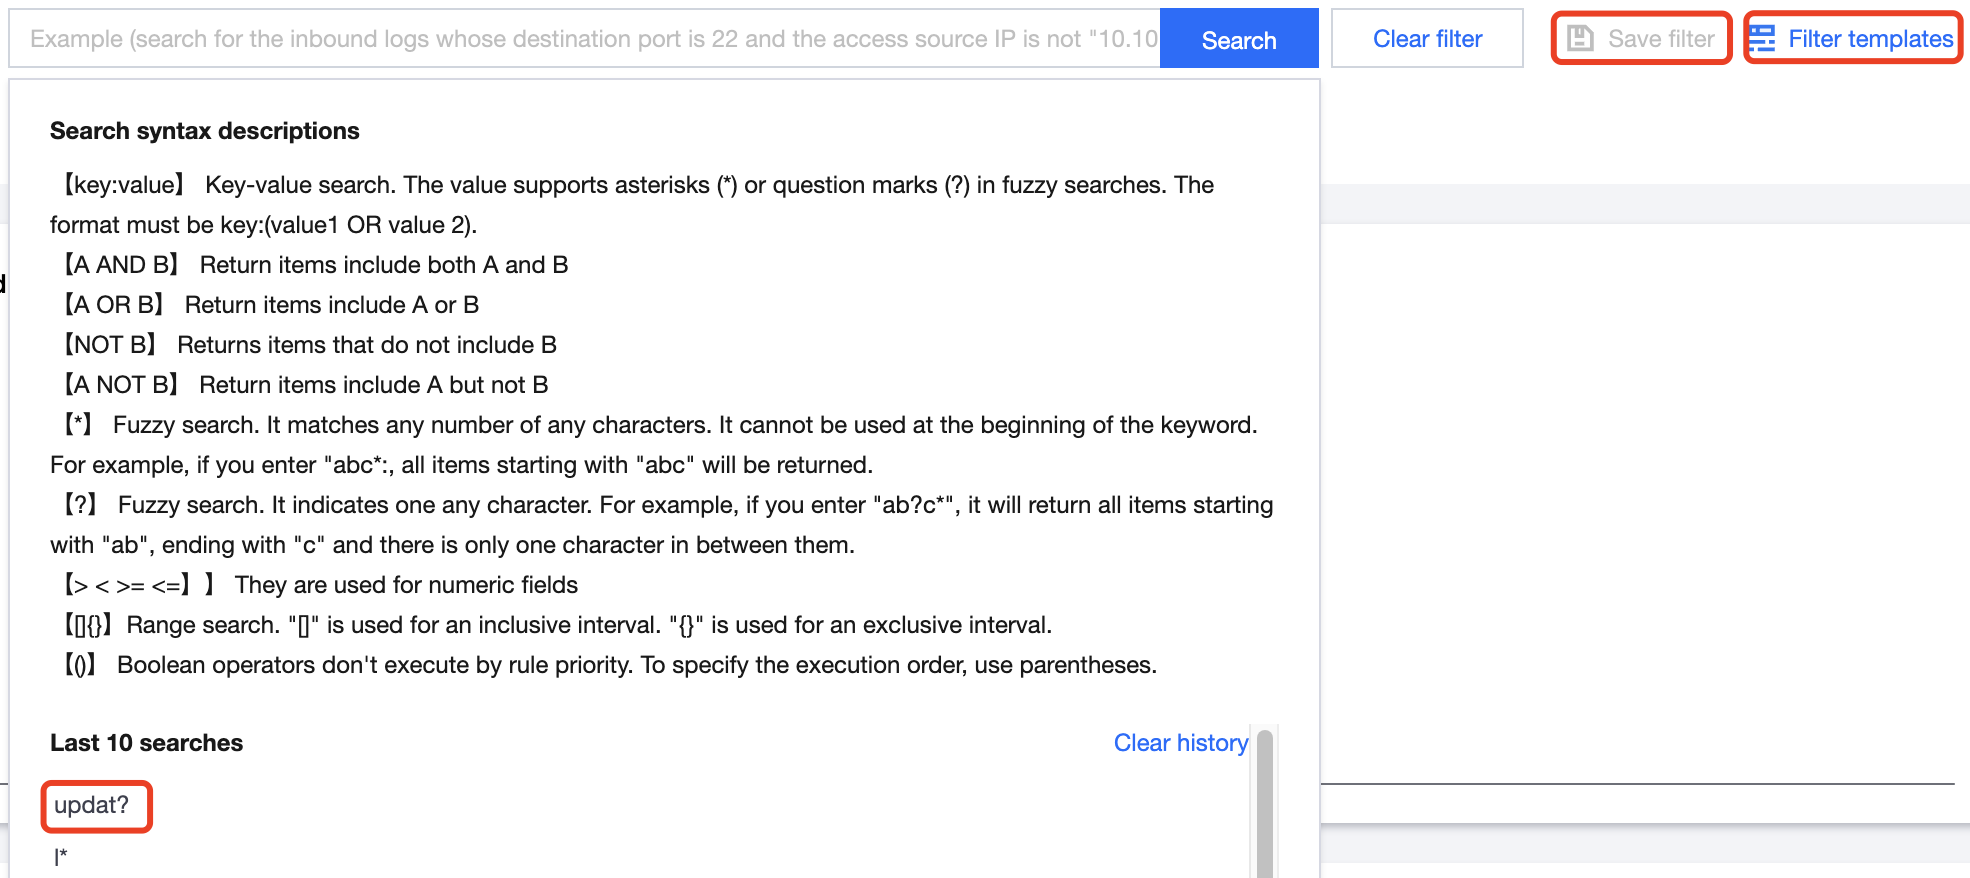
Automatically enter the field: Click Filter templates and select the target template name, or click the historical record in the input box as shown above. To reuse a query template, click Save filter when manually entering a query statement to save the current configuration (log type and keyword).
Quickly view the log trend chart:
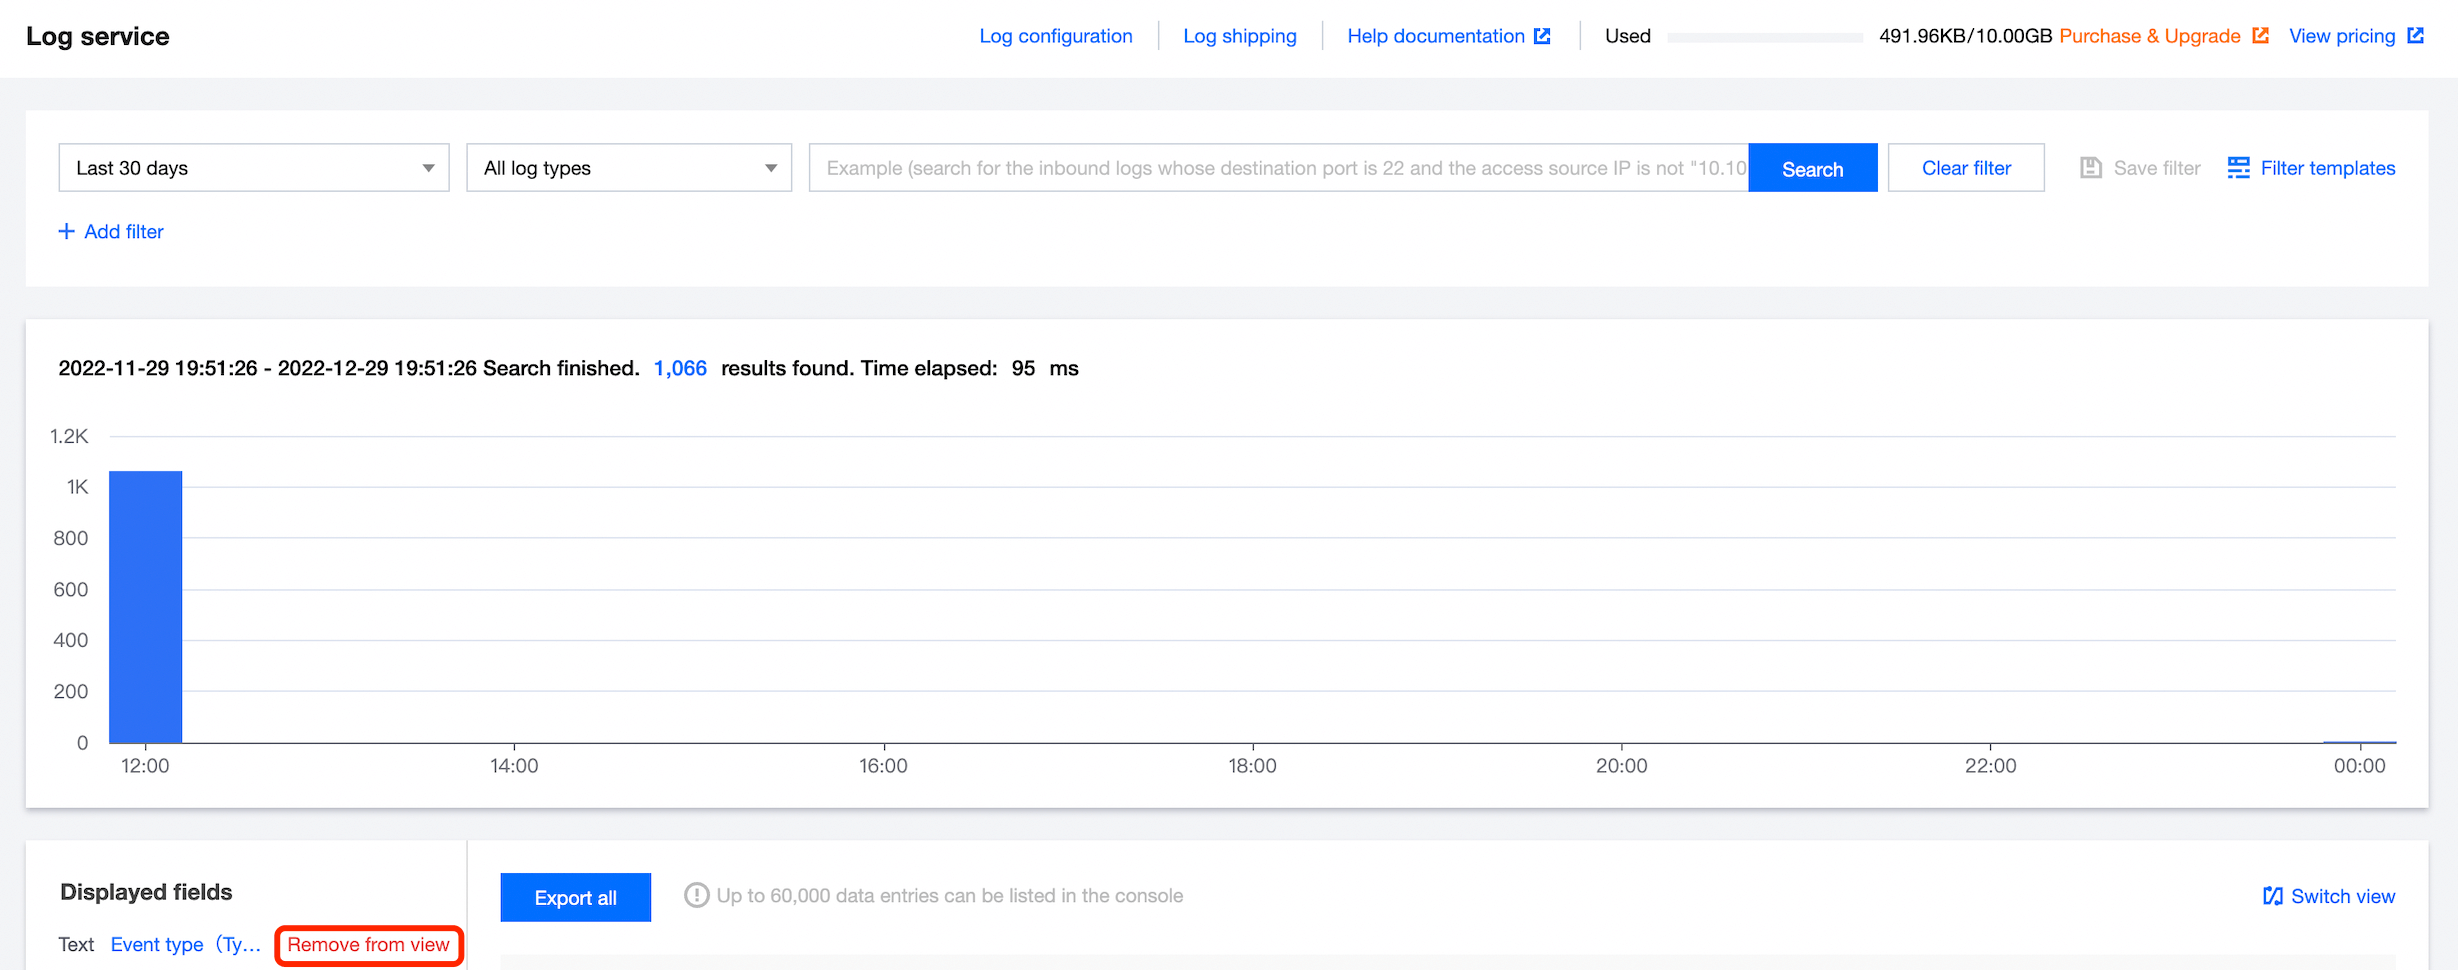
Method 1: To view logs within a specified period, scroll the mouse wheel to quickly view the blue bar chart above the log trend chart, which displays the statistical period and number of logs.
Method 2: Click the blue bar chart above the log trend chart to view more details.
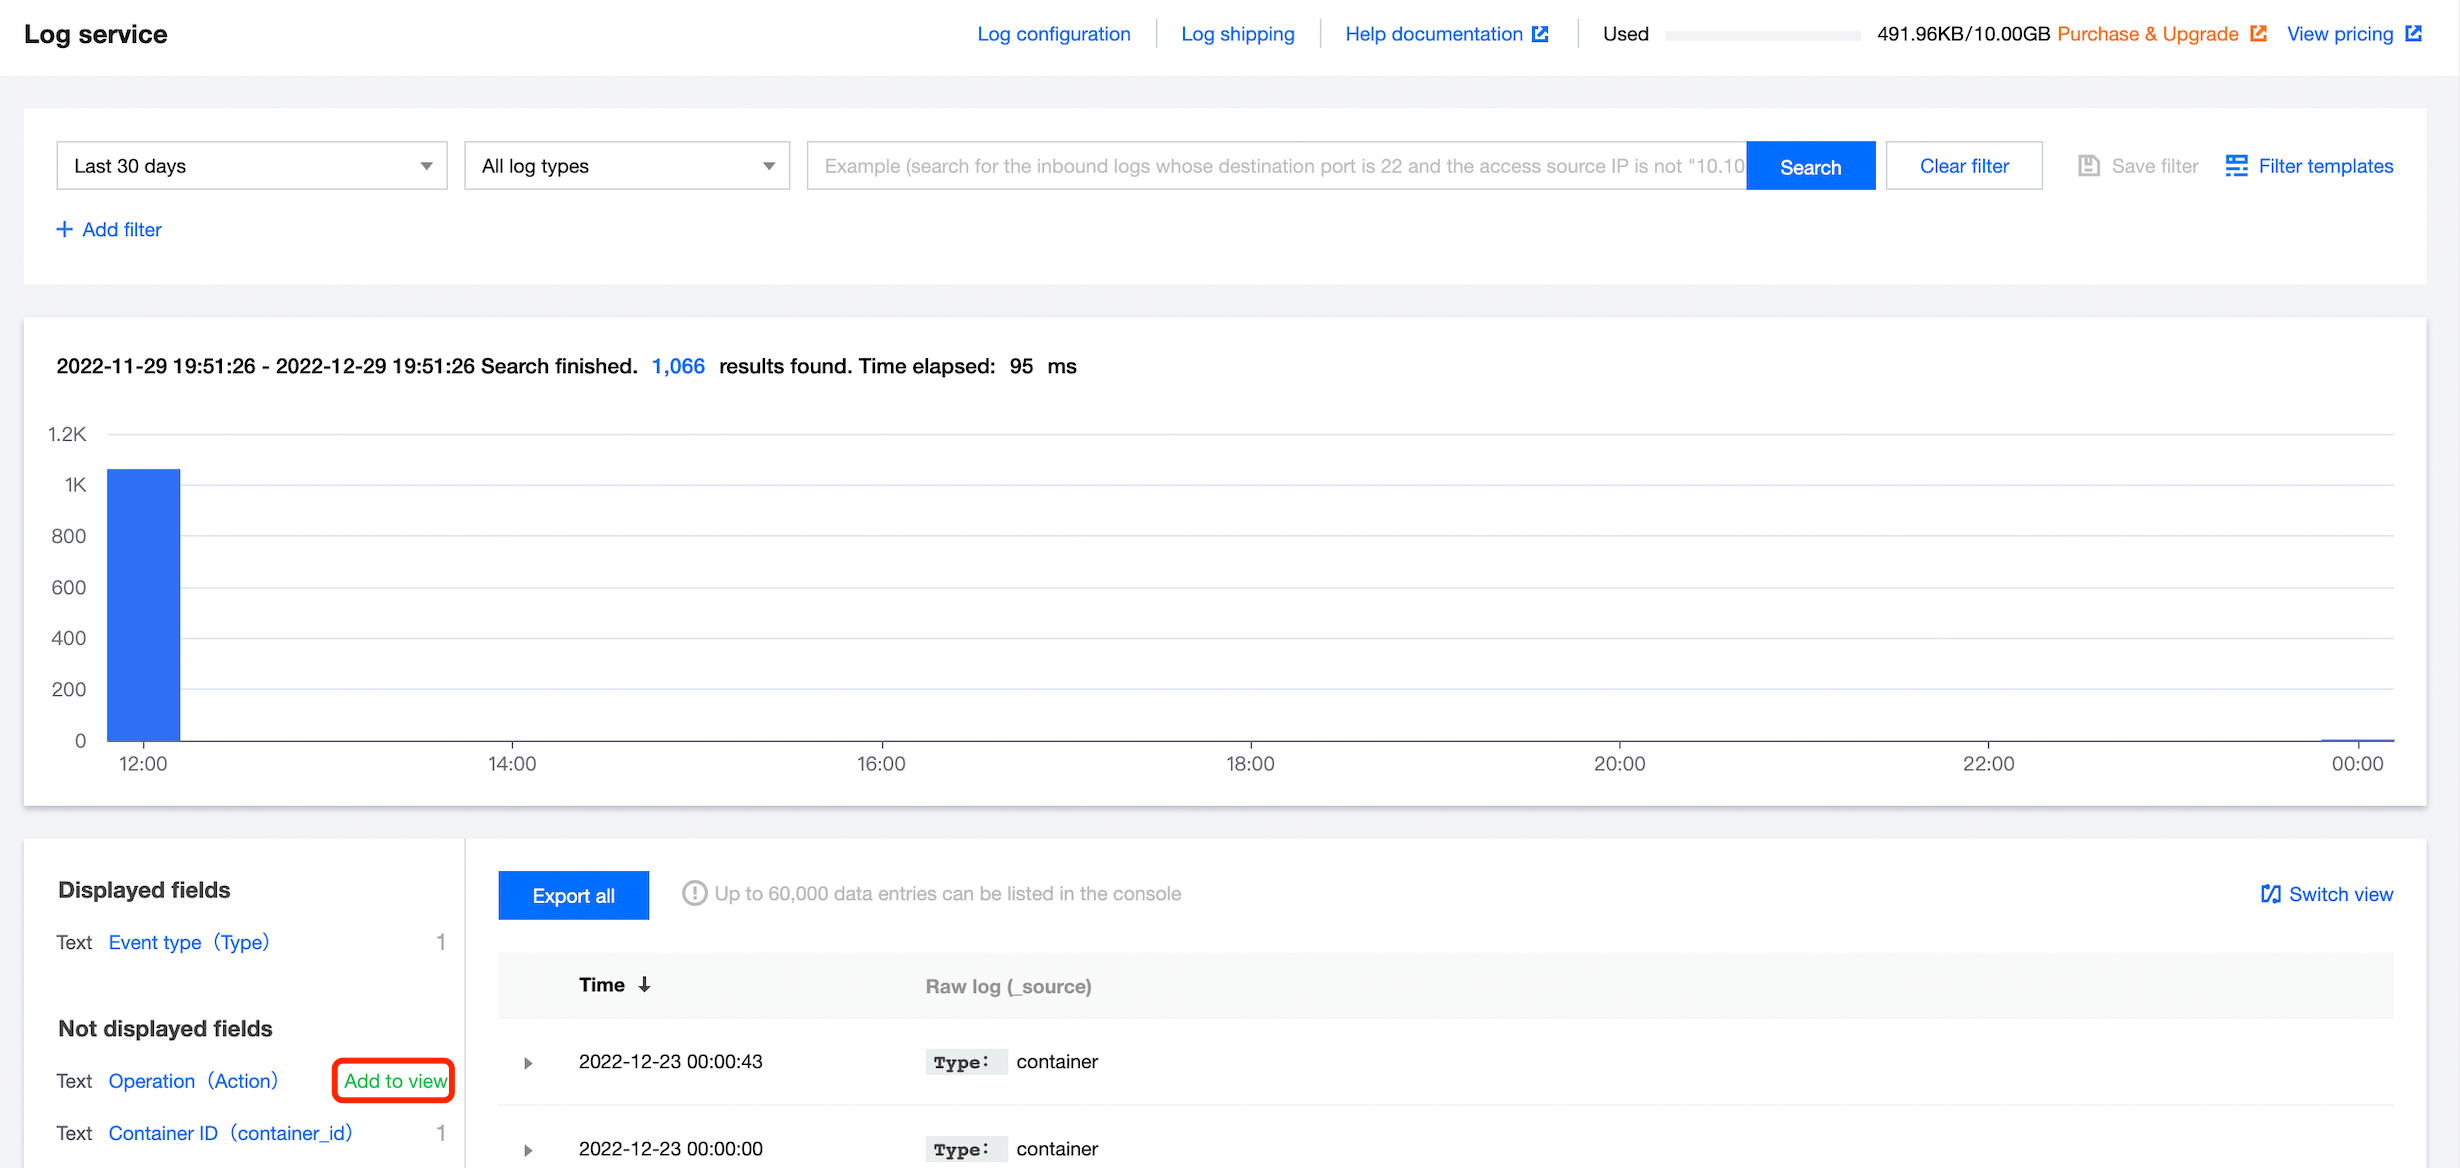
3. On the Log Analysis page, fields are displayed in the log list based on the Displayed fields. If Displayed fields is Raw log (_source), all log fields are listed. Up to 60,000 data entries can be listed in the console.
Customize fields to be displayed or hidden:
Add to view: Move the cursor to a hidden field and click Add to view on the right to add it to the displayed fields. Only selected displayed fields are listed, and hidden fields are not.
Hide: Move the cursor to a displayed field and click Remove on the right to remove it from the displayed fields. The list on the right will no longer display this field.
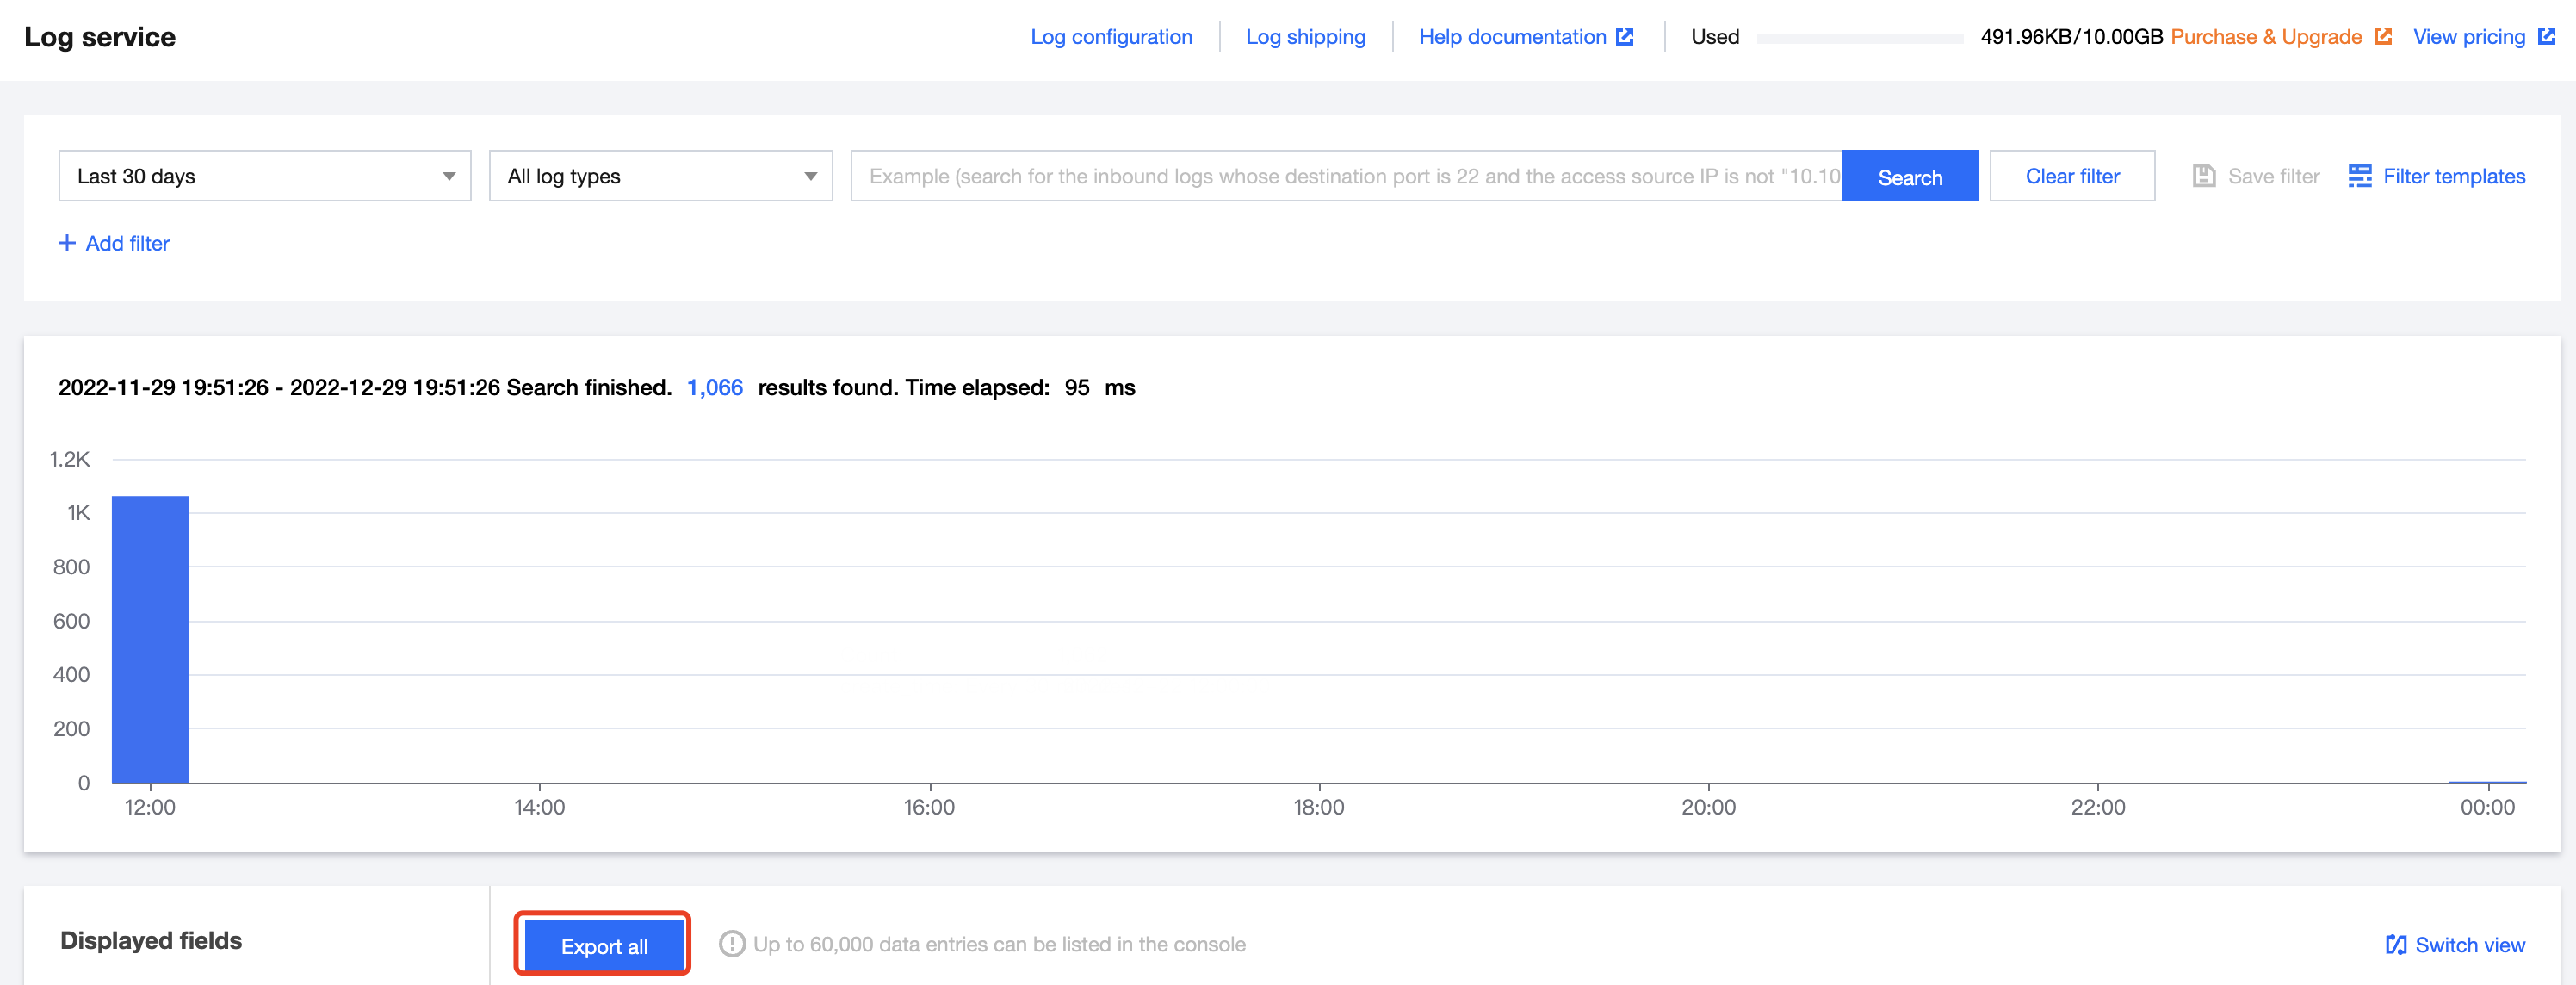
Export: Click Export all in the top-left corner of the field details, and log analysis will export 60,000 logs meeting the search condition as a file and download it through the browser to a local directory.
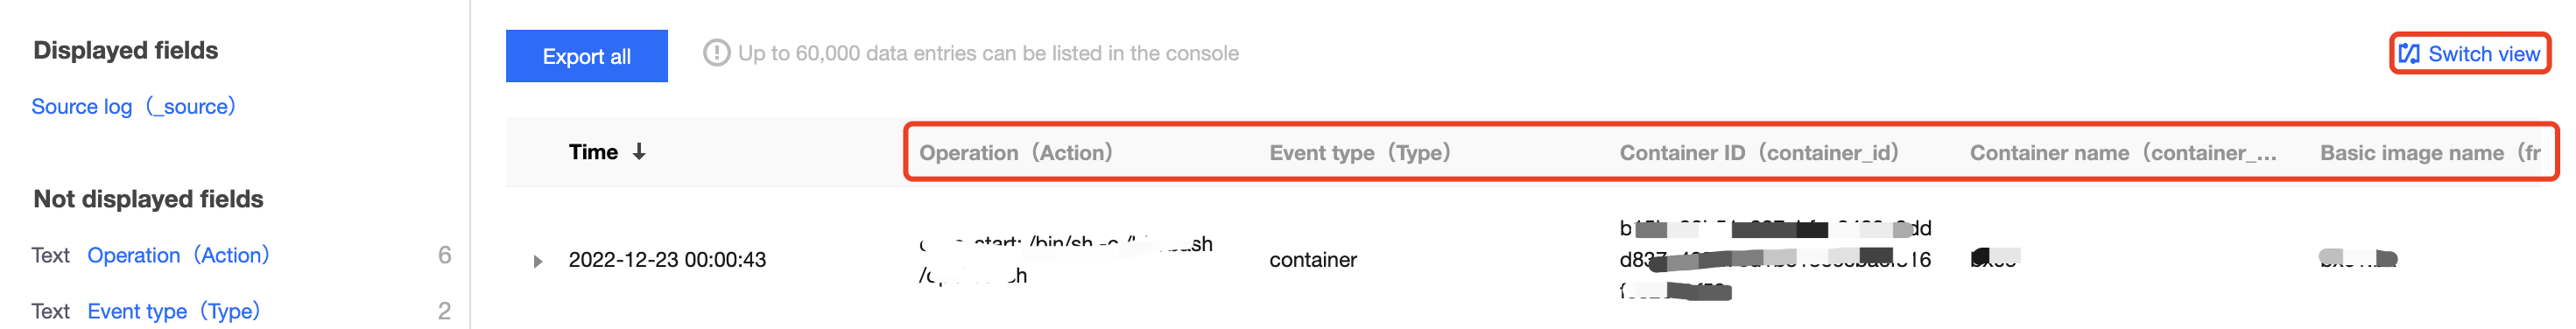
Switch the display mode: Click Switch view in the top-right corner of the field details to display the displayed fields in a table column.