Overview
Concepts
Cluster Architecture
Strengths
Scenarios
Model Type | Compute Node Specifications | Recommended Storage Type | Recommended Scenes |
Standard | 4-core 16 GB | High Performance Cloud Disk SSD Enhanced SSD Cloud Disk | Limited to POC feature testing or personal learning use, mainly used to experience and test product capabilities |
| 8-core 32 GB | High Performance Cloud Disk SSD Enhanced SSD Cloud Disk | Recommended for the test environment, supporting medium data scale and rather complex data analysis |
| 16-core 64 GB | High Performance Cloud Disk SSD Cloud Disk Enhanced SSD Cloud Disk | Recommended for the production environment, supporting data analysis of larger scale and more complex scenes, as well as high concurrency scenes |
| 32 cores and above | High Performance Cloud Disk SSD Enhanced SSD Cloud Disk | Recommended for the production environment, supporting large-scale, highly complex data analysis, high concurrency, and other scenes |
Scene | High Availability Selection | Recommended Minimum Number of FE Nodes | Recommended Minimum Number of BE Nodes |
POC feature testing | Non-high availability | 1 | 3 |
Production scenario (query high availability) | Read high availability | 3 FE nodes at least | 3 BE nodes at least, on-demand scaling |
Production scenario (query-write high availability) | Read-write high availability | 5 FE nodes at least | 3 BE nodes at least, on-demand scaling |
Cross-AZ high availability scenario | Read-write high availability + 3 AZ deployment | 5 FE nodes at least | 3 BE nodes at least, scaling in increments of 3 |


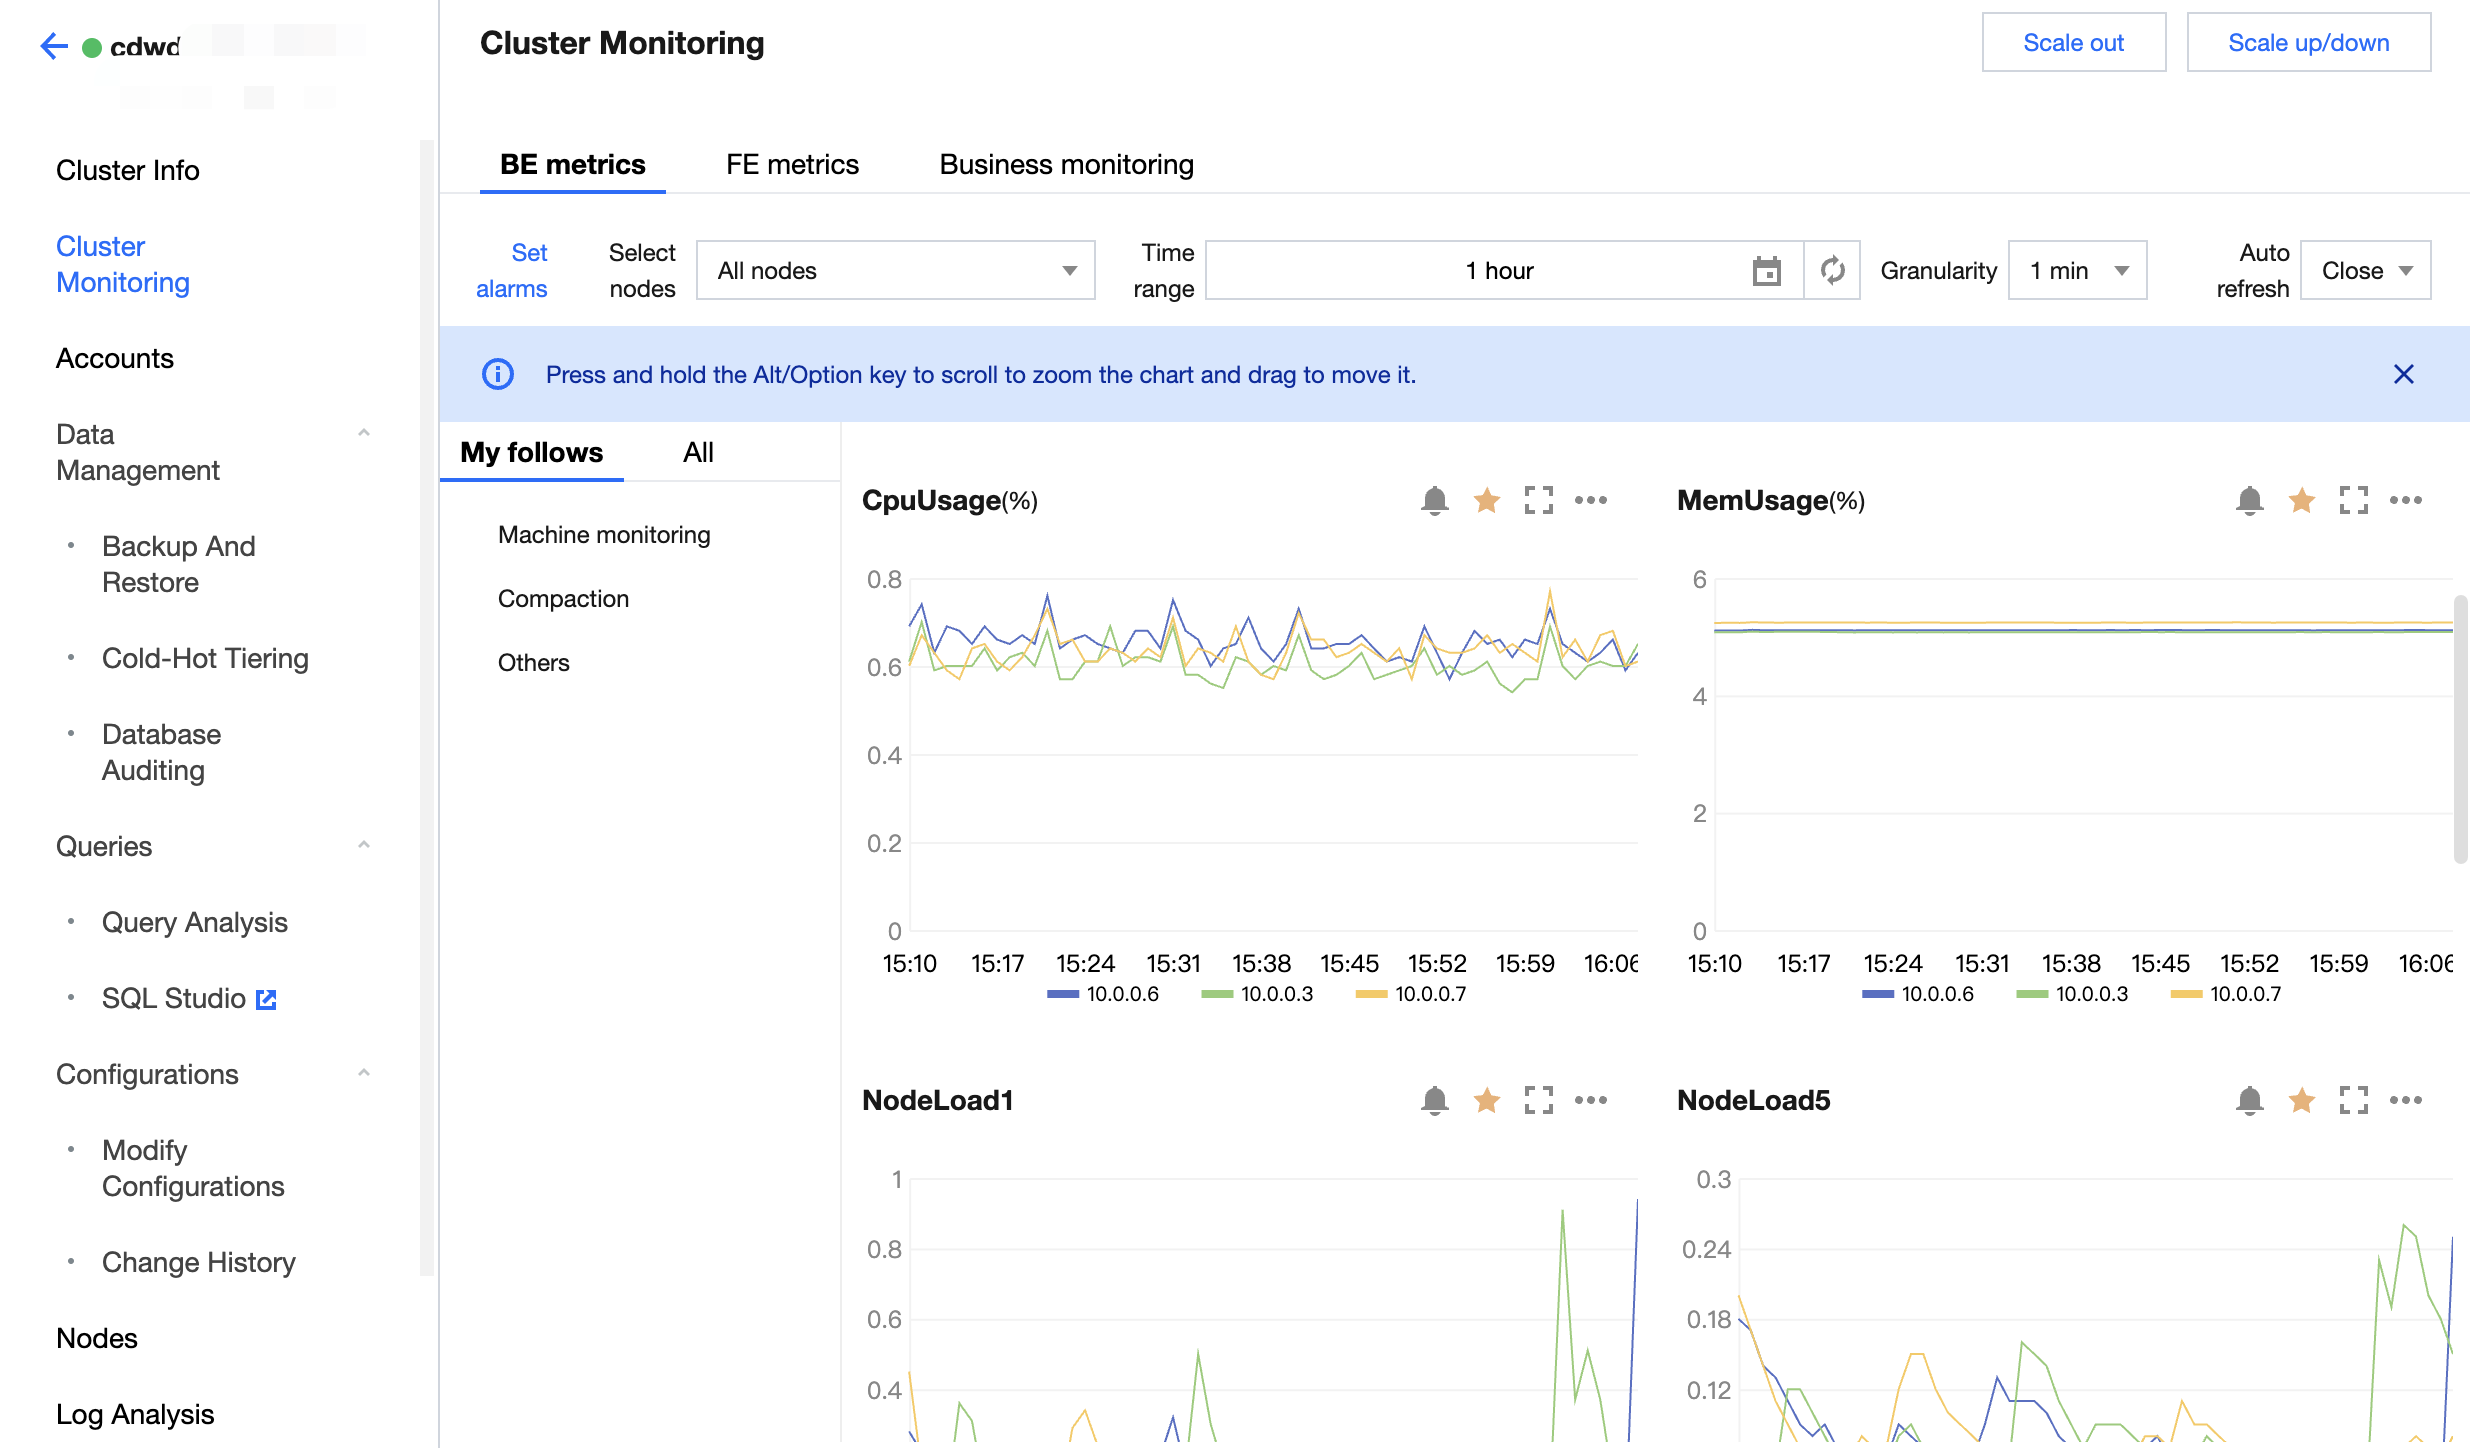
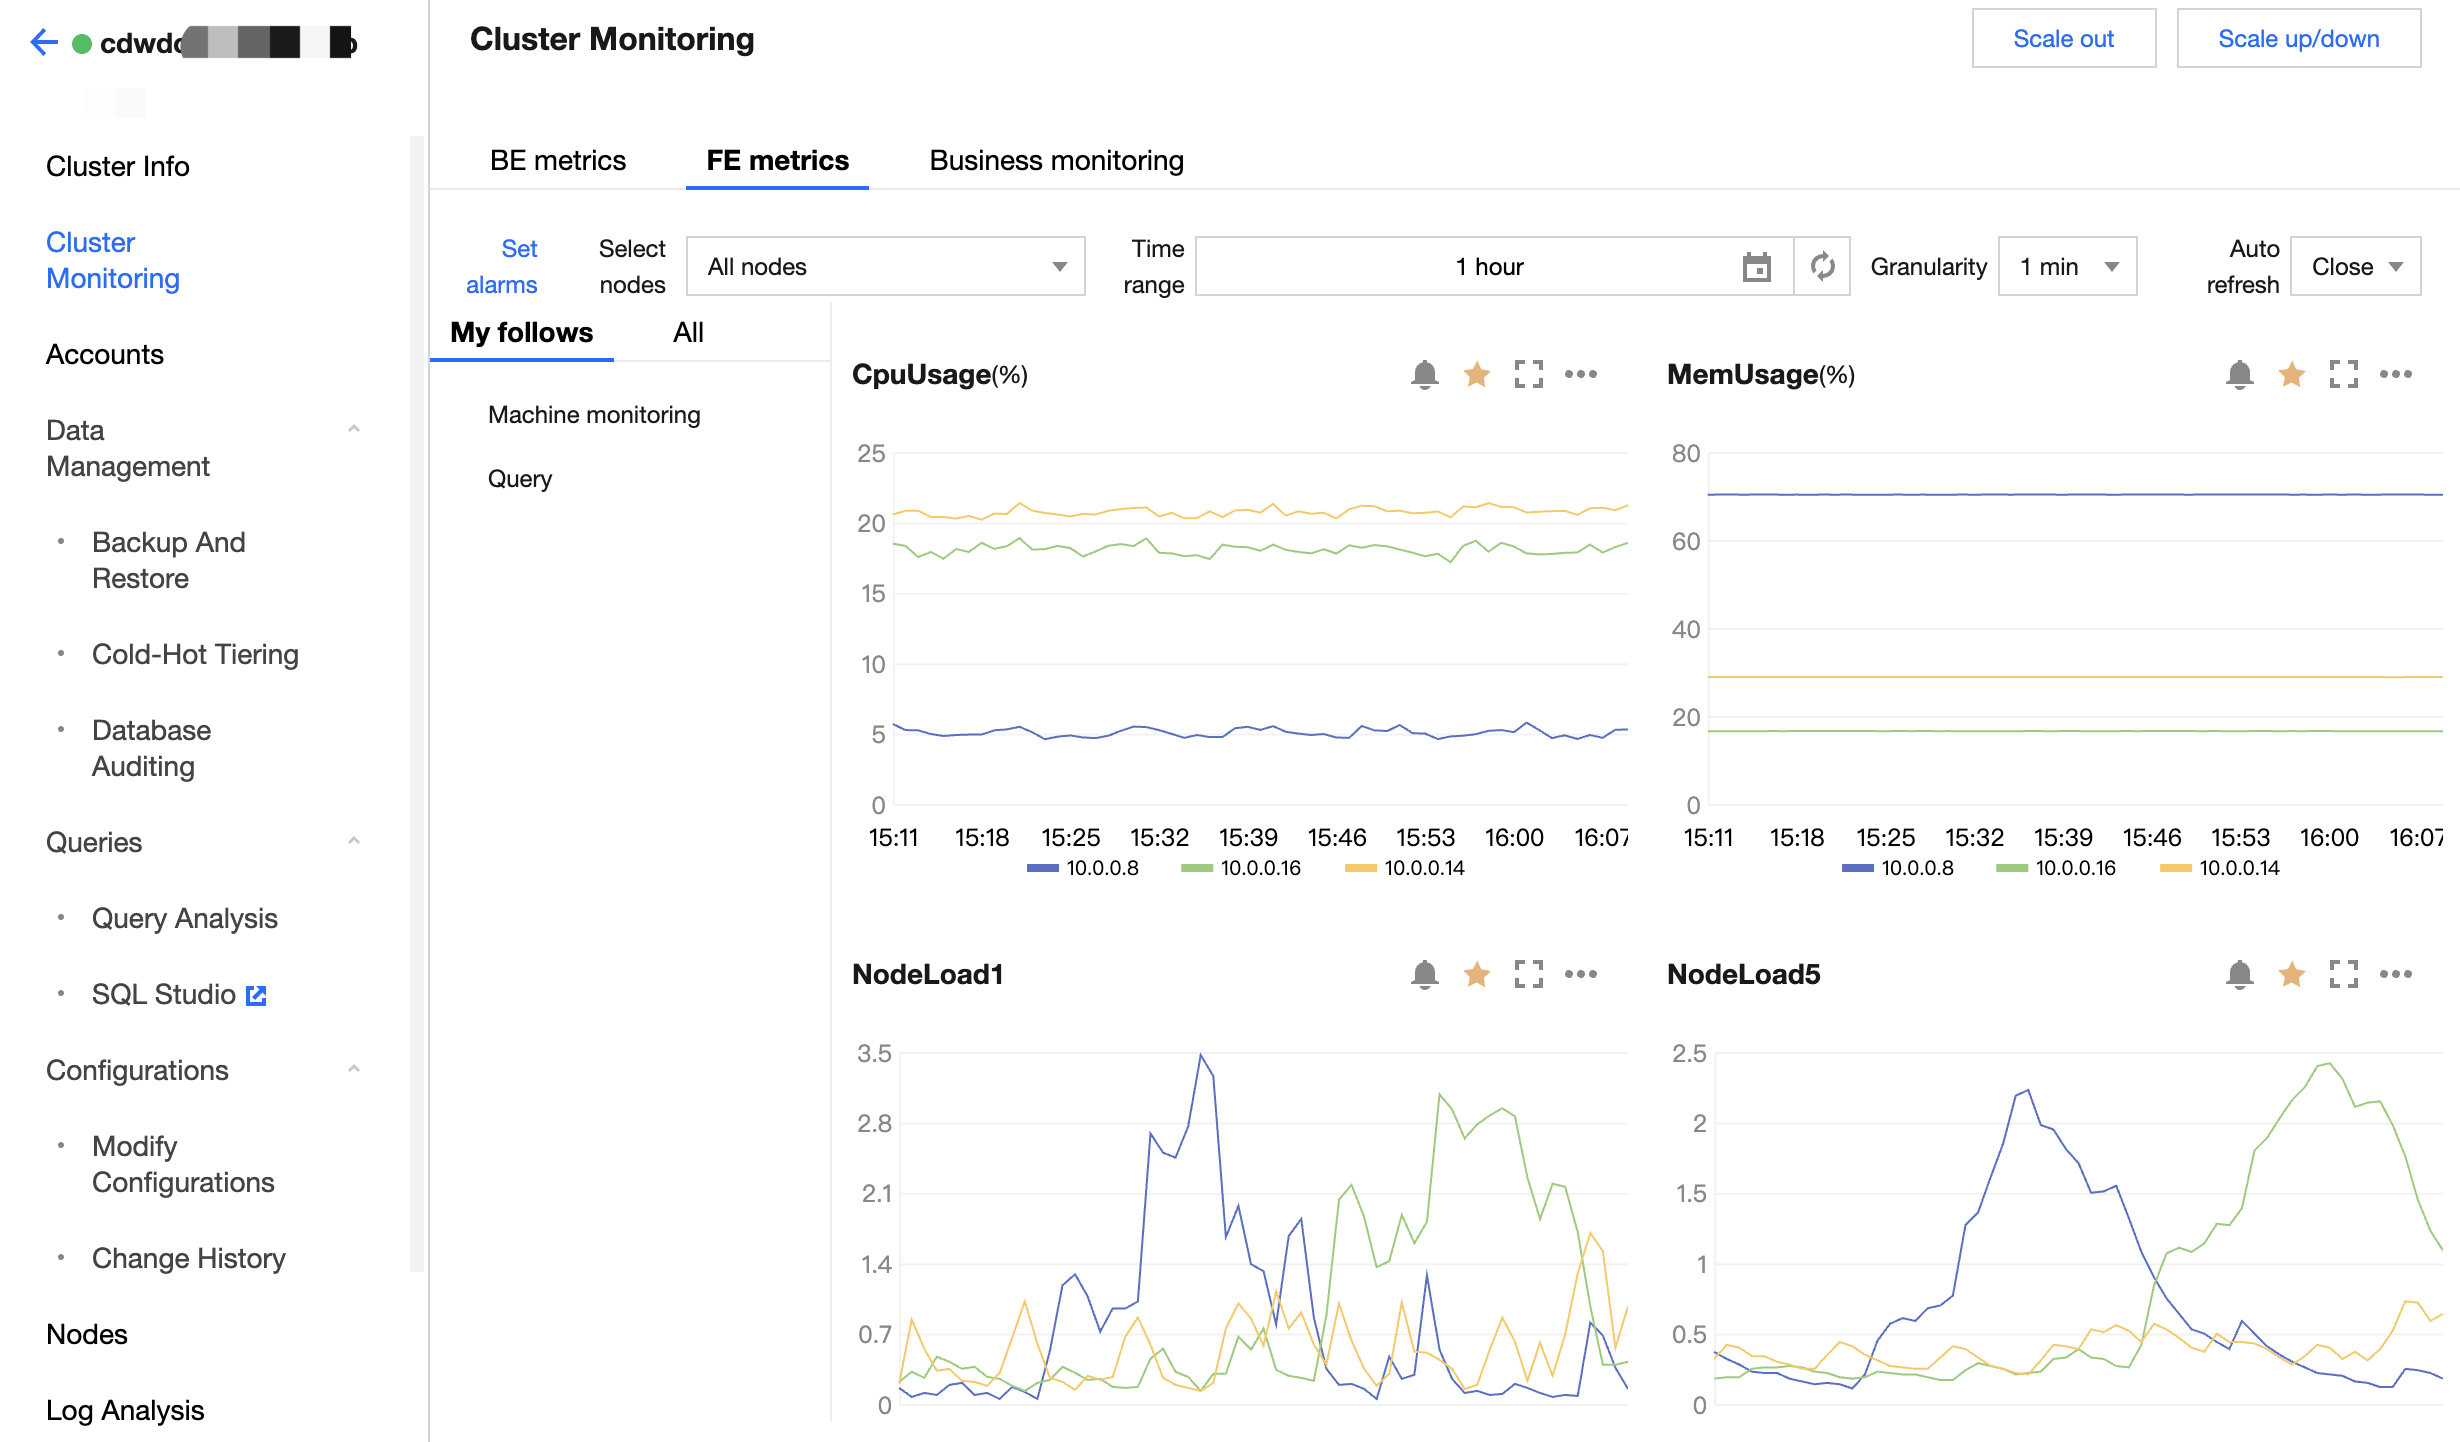
Common Scenes | Resource Consumption Performance | Optimization Suggestions for the Usage Continuously Exceeding 85% |
Too much data continuously imported | The CPU and memory of FE and BE will be highly used. | If the bottleneck is FE: Vertical upgrade is recommended. If the bottleneck is BE: Vertical upgrade is recommended. |
Frequent point checks/high concurrency | The CPU of FE and BE will be highly used. | If the bottleneck is FE: Vertical upgrade is recommended. If the bottleneck is BE: Vertical upgrade is recommended. |
Frequent metadata changes and deletions | The memory of FE will be highly used. | It is recommended to upgrade FE vertically and increase memory. |
Many multi-table join/aggregation queries | The CPU and memory of BE will be highly used. | It is recommended to horizontally scale out BE. Vertical upgrade is also an option. |
Data multi-concurrency writing | The CPU and memory of BE will be highly used. | It is recommended to horizontally scale out BE. Vertical upgrade is also an option. |
Operation Type | Must-Knows |
Scale-out | During the horizontal scale-out process, system reading and writing are still possible, but there may be some jitters. The operation takes about 5 to 15 minutes. Choose to perform it during non-business peak hours. When both the amount of data storage and the amount of queries increase relatively, horizontal scale-out is the preferred option. |
Scale-in | Only one type of nodes can be selected for scale-in operation at a time, such as FE scale-in only or BE scale-in only. FE scale-in: Multiple FE nodes can be scaled in at one time. BE scale-in: Scaling in multiple BE nodes at one time may result in data loss or be time-consuming. It is recommended to scale the node in one by one. During the scale-in process, system reading and writing are still possible, but there may be some jitters. |
Vertical upgrade/downgrade | The scale up/down system cannot be read or written. Computing specifications can be upgraded or downgraded; storage specifications can only be upgraded. The results of specification adjustment are effective for all nodes in a cluster. |
Optimization Type | Optimization Instructions |
Usage recommendations | If you often perform point queries on a column and the column has a high cardinality, it is recommended to create a Bloom filter index on this column. If you often perform fixed-mode aggregate queries on a table, it is recommended to create a materialized view on this table. It is recommended to divide partitions and buckets reasonably according to business scenes to avoid excessive FE memory usage due to too many partitions and buckets. For SQL queries of general data exploration, if not all data is needed, it is recommended to add a limit number for the records returned, which can also speed up the query. It is recommended to use CSV for data import and avoid JSON format. |
Try-to-avoid | Avoid select * queries. Avoid enabling profiles globally (This will result in more resource consumption. It is recommended to enable profiles for the demanding SQL statements). When creating a table: Avoid enabling merge_on_write (this feature is not yet mature). When creating a table: Avoid enabling auto bucket (this feature is not yet mature). When creating a table: Avoid opening a dynamic Schema table (this feature is not yet mature). Avoid the join of multiple large tables. When multiple large tables are joined: Every two large tables can be joined through Colocation Join. Or use pre-aggregate tables and indexes to speed up queries. |
Parameter optimization | When a SQL statement involves multiple concurrent operations, it is recommended to increase the parallel_fragment_exec_instance_num parameter. The default value of this parameter is 200. It can be increased by multiples (such as 400 and 800). It is recommended to control it within 2,000.It is recommended to control the compaction speed. If the monitoring metric base_compaction_score exceeds 200 and continues to rise (for details, see the Cluster Monitoring-BE Indicators-BE page), you can increase the compaction_task_num_per_disk parameter configuration (the system default is 2, which can be increased to 4 or greater). |
フィードバック