The primary role of dimensions and metrics is to describe and measure the size of certain attributes or features. Dimensions and metrics often appear in pairs and are used in conjunction with.
Dimensions: Specify the descriptive attributes or features of objects with different values.
Metrics: Measure the attribute's metrics based on certain attributes.
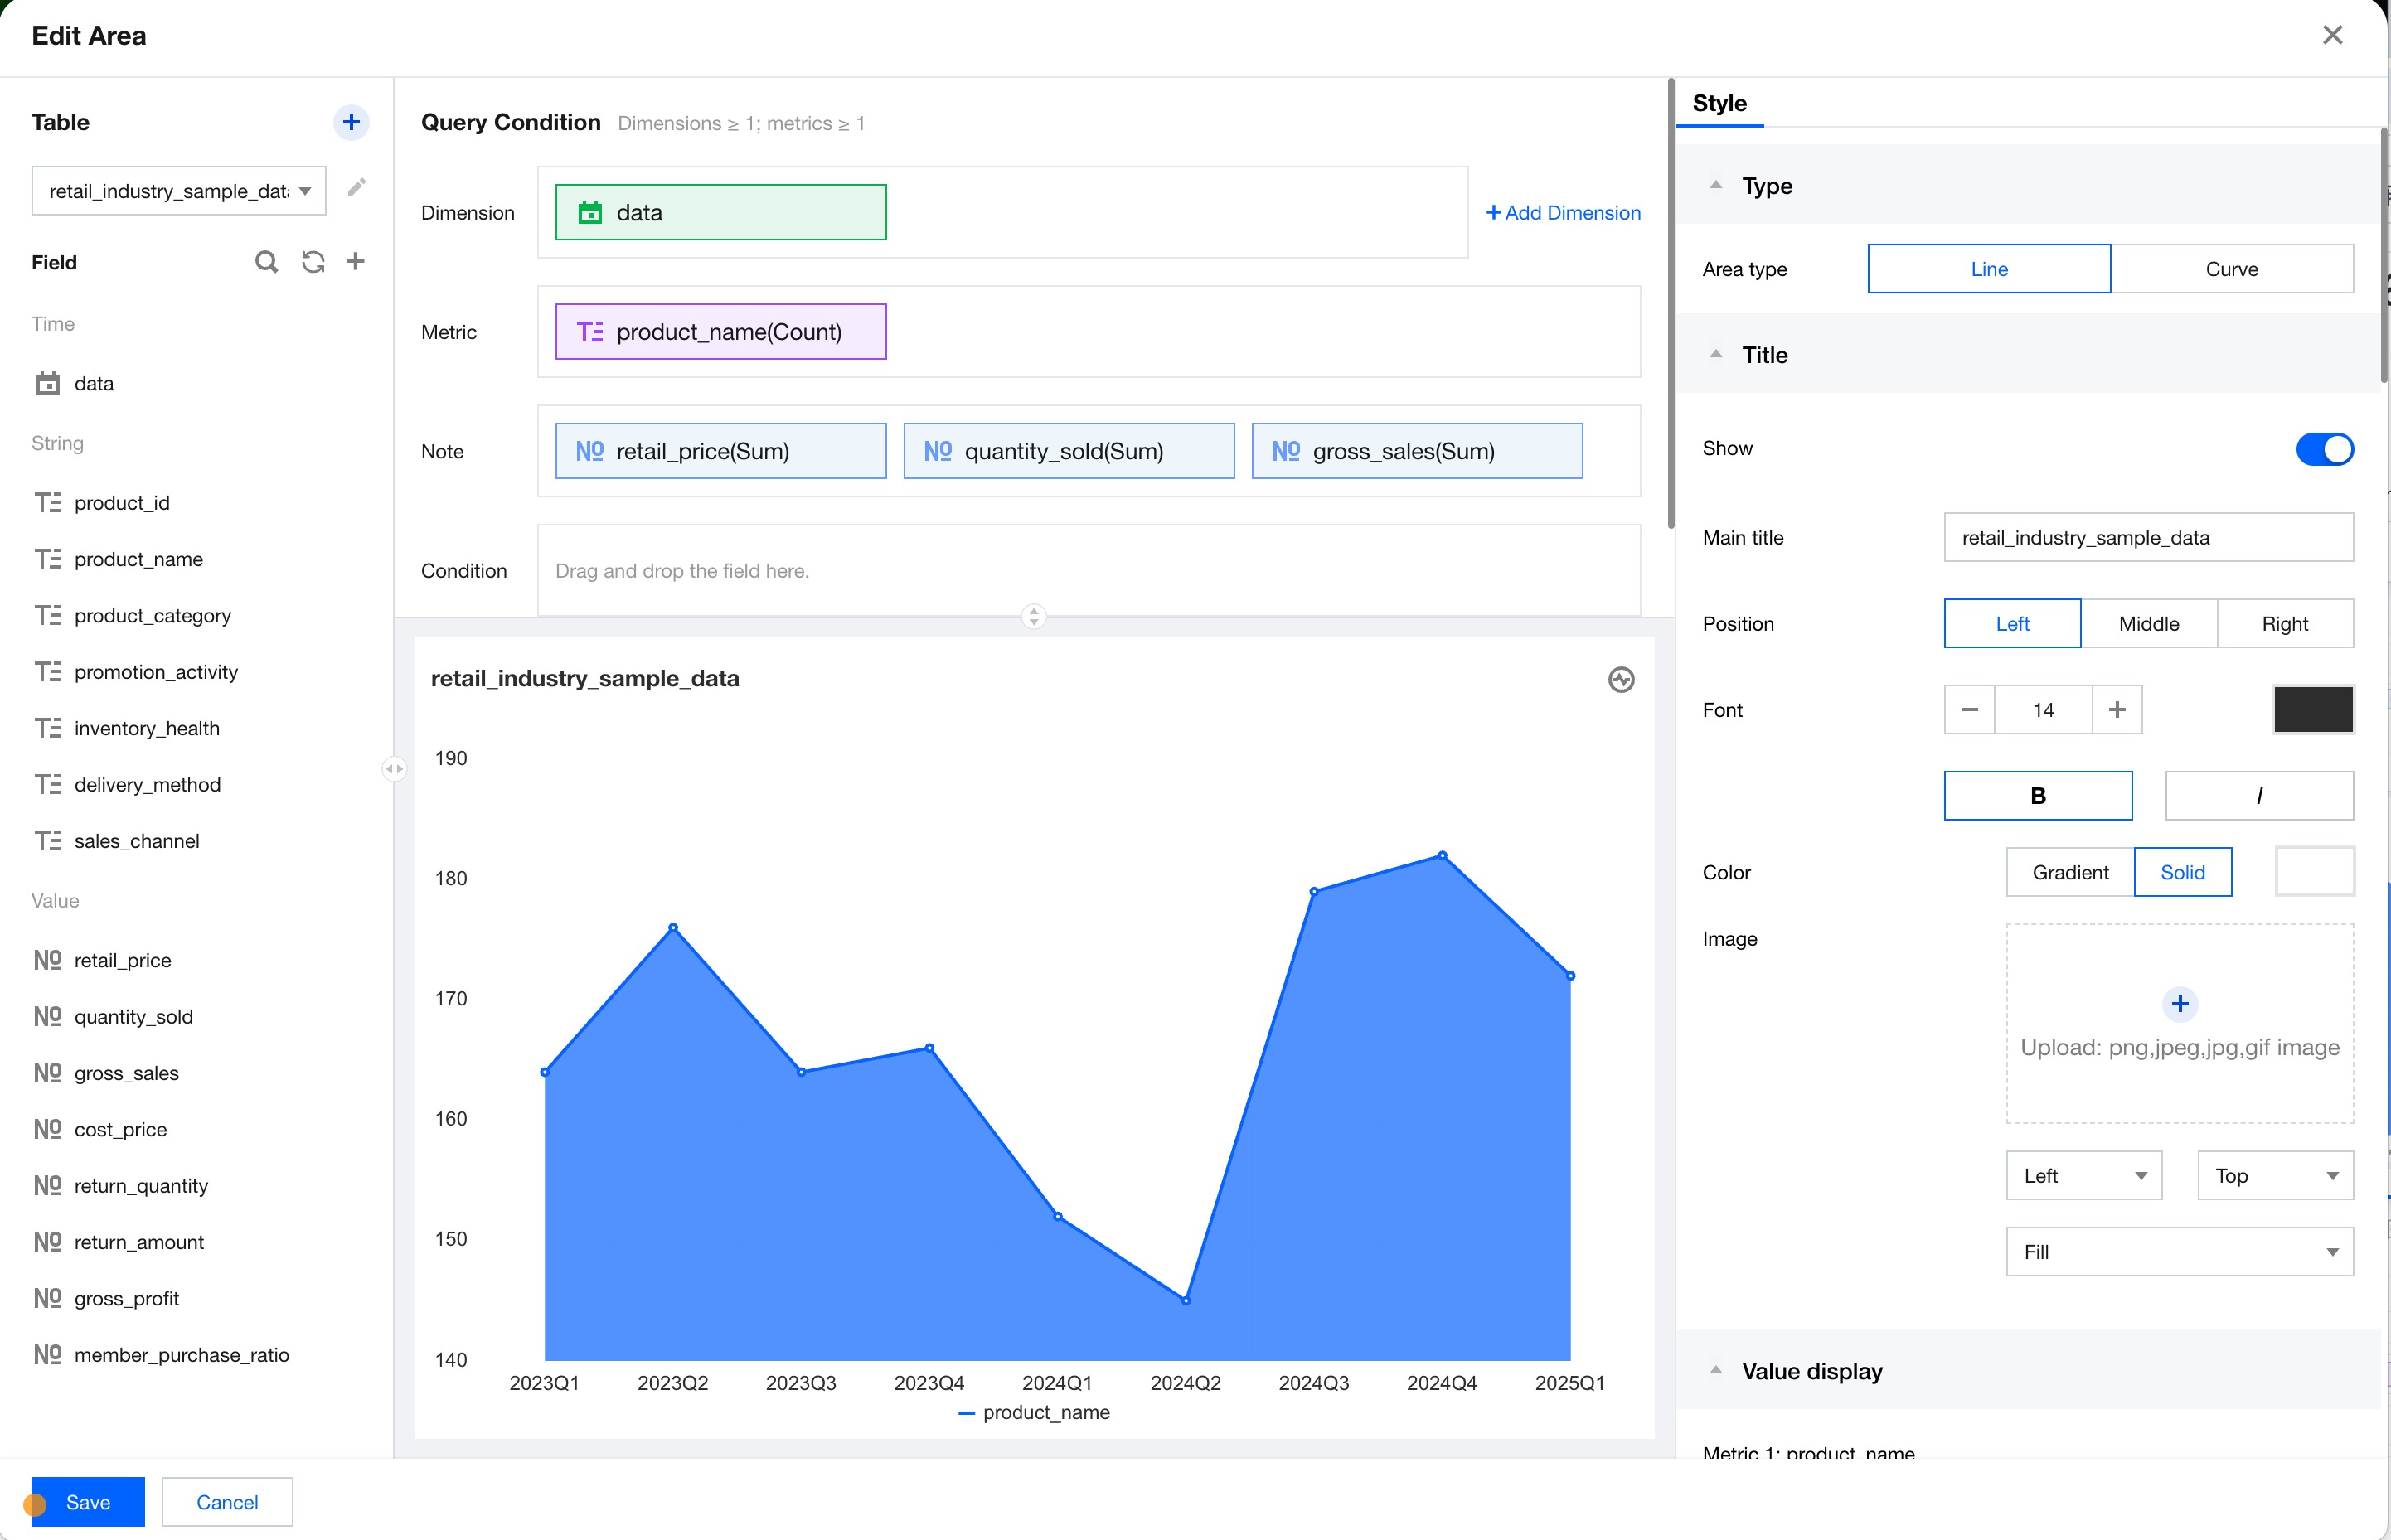
Note: The display functionality for auxiliary information will show the field information dragged into the prompt query condition in a pop-up dialog box when you hover the mouse over a chart data point. These fields will not affect the main visual representation of the chart but provide valuable context information.
Conditional query mainly provides dynamic data filtering. You can apply filter conditions to chart data through visual interaction. This feature supports field-level condition settings, with no need to write complex query statements for precise data filtering.
Aggregation Calculation
In data analysis cases, you can calculate data based on different calculation criteria.
1. Dimension calculation: Time aggregation is applied, allowing for data to be grouped and aggregated by the time granularity of year, month, day, hour, minute, or second. Custom grouping is supported, such as grouping provinces like Jiangsu, Zhejiang, Shanghai, and Anhui into East China.
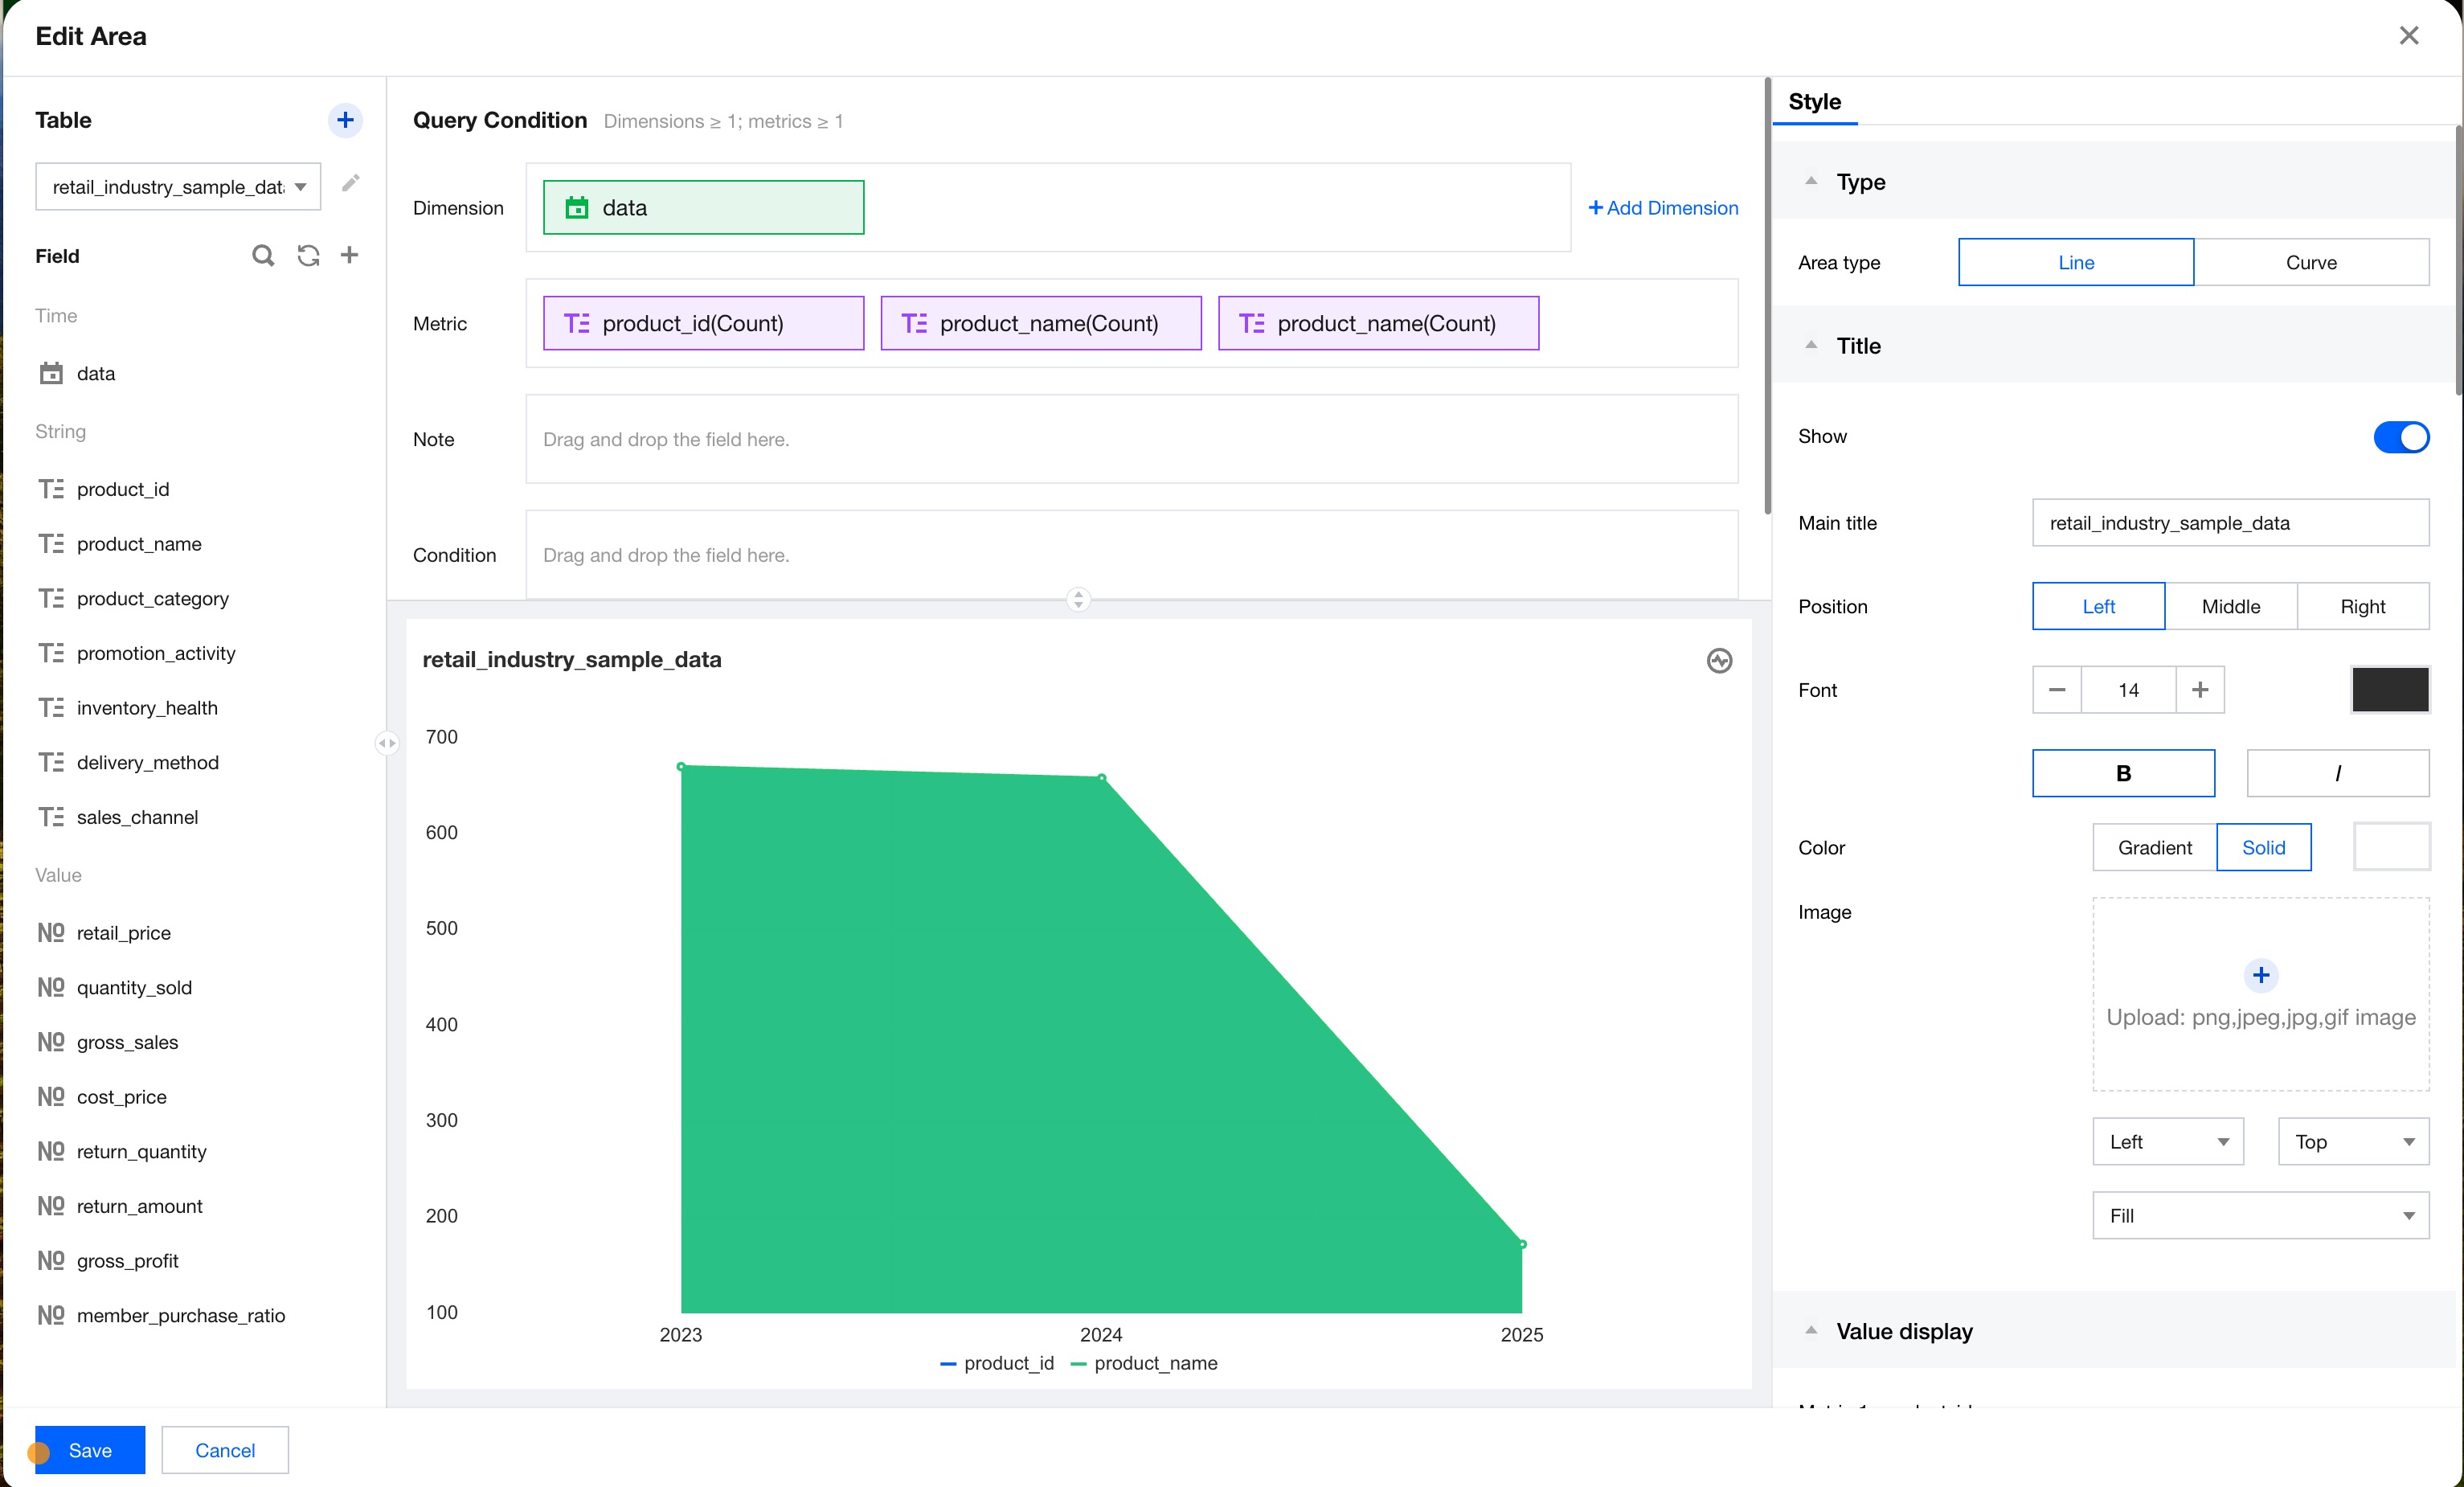
2. Metric calculation: The aggregation methods include sum, count (deduplication), maximum value, minimum value, and average value.
Dimension Tables and Fact Tables
1. Dimension tables: Dimension tables generally provide descriptive information about facts. Each dimension table corresponds to an object or concept in the real world, such as users, products, dates, or regions.
Features:
Dimension tables are very wide, as they contain multiple attributes and thus have many columns.
Compared with fact tables, dimension tables contain fewer rows: Generally, the number of rows is less than 100,000.
The content is relatively fixed: Coding tables.
2. Fact tables: Each row of data represents a business event (including order placements, payments, refunds, and reviews). The term "fact" indicates the measure of a business event (including countable occurrences, count, quantity, and amount), such as the order amount in an order event.
Features:
Fact tables are relatively narrow, as they have fewer columns.
Compared with dimension tables, fact tables contain more rows.
The content changes more frequently, with numerous data entries added on a daily basis.
Data Table Joining
Use case: When the fields in a single table cannot meet usage demands, expanding fields and data rows are required. To join multiple tables together, you need to use the join operation.
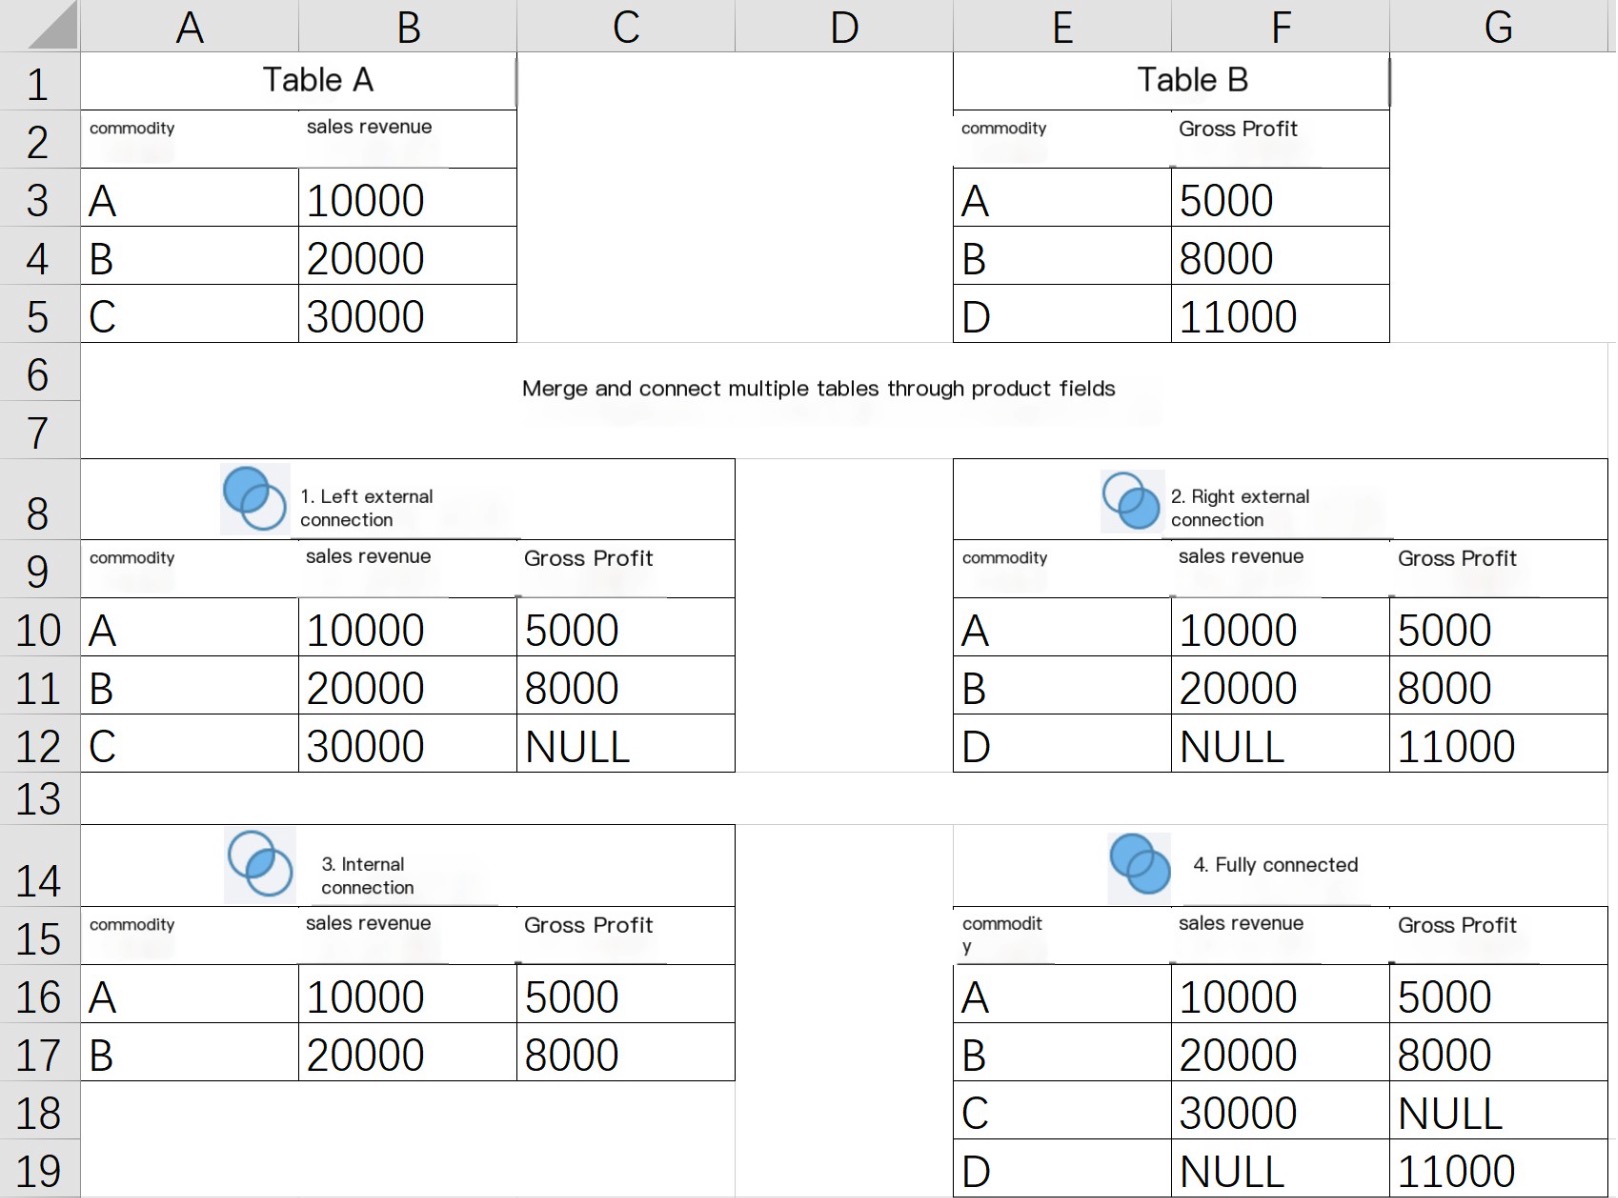
1. Left outer join (left join): The left table serves as the base. The query result includes all data from the left table. Unmatched data from the right table is displayed as null.
2. Right outer join (right join): The right table serves as the base. The query result includes all data from the right table. Unmatched data from the left table is displayed as null.
3. Inner join: The left and right tables are joined together by ID to generate a new table. The new table consists of the intersection of both tables.
4. Full join: A combination of left join and right join that contains all data from both the left table and the right table. Unmatched data is displayed as null.