After adding a component to the canvas, you need to specify the fields for analysis. The steps for field analysis are as follows:
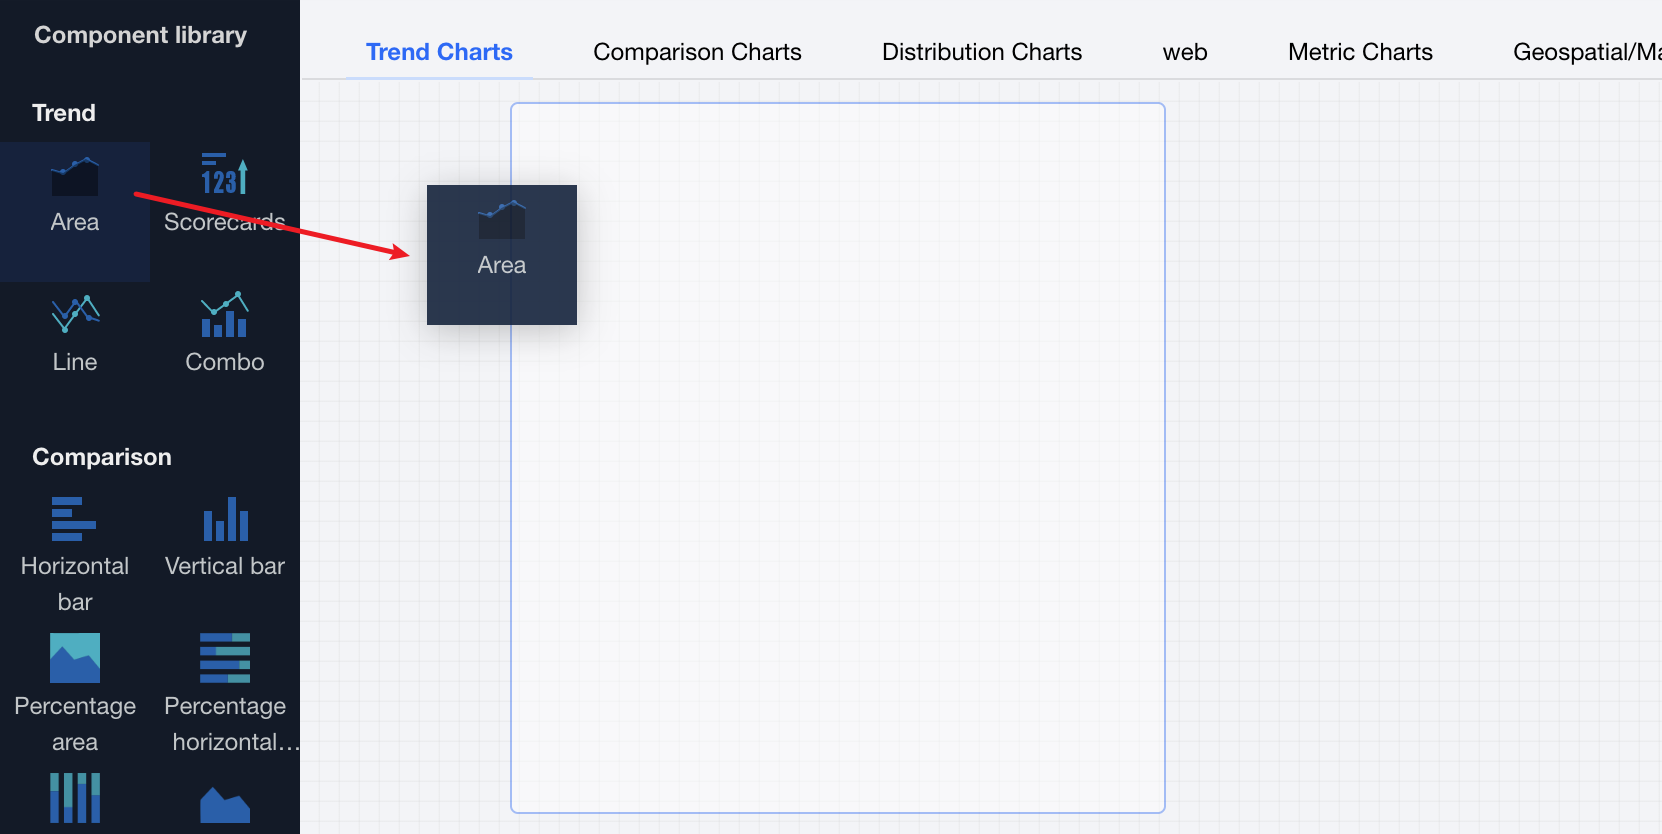
1. Create a chart: Drag and drop a chart component into the canvas.
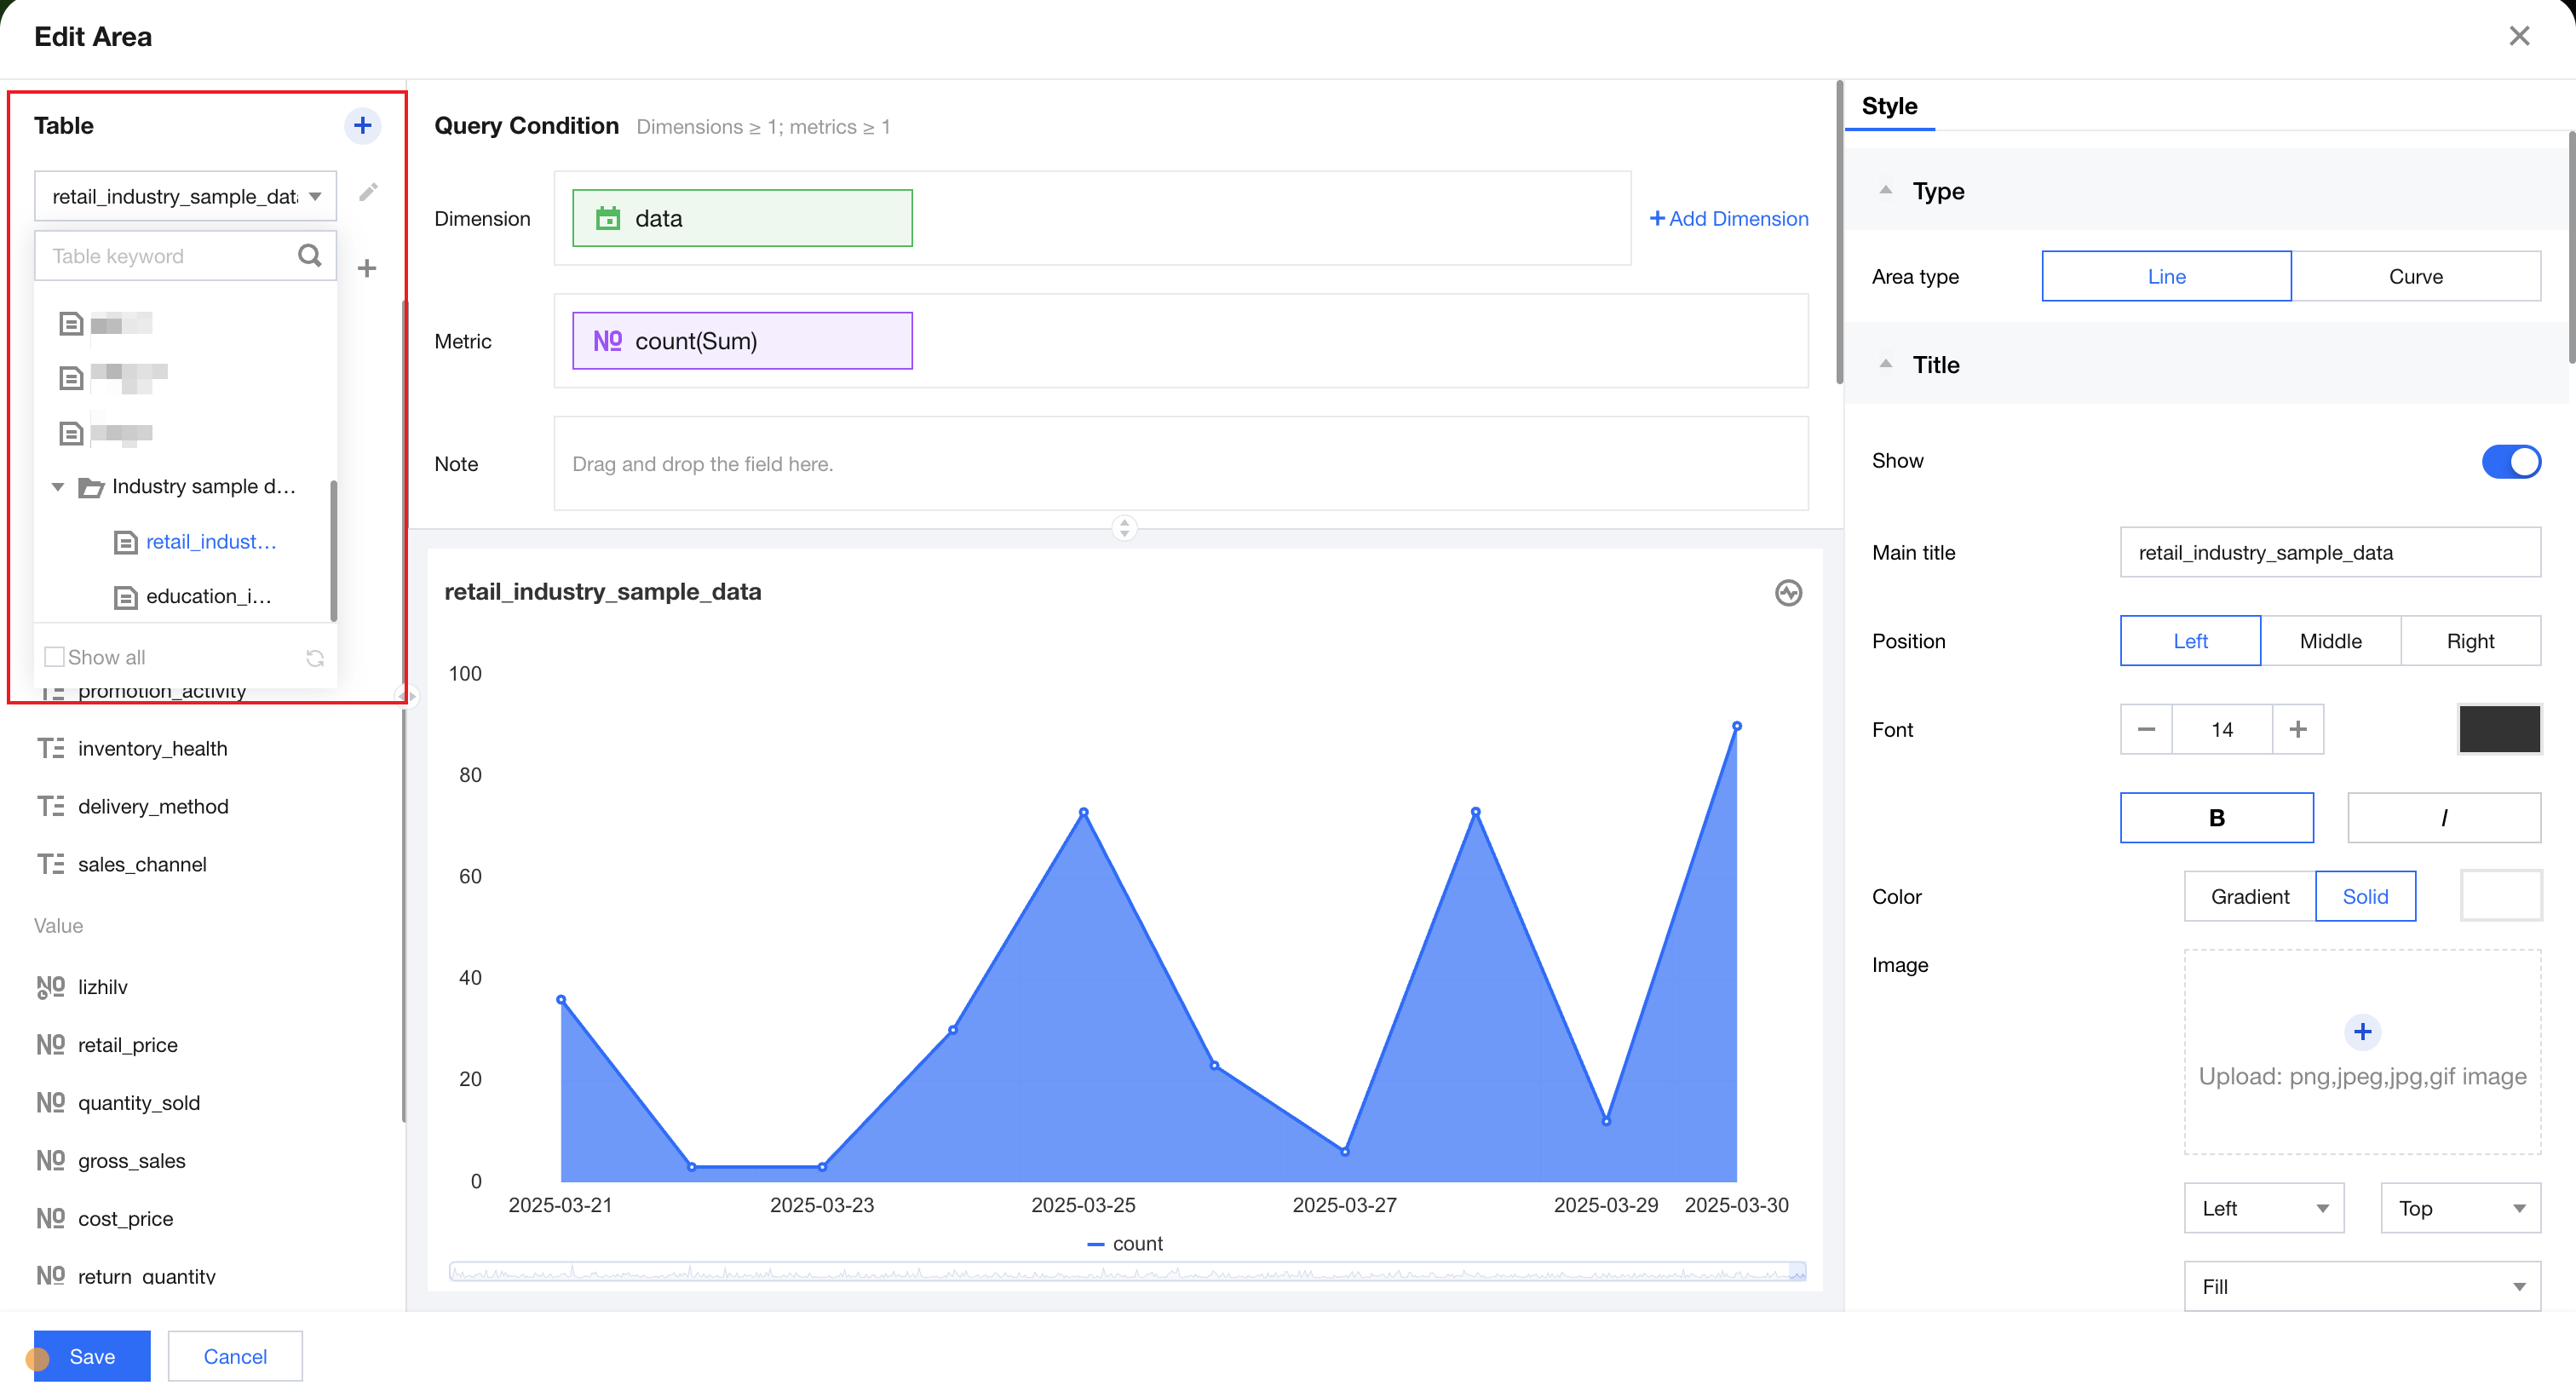
2. In data configurations, select a data table:
Note
If no data table is available, click Create Data Table to create one.
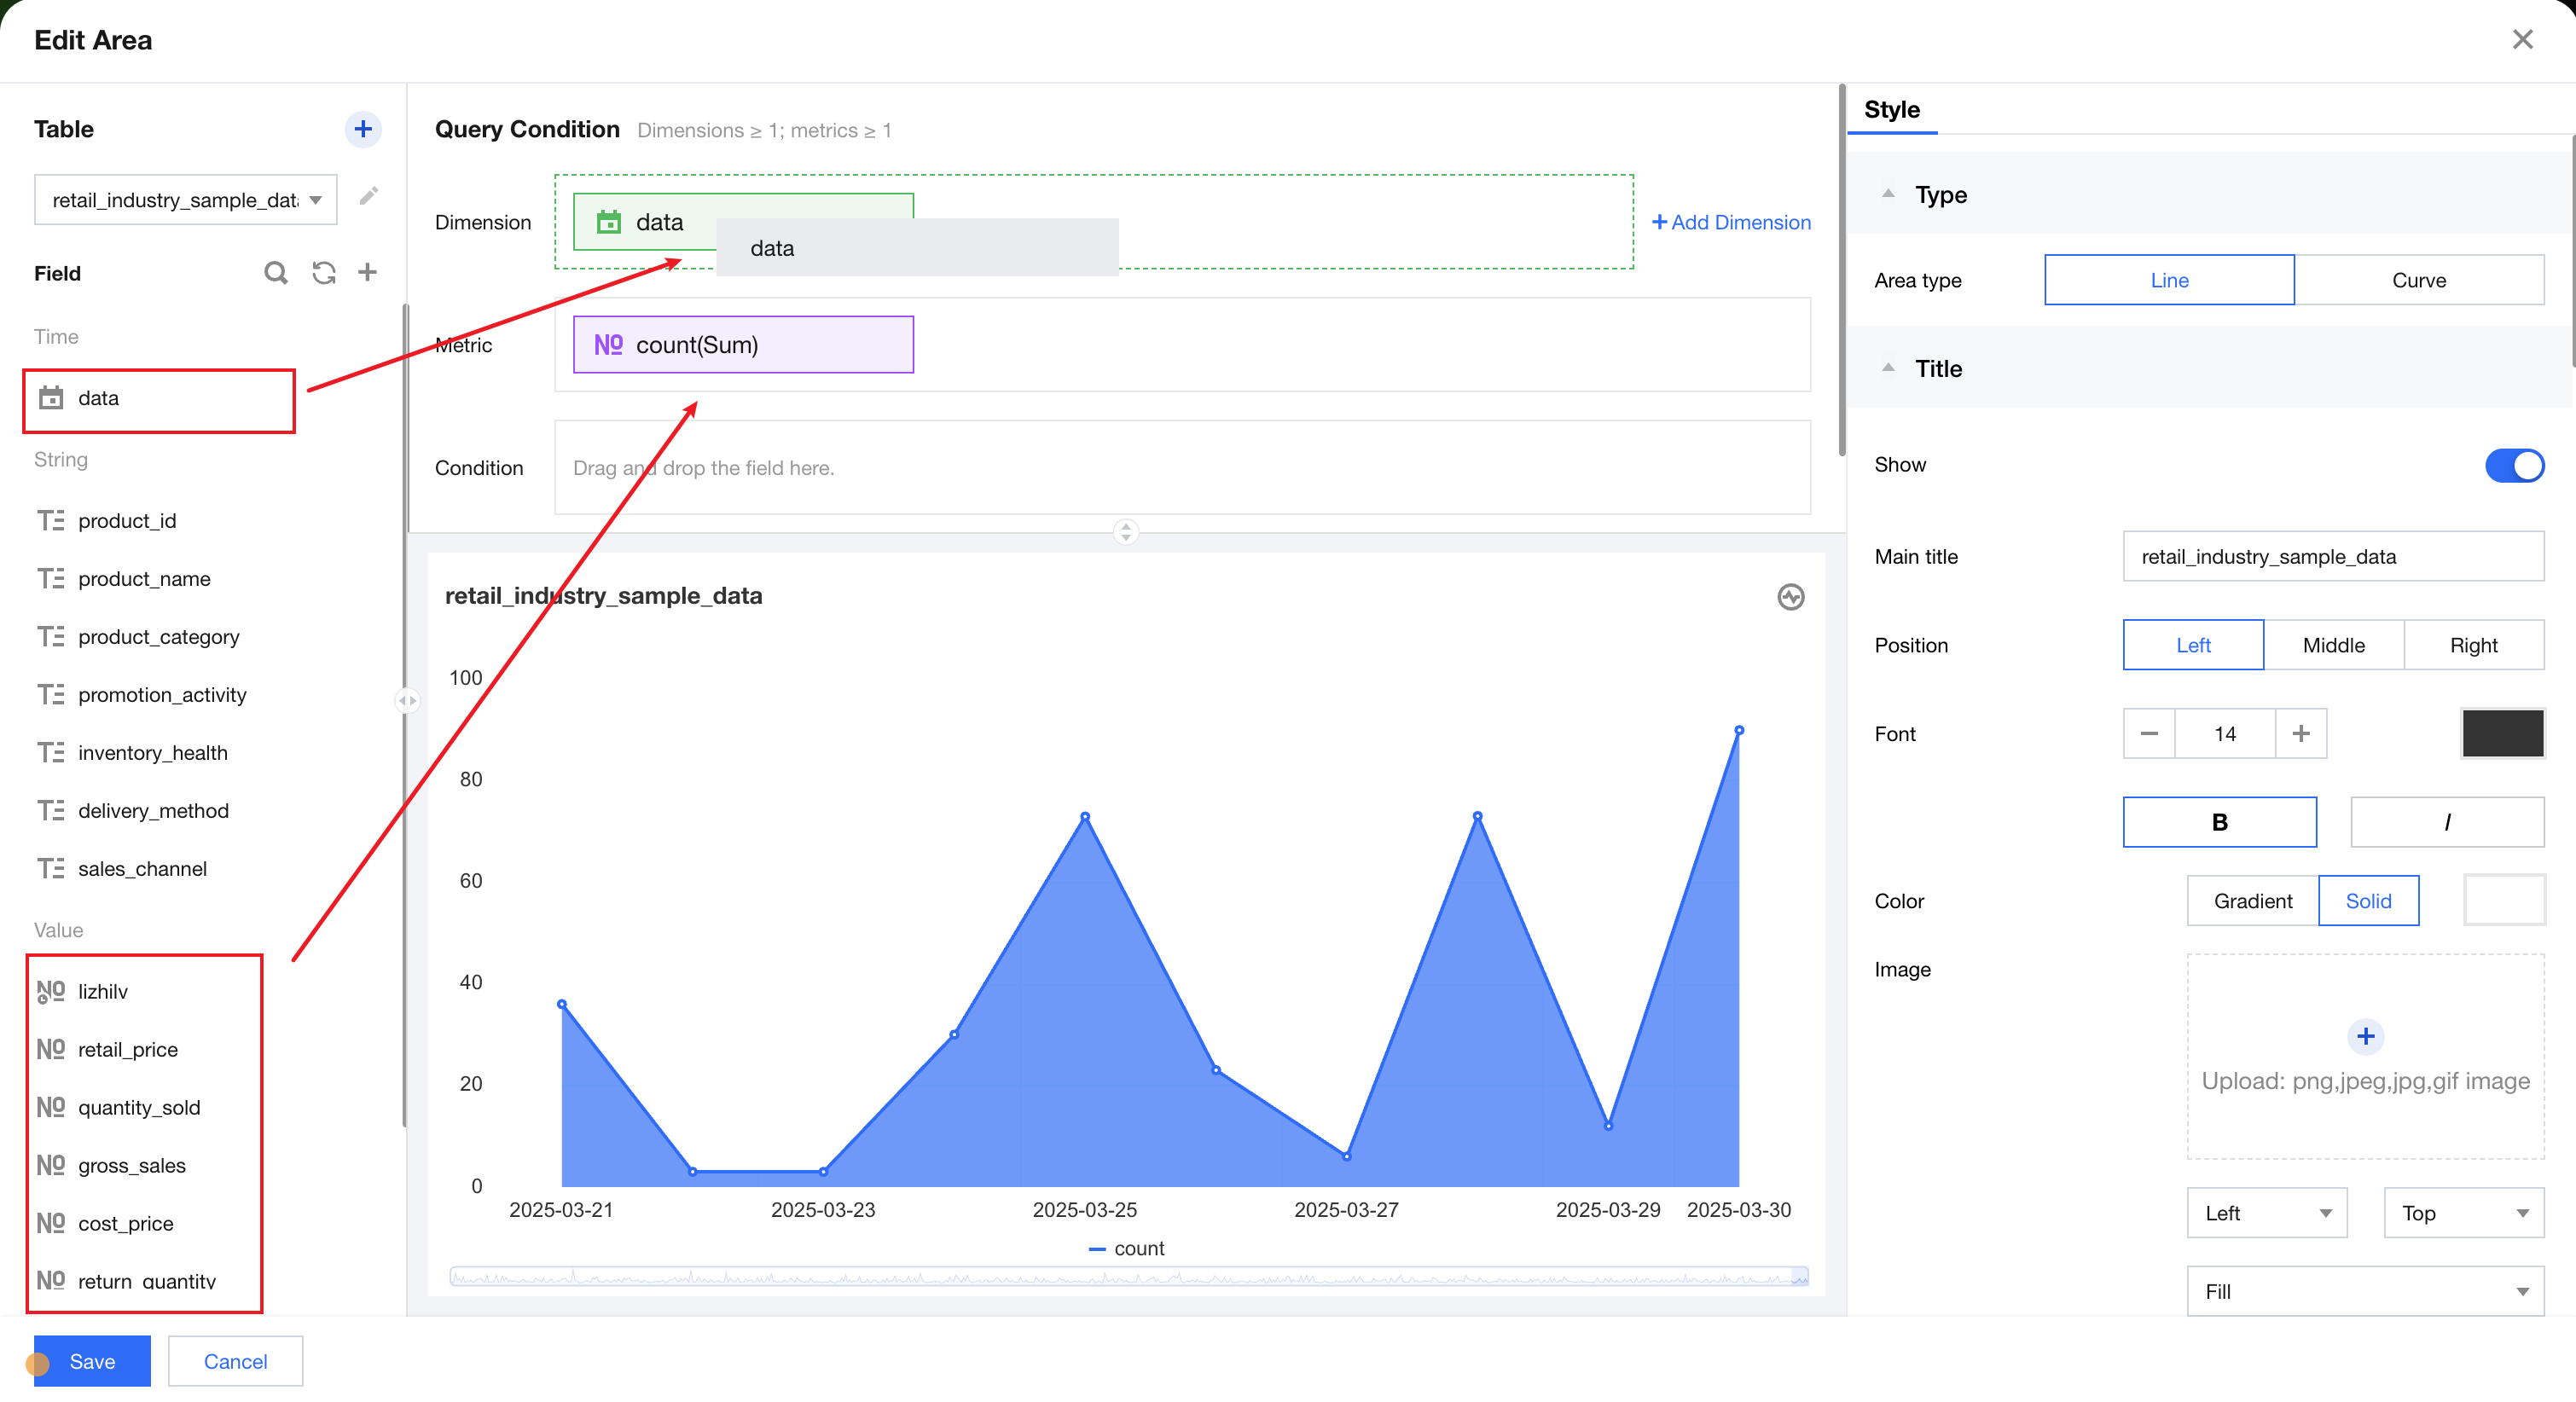
3. Drag and drop a field into the "Dimension" box: After a data table is selected, the system will automatically retrieve all fields under the table and group them by field type.
4. Delete a dimension/metric field: To replace a dimension or metric field, click "X" on the right side of the field to delete the field.
5. Click Analyze to view analysis results.
Note
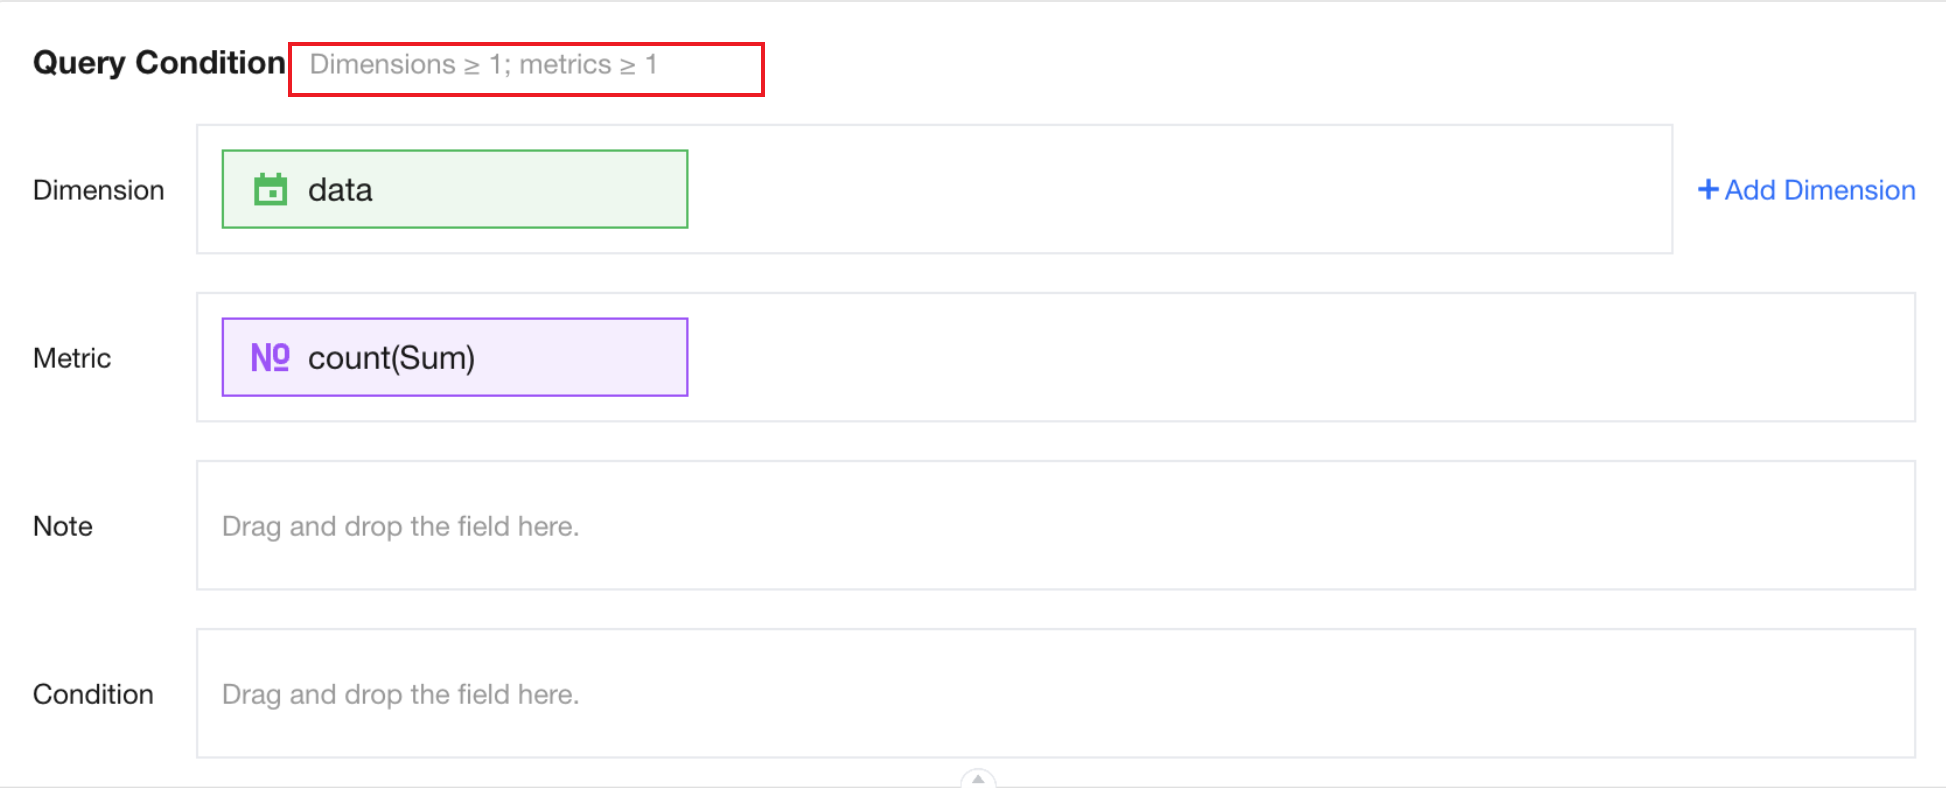
The number of dimension and metric configurations supported by the chart component is displayed in the query condition box. If the dimension and metric fields are not set according to the configuration requirements, the system will report an error.