即席分析介绍
即席分析(ad-hoc query)又称临时分析,是面向数据分析人员提供的一种拖拽式探索分析方式。
区别于仪表式分析,即席分析具有以下特点:
仪表式分析 | 即席分析 |
有明确的业务模型,知道哪些指标能体现业务状况 | 无明确的业务模型,需要分析师通过不断的变更维度和指标,最终摸索出能体现业务状况的维度和指标要素 |
数据和分析模型固定,对“即时”性要求不高 | 即时取数,快速出结果,“即时”性要求较高 |
维度固定,一个图表呈现一个维度模型结论 | 支持使用不同维度去分析一个主题,多个分析维度可进行对比选择最佳方案。 如:对“销量”指标,可通过渠道、部门、客户分类、地区分类等维度一起对比,最终选出最能体现“销量”的影响因素 |
输出可视化图表 | 通过探索输出业务分析模型(维度和指标的组合),可用于仪表式分析 |
版本支持:专业版
通过本文档,您将了解:
即席分析应用场景
操作界面构成
适用场景
场景一:临时数据讨论会
某互联网电商公司,每天有很多用户数据产生,运营部门每天晚上需要做数据复盘,在某天复盘会上,老板发现某品类商品订单忽然增加,按道理不应该出现这种情况,老板要求运营人员现场查下异动原因。
场景难点:
突发事件:无法事先感知,需要运营人员自助分析;
实时计算:因为不知道原因,只能不断猜测尝试,数据结果要能快速计算。
即席分析可通过拖拉拽的方式快速完成非固定模型的自助分析,即拖即出结果。
场景二:问题溯源分析
某智能制造业公司,发现某批次产品良品率下降,但影响良品率的工序、工艺太多,分析毫无思路。
场景难点:
变量多:无法做成统一的分析模型,每道工序都做模型工作量又比较大,且调整起来比较复杂;
对比难:没法多维度进行自动对比,影响分析效率。
即席分析可针对一个主题构建多个 sheet、多种维度组合、维值组合,通过内置的计算能力,可实现快速寻找到多方案的差异点。
场景三:数据效果推理
某电信运营公司,计划推出新套餐,运营团队需要预估套餐的吸引力,及相应的运营风险。
场景难点:
用户标签复杂:每个用户有100多个标签,标签之间涉及组合等;
决策团队关注点不同:运营部门要考虑对渠道、营销的影响;客服部门要考虑这些客群上量后对服务承载能力的影响等。
即席分析可为每个标签组合建立分组,通过多个组合的历史效果对比,推演实际套餐的影响情况;不同的部可定制自己的分析 sheets,用以阐述新业务对自己团队的影响。
界面说明
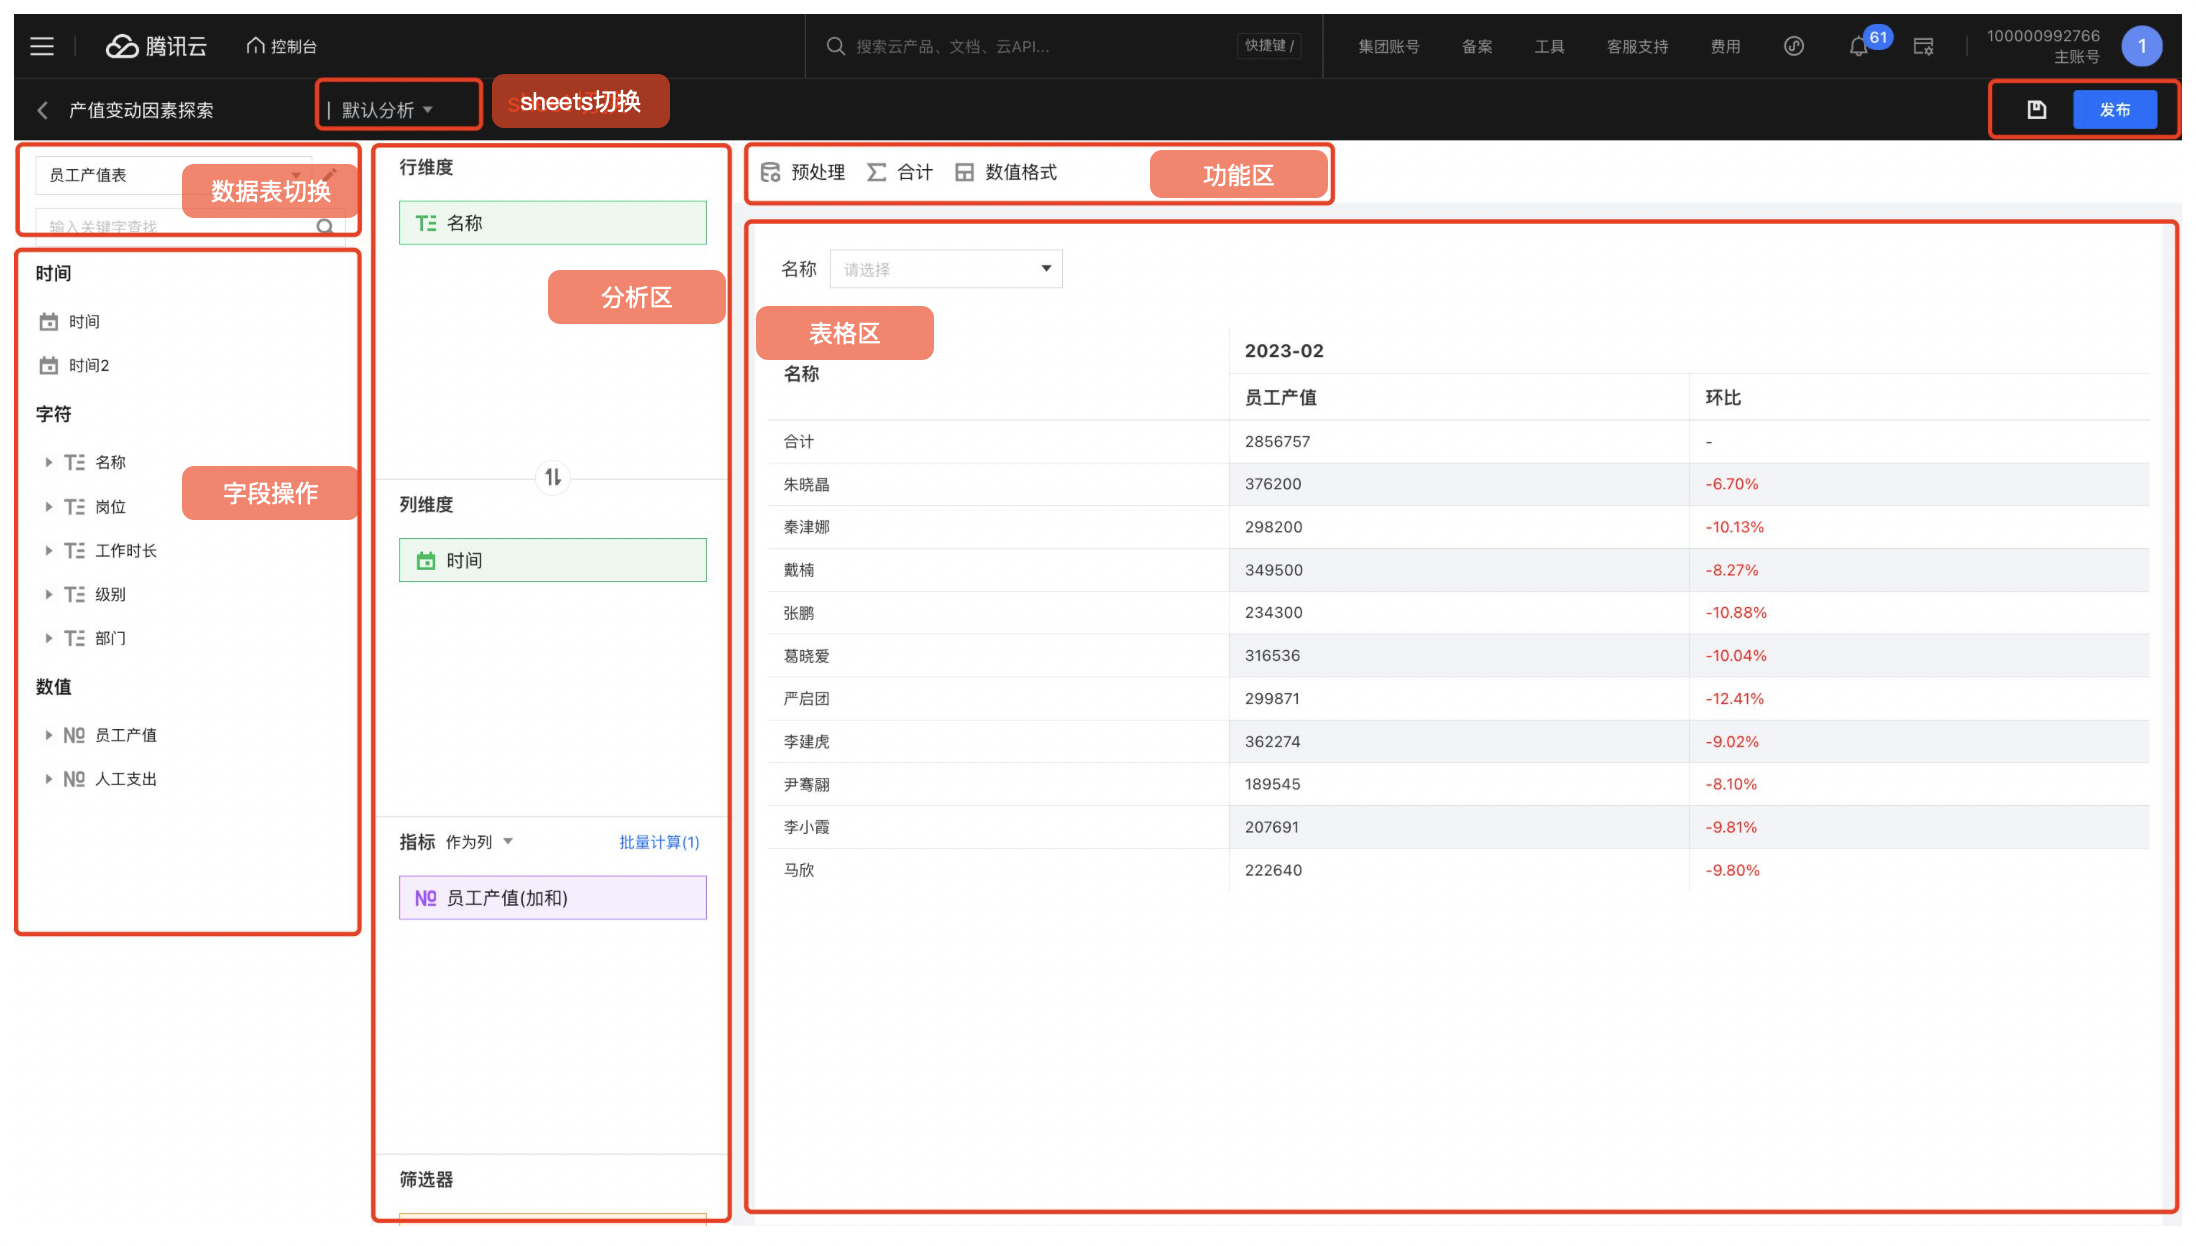
1. sheets 切换
可针对一个主题创建多个 sheets,用以不同维度去分析一个主题。
2. 数据表切换
可快速切换数据表。
3. 字段操作
可对字段进行拖拽到分析区,同时支持字段检索、维值展开和分组。
4. 分析区
字段拖拽到分析区后,可进行聚合、排序、计算等;也可快速创建筛选器对字段进行筛选。
5. 功能区
支持更多的表格定义,例如对数据进行条件筛选预处理、合计配置等。
6. 表格交互区
可展示数据结果,如配置了筛选器,还可进行快速筛选。
7. 发布及保存
发布后,用户可以直接查询结果或者分享报表。
文档反馈