Tencent Cloud Business Intelligence (BI) product includes metric-based charts such as dashboards, mainly used for completion progress, metrics, and trend analysis. It focuses on highlighting business operations and enables rapid determination of business anomalies through metric changes.
Dashboard
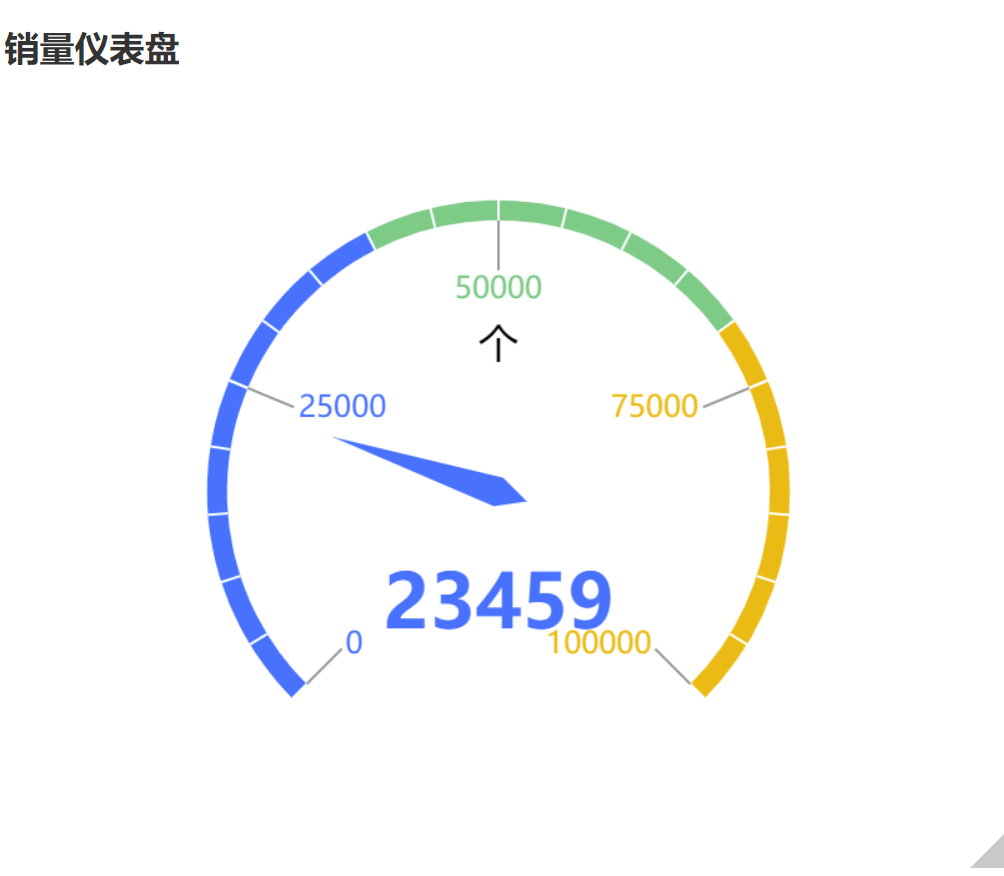
The dashboard is mainly used for statistics on completion progress, metrics, and trends. As shown in the figure below, it displays the completion status of sales data.
Query Condition Settings
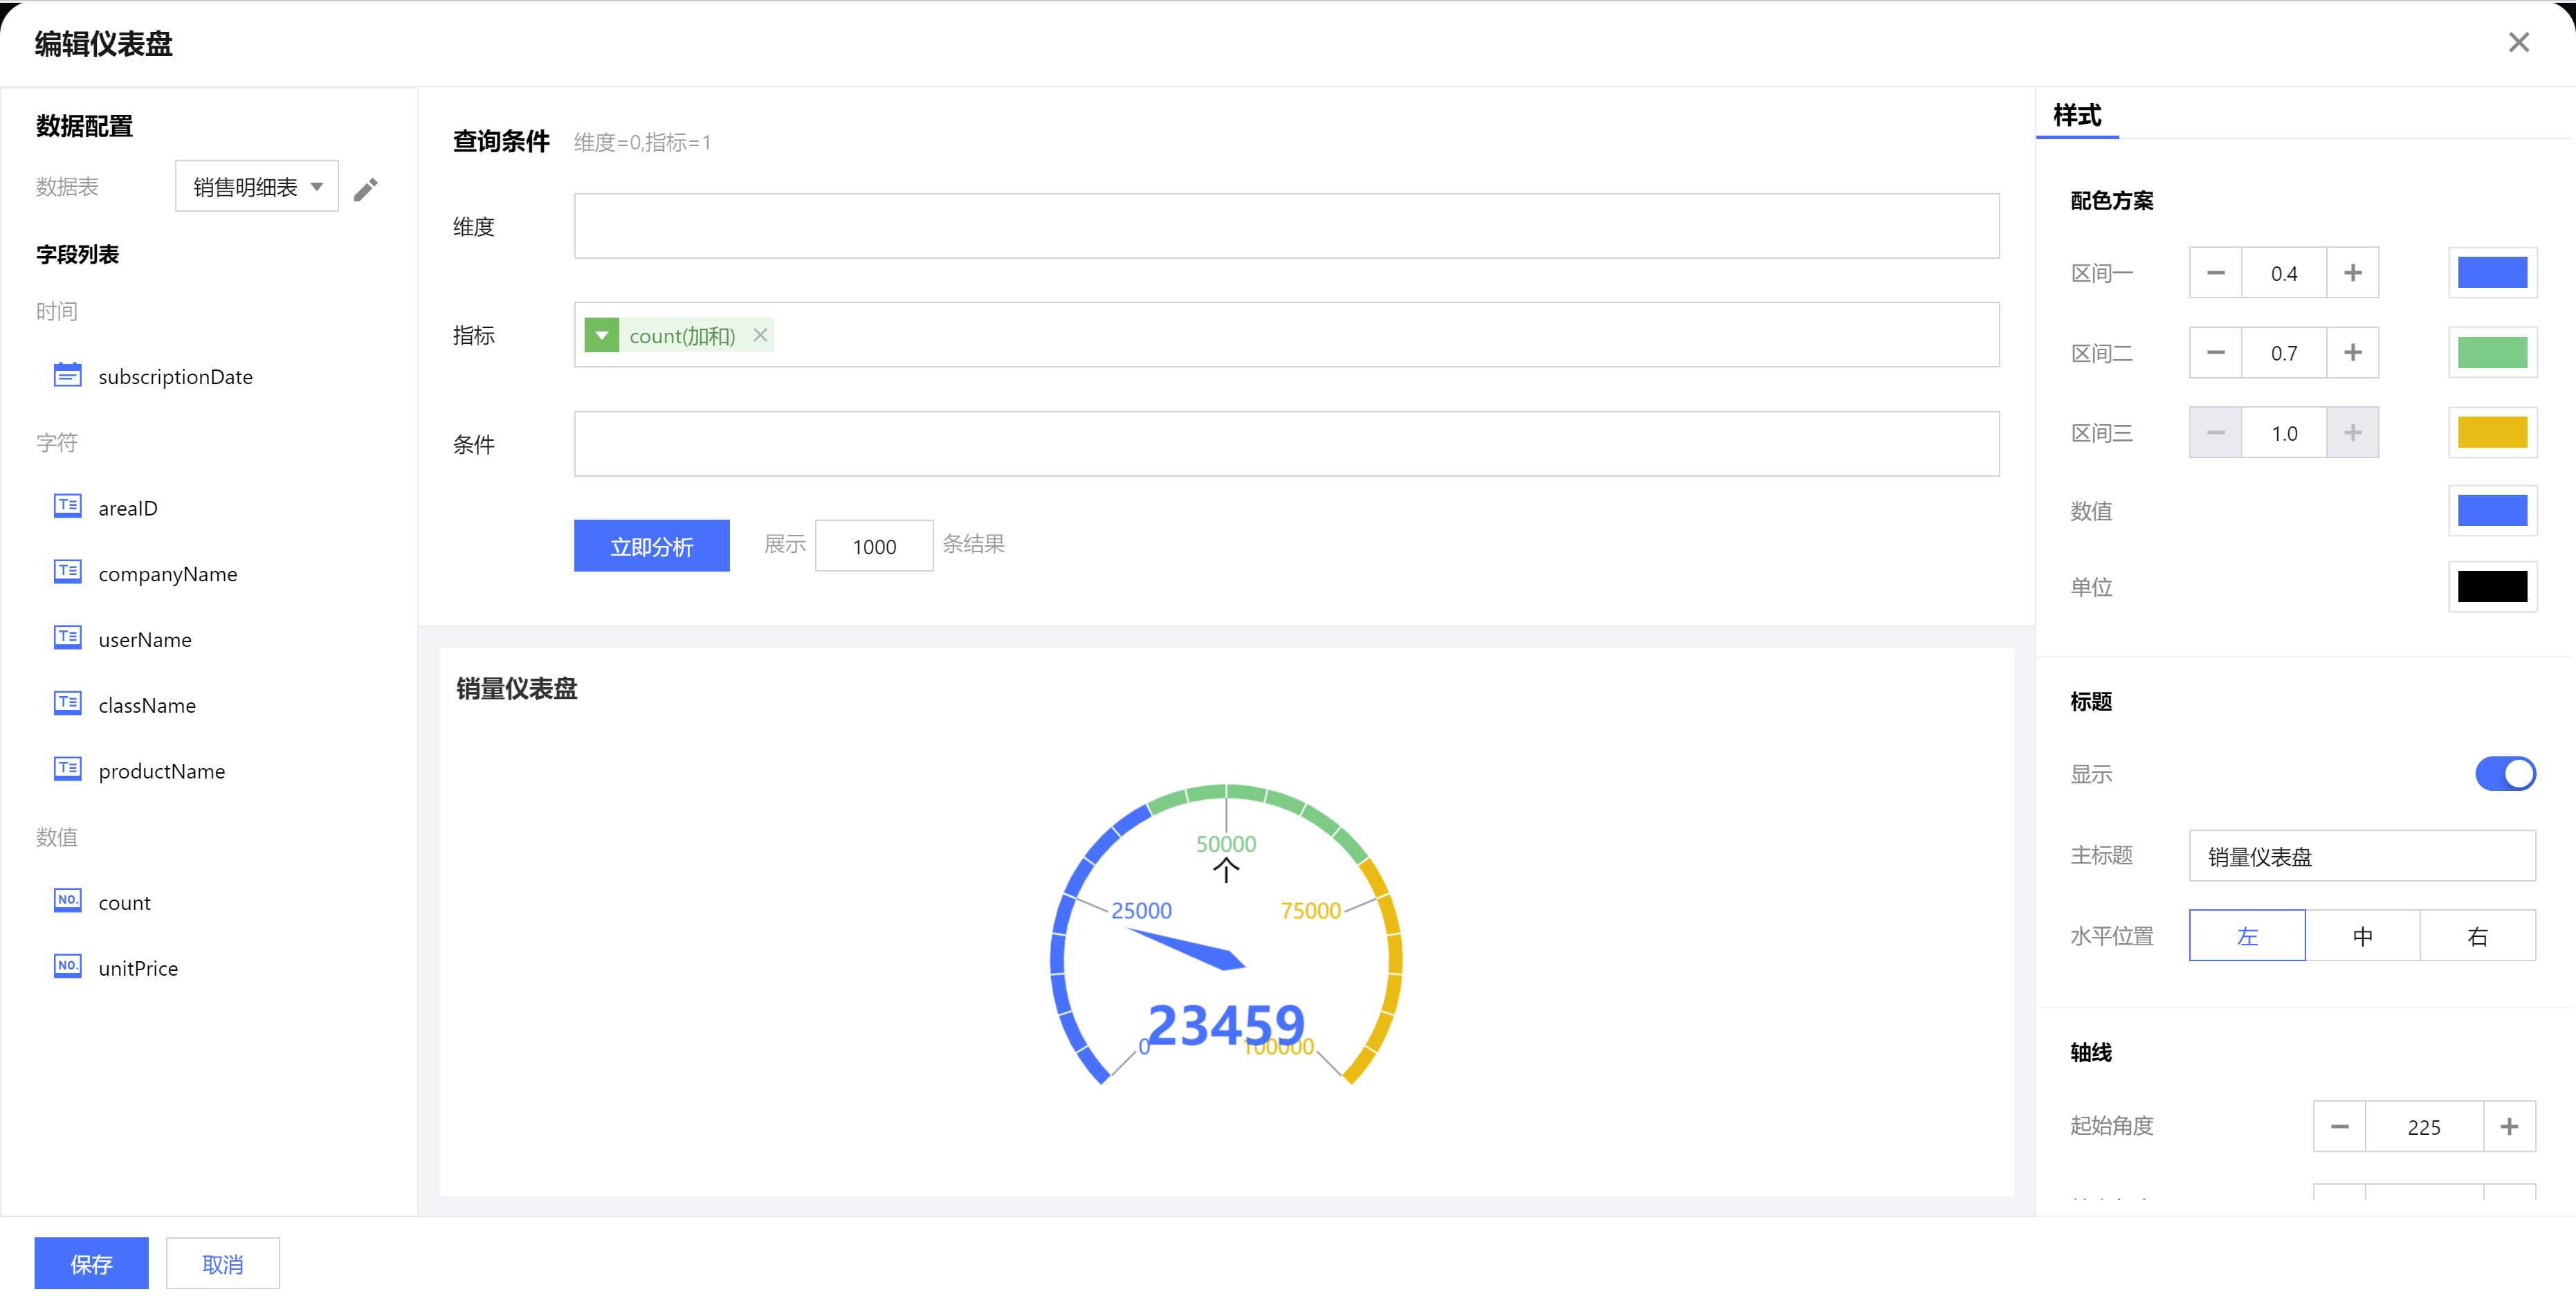
Dimensionality & metric count requirement: metric=1. The condition area allows conditional filtering of data by dragging and dropping time, character, or numeric value fields. The immediate analysis button can trigger the chart's data update display.
Component Style Settings
Dashboard supports the following style settings:
Set a Category
Setting Item
Setup Instructions
Color scheme (including interval settings)
range 1
Set the proportion range of Interval on the axis (starting from the axis starting point)
range 1
Set the color of Interval
range 2
Set the proportion range of Range 2 on the axis (starting from the end of Range 1)
range 2
Set the color of Range 2 (the color at the boundary between Range 1 and Range 2 follows Range 1)
range 3
Fixed as Range 2 end to axis end
range 3
Set the color of Range 3 (The color at the boundary of Range 2 and Range 3 follows Range 2)
Background
Set the card background color
Numerical value
Set the numeric value text color
Unit
Set the unit text color
Title
Display
Enable/Disable Display Chart Title
Main Title
Set Chart Main Title
horizontal position
Set the horizontal position of the title display, such as center, then select "Center".
vertical position
Set the vertical position of the title display, such as bottom, then select "Bottom".
axis
starting angle
Polar coordinate axis as 0 degree, angle of axis starting point
End angle
Angle of axis end point with polar coordinate axis as 0 degree
Minimum value
Dashboard minimum value (starting point scale value)
Maximum value
Dashboard maximum value (end point scale value)
axis width
axis line width
scale
Number of segments (large scale)
Number of segments for axis large scale division
Length (large scale)
Line length (large scale)
Width (large scale)
Line width (large scale)
Number of segments (small scale)
Number of small scale segments per large scale
Length (small scale)
Line length (small scale)
Width (small scale)
Line width (small scale)
Tag
Numerical value
Set tag to display numeric value, enabled by default