How do I view the storage capacity usage of a TencentDB for MySQL instance?
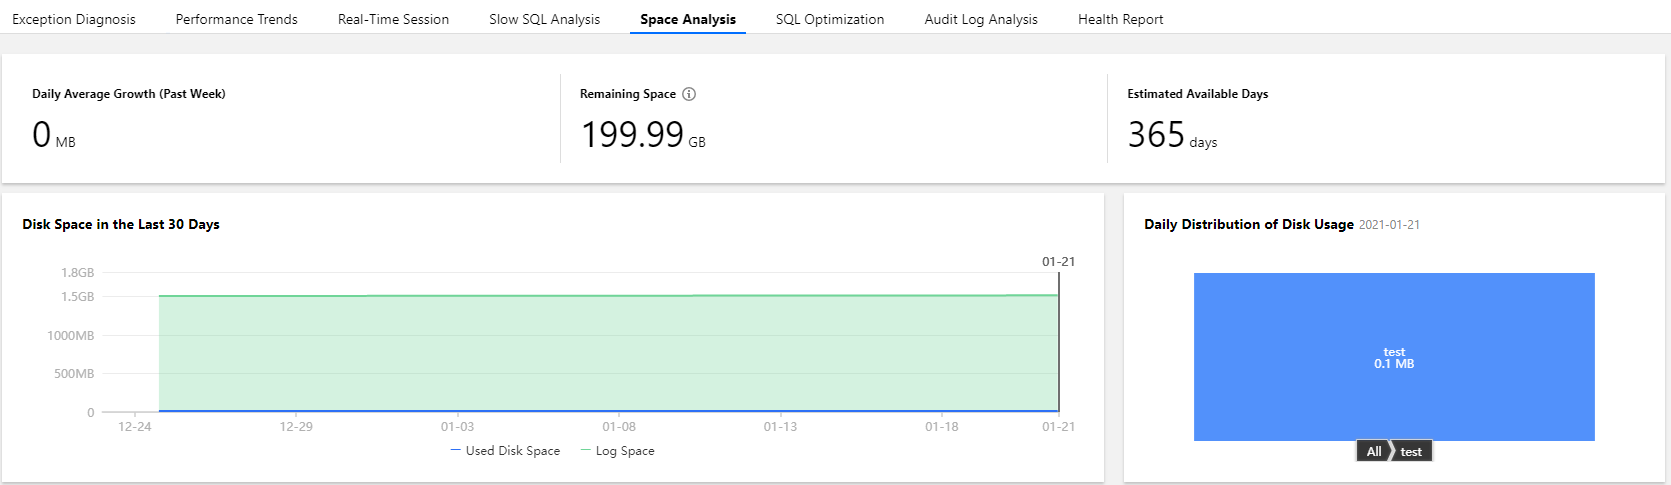
Log in to the DBbrain console and select Performance Optimization on the left sidebar. On the displayed page, select a database type and an instance at the top, and select the Space Analysis tab.
On the Space Analysis tab, you can view the daily average growth in the last week, available disk capacity, the estimated number of available days, and disk capacity usage trends in the last week. In addition, you can view the capacity utilization and fragmentation details of each database table in your instance.
How do I analyze the full SQL execution track of a TencentDB for MySQL instance?
Log in to the DBbrain console and select Performance Optimization on the left sidebar. On the displayed page, select a database type and an instance at the top, and select the Audit Log Analysis tab.
1. Click Create Analysis Task, select a time period, and click OK.
2. Click View SQL Analysis in the task list to access the SQL analysis page.
3. On the SQL analysis page, you can display the view by SQL Type, Host, User, or SQL Code. You can specify a time period to expand the view and view data at specific points in time.
4. Click the SQL template on the target row, and the SQL statement details will be displayed on the right.
On the analysis page, you can view and copy specific SQL statements and optimize them based on the provided optimization suggestion or description.
On the statistics page, you can view the statistical analysis and execution duration track of the specified types of SQL statements by Host, User, and SQL Code.
How do I perform diagnosis or optimization by myself when a TencentDB for MySQL instance is faulty or has an exception?
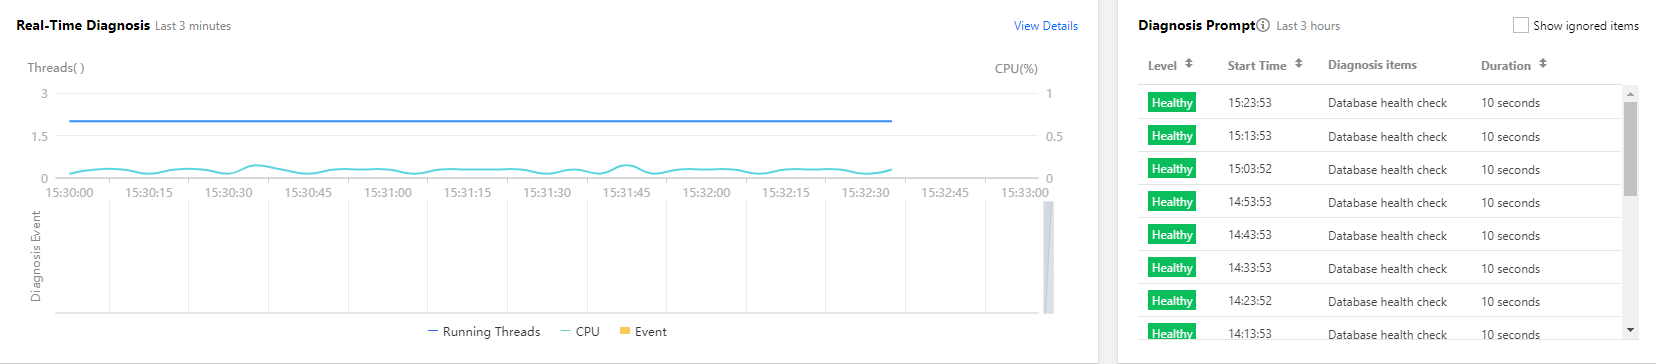
1. Log in to the DBbrain console and select Performance Optimization on the left sidebar. On the displayed page, select a database type and an instance at the top, and select the Exception Diagnosis tab.
2. The Diagnosis Prompt column displays the diagnosis event history, including the health level, start time, diagnosis items, and duration. DBbrain performs health checks on the instance regularly.
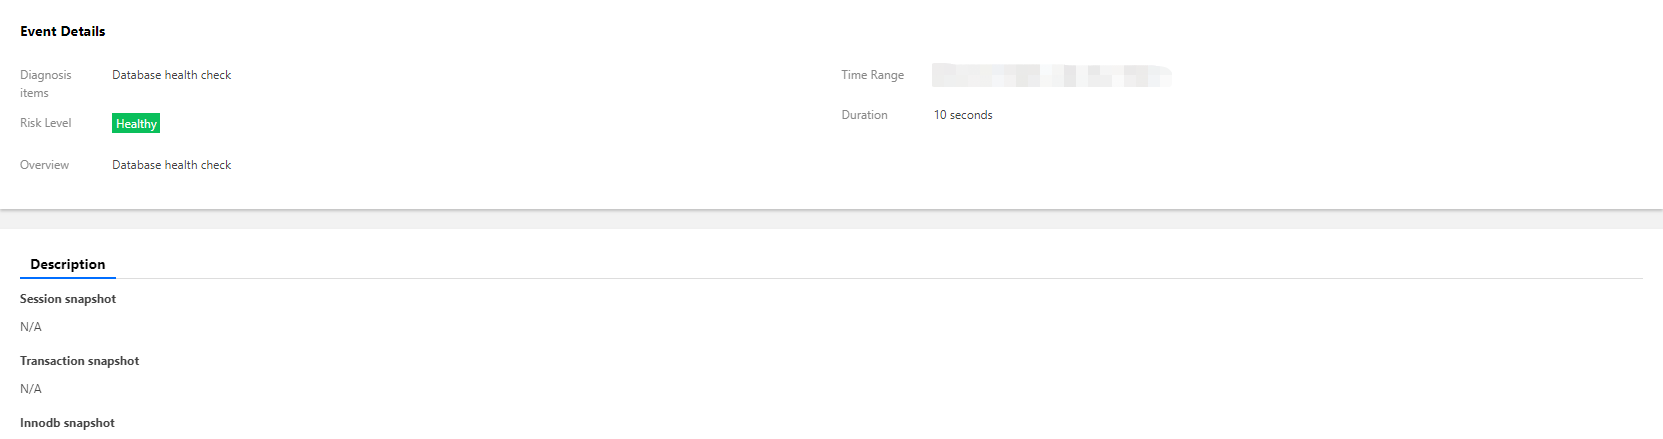
3. You can click View Details or a diagnosis item in the Diagnosis Prompt to access the diagnosis details page. Click a diagnosis event in the view, and its details will be displayed below, including the event overview, symptom description, intelligent analysis, and expert suggestions. Based on the expert suggestions, you can solve the database exception and optimize the instance performance.
How can I receive the TencentDB for MySQL health report regularly?
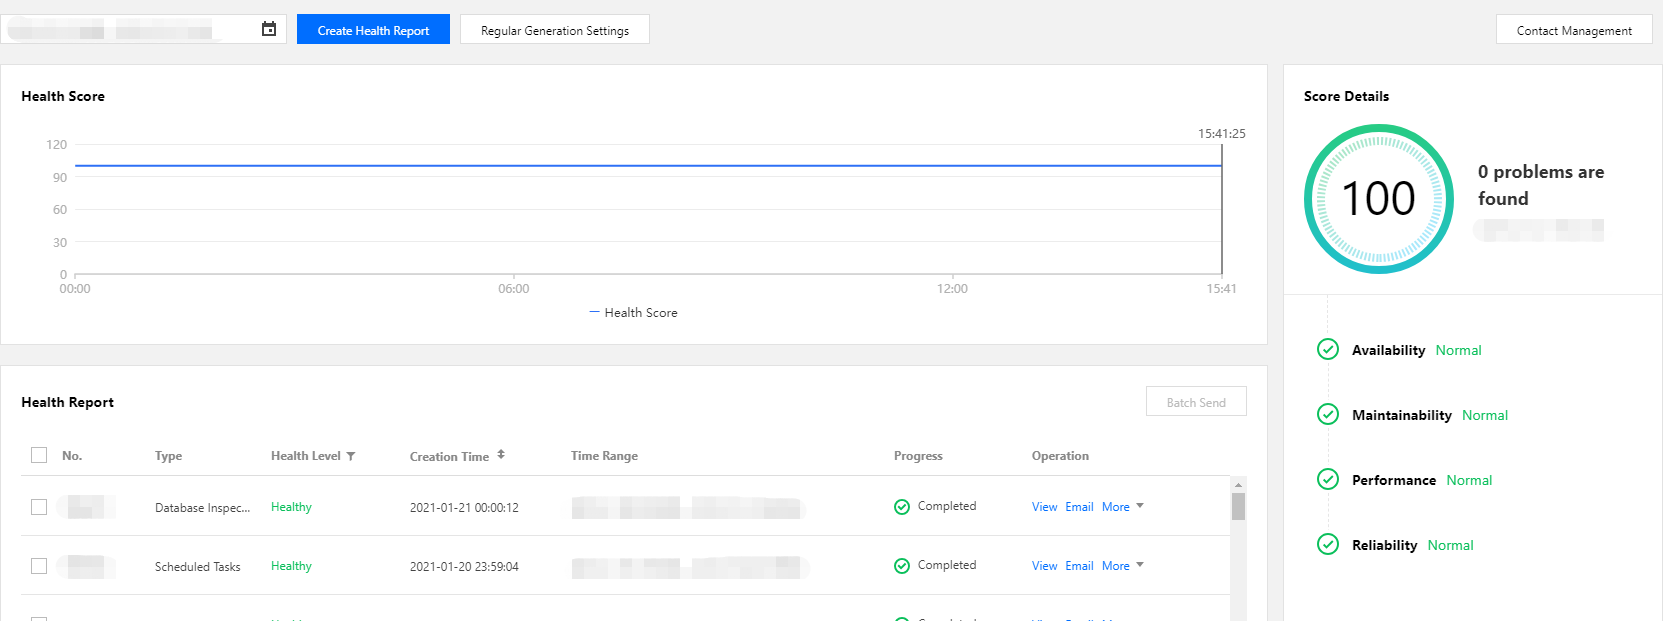
Log in to the DBbrain console and select Performance Optimization on the left sidebar. On the displayed page, select a database type and an instance at the top, and select the Health Report tab. You can view the health score trends and the problem overview for the specified time period.
Select the report time range and click Create Health Report. After the task is completed, you can view or download the health report for the specified time period.
Click Regular Generation Settings to configure the frequency for automatically generating health reports.
How do I view MySQL slow logs and optimize slow queries?
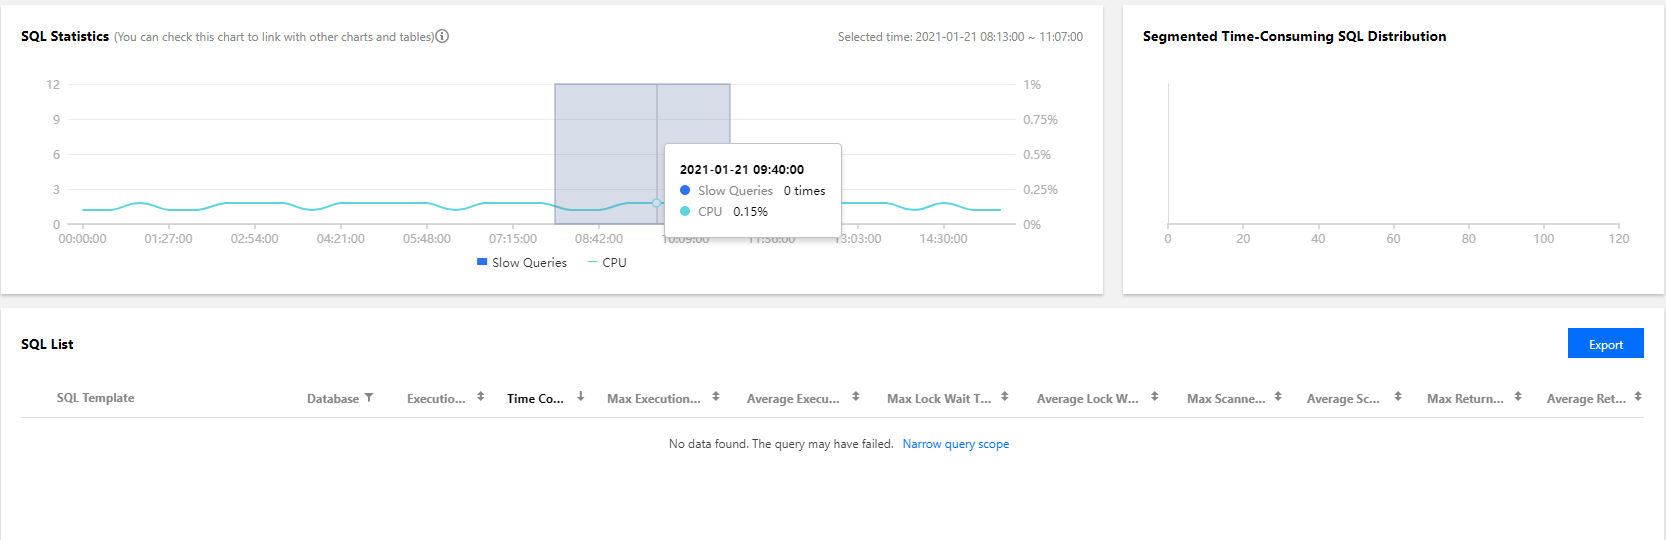
1. Log in to the DBbrain console and select Performance Optimization on the left sidebar. On the displayed page, select a database and an instance at the top, and select the Slow SQL Analysis tab. The SQL Statistics chart displays the number of slow queries and the CPU utilization of the instance.
2. You can click one slow query or select a time period in the SQL Statistics chart, and the aggregated SQL template and execution information will be displayed below. Each column of data can be sorted in ascending or descending order. The Segmented Time-Consuming SQL Distribution chart on the right displays the distribution of the overall SQL statement execution duration for the selected time period.
3. Click an aggregated SQL template and the SQL optimization suggestions and statistics will be displayed on the right. You can rewrite the SQL statement or add appropriate indexes based on the optimization suggestion to improve the SQL statement execution efficiency and database performance.
Why does TencentDB for MySQL crash during task execution?
This is normal because it goes into a status of lock wait as the result of concurrent operations.
Why is Chinese data garbled in TencentDB for MySQL?
When storing data to TencentDB for MySQL, please log in to the console and enter the details page of the instance to view the default character set. When writing the program, set character_set_client, character_set_results, and character_set_connection to the same character sets in the instance; otherwise, garbled text will appear if the data to be stored contains Chinese characters.
For example, the default character set of the TencentDB instance is UTF-8. When writing a program to connect to the instance, you need to execute the following statements before storing Chinese data:
SET NAMES 'utf8';
What are the common reasons and solutions for issues where the maximum number of connections to TencentDB for MySQL is reached?
There are too many sleeping threads. We recommend lowering the values of wait_timeout and interactive_timeout in the console.
The slow logs have heaped up. The long_query_time parameter is 10 seconds by default. We recommend changing it to 1-2 seconds and then observe slow logs.
If there are few sleeping threads and no slow logs heaped up, we recommend increasing the value of the max_connections parameter in the console.
What are the common reasons and solutions for a high utilization of CPU by TencentDB for MySQL?
Slow logs have heaped up. Please check the monitoring data of slow logs and full table scans, then conduct analysis and optimization by referring to slow logs (which can be downloaded in the console). If no slow logs are found and only full table scans are monitored, change the value of long_query_time to 1-2 seconds and then analyze slow logs after using TencentDB for MySQL for a while.
If no slow logs heaped up, please check the monitoring data of memory utilization. If it is much higher than the instance specification and the disk reads/writes increase significantly, there is a bottleneck in the memory, and we recommend upgrading the memory.
Which monitoring metrics of the instance should I usually pay attention to?
CPU utilization, memory utilization, and disk space utilization. You can configure alarms as needed, and when you receive alarms, you can take corresponding measures to resolve them.
How do I get the capacity statistics of multiple instances?
Log in to the DBbrain console and view the summary instance information on the Instance Overview page.
Use the getmonitordata API to query the capacity statistics of multiple instances.