Using Tag and TopN Features to Automatically Monitor Cloud Resources in Batches
Download
Focus Mode
Font Size
Last updated: 2024-01-27 17:45:42
Feature Overview
Tencent Cloud Tag: tag is a resource management tool provided by Tencent Cloud. You can use tags to categorize, search for, and aggregate Tencent Cloud resources. A tag has two parts: tag key and tag value. You can create a tag by defining its tag key and tag value based on conditions such as the resource usage and resource owner.
Use tags in the dashboard: the dashboard allows you to bind tags to the data sources of a chart, and the monitoring curves will be updated automatically as the number of the associated instances changes. This enables you to bind tags to instances in batches quickly and dynamically, thus greatly reducing the costs of chart creation and modification.
TopN feature: it updates the monitoring curves automatically when you increase or decrease the number of instances and migrate instances, thus automatically monitoring the loads of machines.
Use Limits
The dashboard tag feature currently is only supported for CVM - basic monitoring and will be supported for more Tencent Cloud services in the future.
Each resource can be associated with up to 50 different tag keys.
Each user can create up to 1,000 tag keys.
Each tag key can be associated with up to 1,000 tag values.
Purpose
This document describes how to use the tag, chart grouping, and TopN features of the dashboard to achieve the automated OPS of resources and the automated monitoring of the loads of machines in batches by taking "CVM – basic monitoring – CPU utilization" as an example.
Background
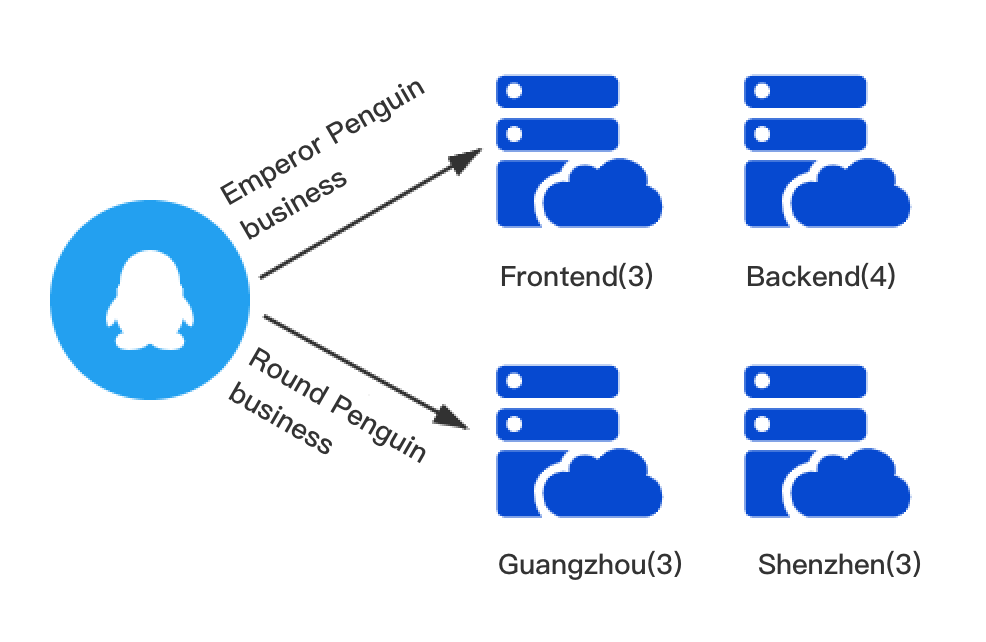
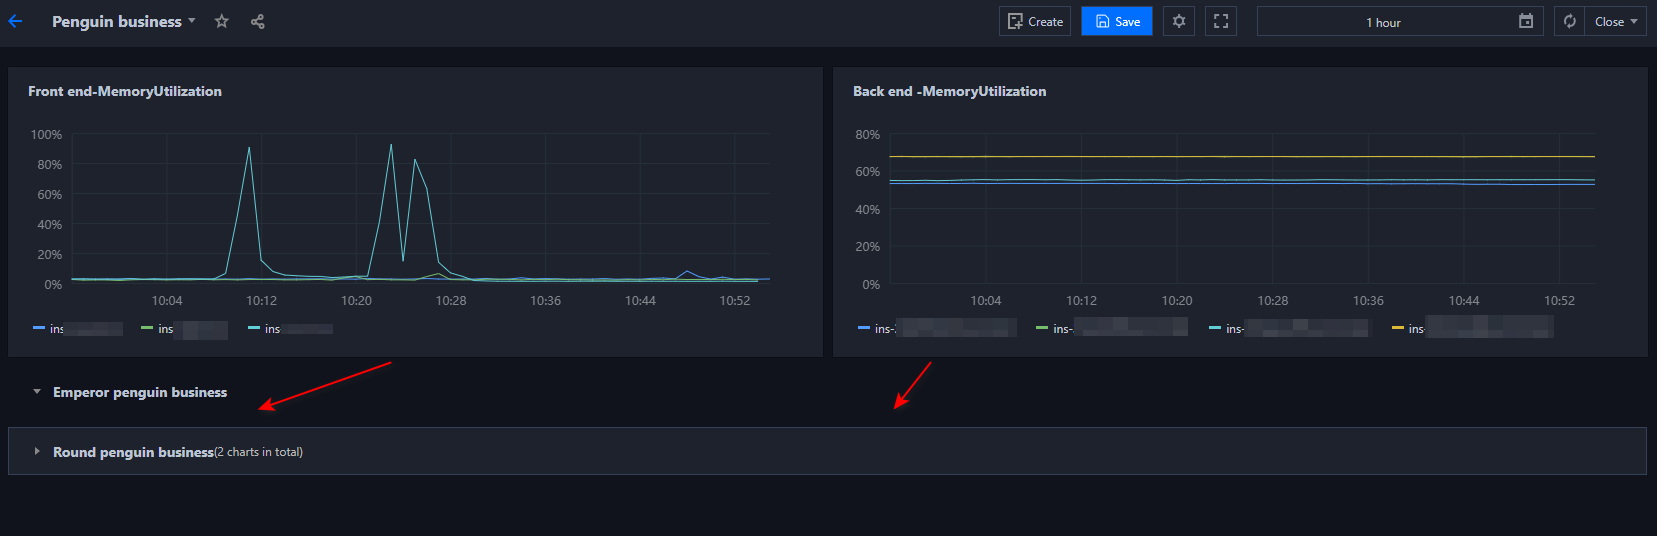
As shown below, two businesses run under the Penguin project: the Emperor Penguin business and the Round Penguin business.
The Emperor Penguin business involves 7 servers, with 3 on the frontend and 4 on the backend.
The Round Penguin business involves 6 servers, with 3 in Guangzhou and 3 in Shenzhen.
2. On the tag list page, click Create and enter the tag key and tag value (which can be left empty).
3. After entering the information, click OK.
4. Create four tags ("Emperor Penguin - Frontend", "Emperor Penguin - Backend", "Round Penguin - Guangzhou", and "Round Penguin - Shenzhen") as instructed in steps 2 and 3.
Step 2. Associate instances
1. Go to the instance list page in the CVM console.
2. On the instance list page, find the instances of the Emperor Penguin and Round Penguin businesses and select More > Instance Settings > Edit Tag in the Operation column.
3. In the tag editing window, associate the instance with the corresponding tag key and value and click OK.
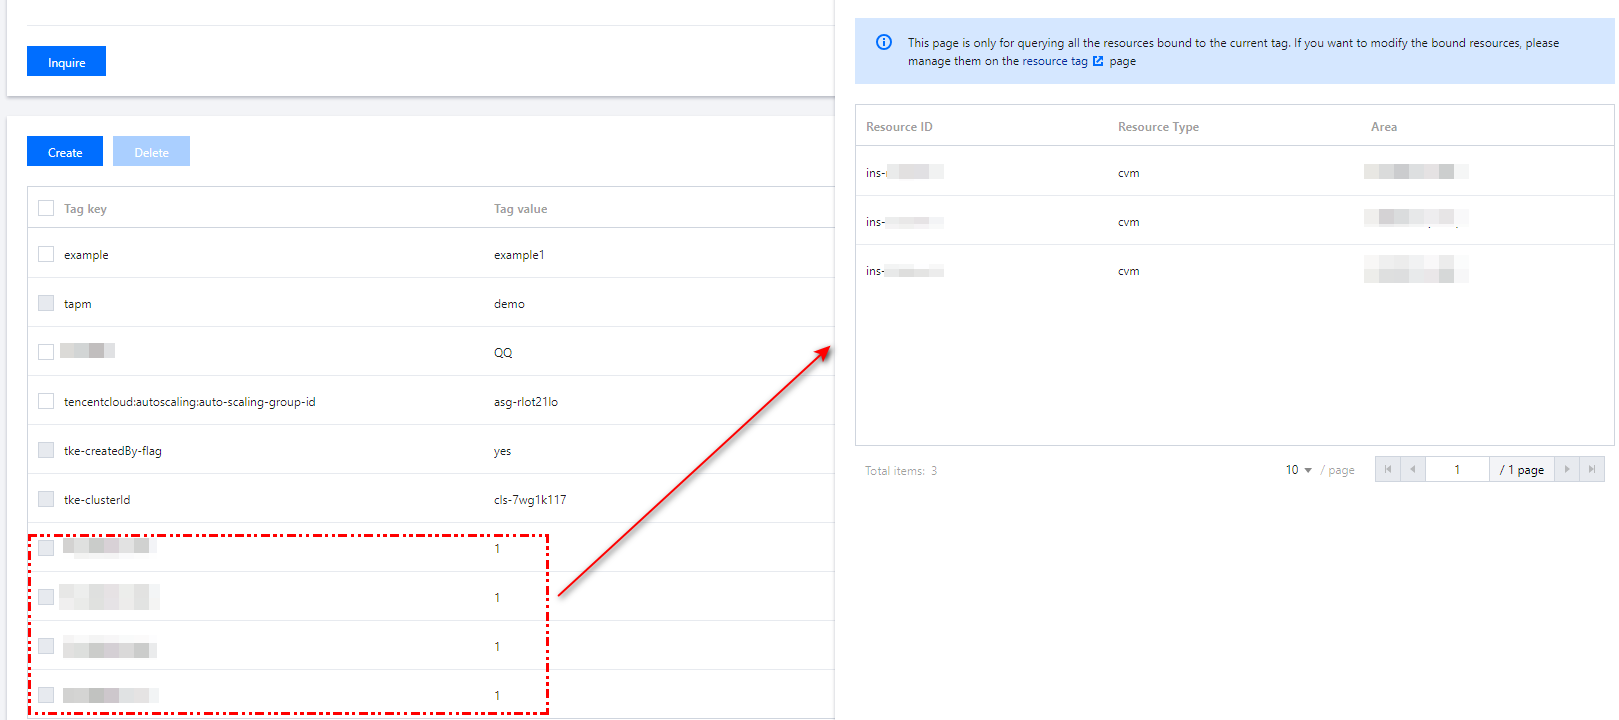
4. Associate all instances of the Emperor Penguin and Round Penguin businesses with the corresponding tags as instructed in steps 2 and 3 as shown below:
Step 3. Create a dashboard and chart group
1. Create a dashboard named Penguin Project as instructed in Creating a Dashboard.
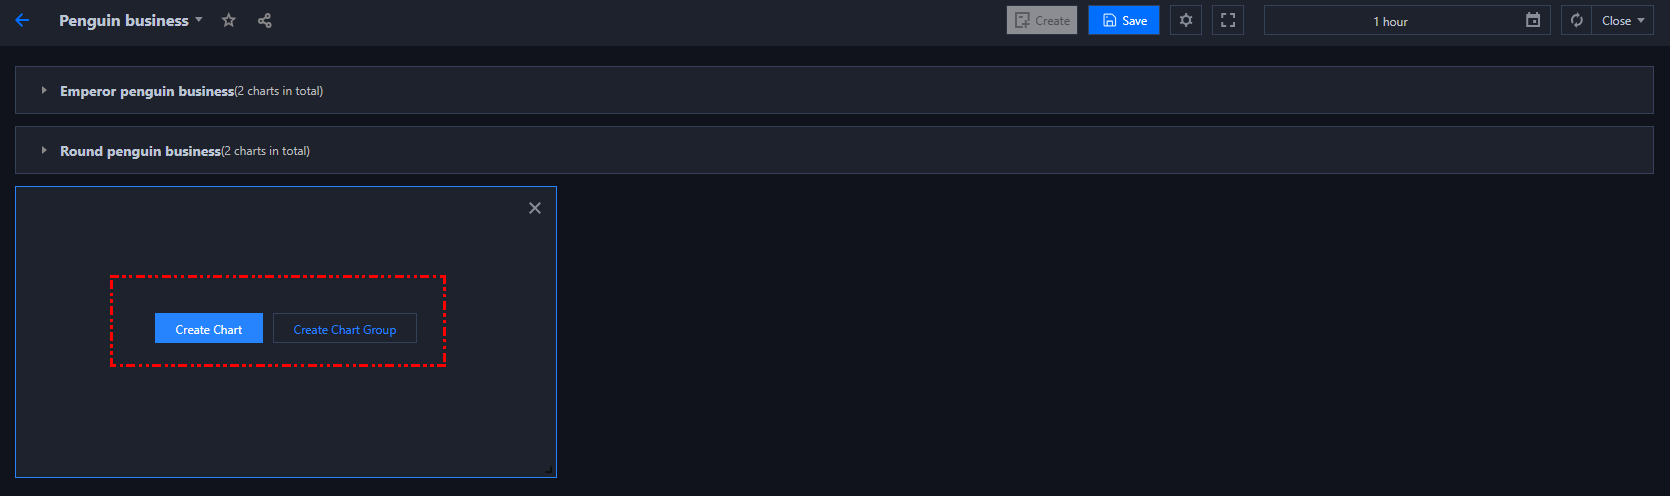
2. Create a chart group. As shown below, click the creation icon in the top-right corner of the dashboard, then click Create Chart Group and the settings icon next to the chart group name. Enter the chart group name and click OK. In this document, create two chart groups for the two businesses, respectively.
Step 4. Create a monitoring chart and bind tags
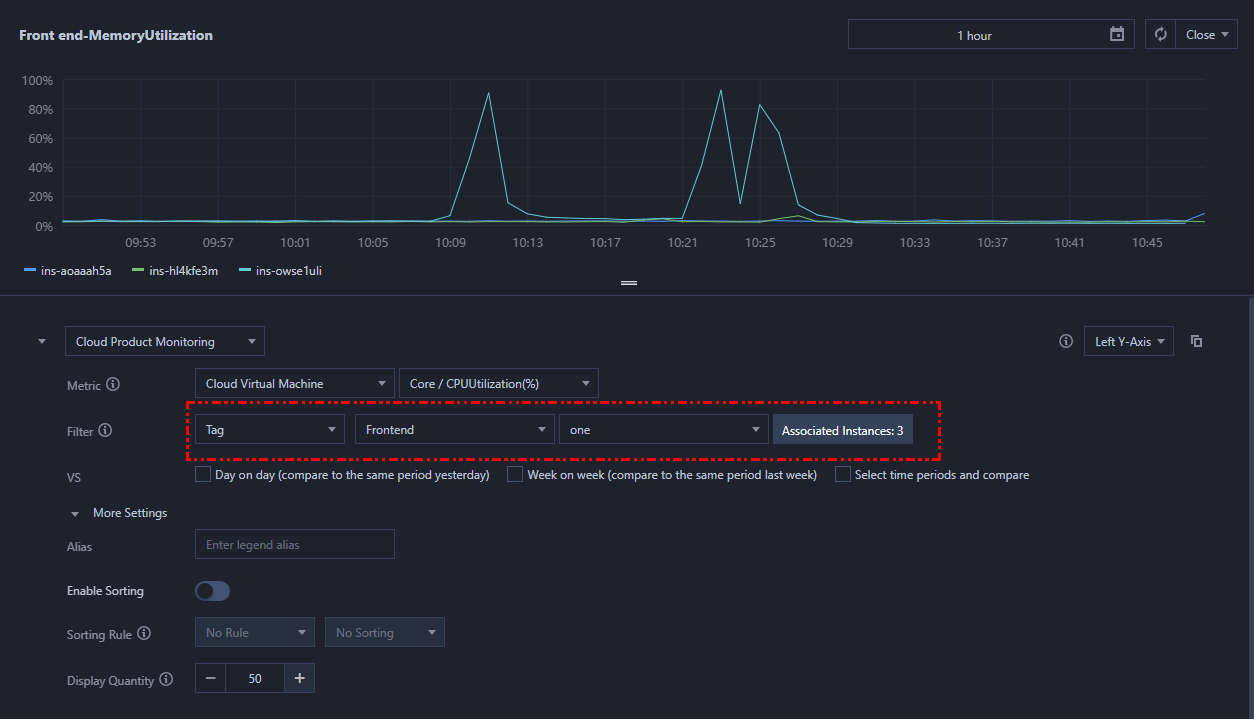
1. Click Create Chart and configure the chart as follows:
Chart Name: you can enter the Chart Name in the Basic Information section of the Chart Configuration.
Metric: select the Tencent Cloud service type and the metric to be monitored. Here, CVM - basic monitoring and the CPU utilization metric are used as an example.
Filter: you can filter the data sources to be monitored. Here, tag is selected as the filter type, and different tag keys and values are bound to different charts.
2. After the chart is created successfully, drag it to the desired chart group and adjust its size as needed.
3. You can create monitoring charts for the 3 frontend CVM instances and 4 backend CVM instances of the Emperor Penguin business and for the 3 CVM instances of the Round Penguin business in Guangzhou and 3 CVM instances of the Round Penguin business in Shenzhen as instructed in steps 2 and 3. Then, drag and drop them to the corresponding group as shown below:
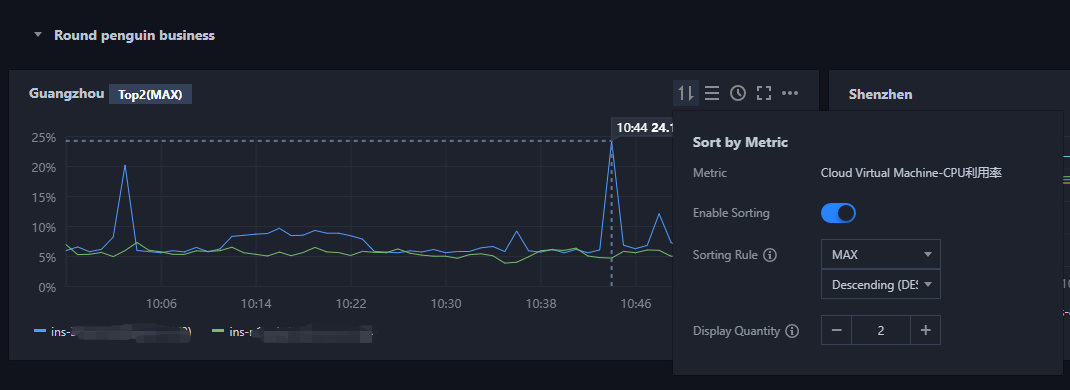
Step 5. Enable the TopN feature
When analyzing the charts, you can click
in the charts to enable the TopN feature and change the sorting rule and display quantity, making it easier for you to view the loads of machines in batches. The chart below only shows the top 2 backend instances of the Emperor Penguin business: