Pushgateway is a crucial member of the Prometheus ecosystem. It allows any client to push custom monitoring metrics that comply with the standards, which are then collected and monitored by Prometheus. Prometheus Pushgateway is used to receive metric data from short-term tasks, which cannot be directly monitored through the service discovery monitoring system. Pushgateway allows temporary jobs (such as batch processing jobs) to push metrics to a central location, without directly exposing their metrics. Such data can be pulled and persistently stored by the Prometheus server.
2. In the left sidebar, click Managed Service for Prometheus.
3. Select the corresponding Prometheus instance from the instance list.
4. On the instance details page, click Data Collection> Integration Center.
5. Search for Pushgateway in the integration center, and click it to pop up the installation window.
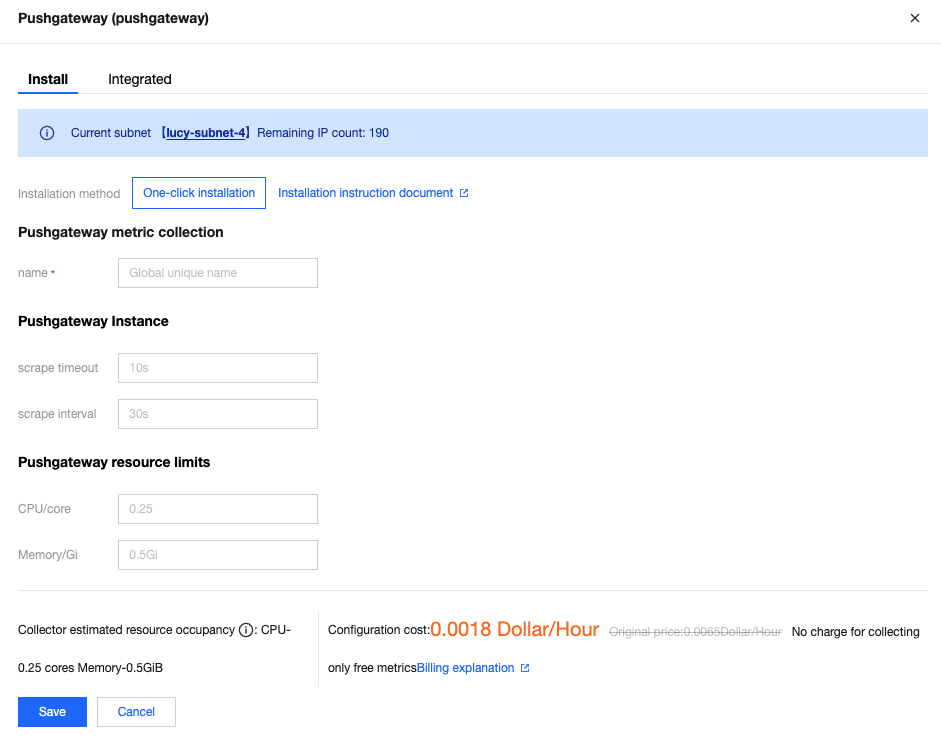
6. On the Installation tab of the pop-up window, fill in the relevant information as prompted and click Save.
Configuration Note
Parameters
Description
name
Exporter name, which should meet the following requirements:
The name should be unique.
The name should conform to the following regular expression: '^[a-z0-9]([-a-z0-9]*[a-z0-9])?(\\.[a-z0-9]([-a-z0-9]*[a-z0-9])?)*$'.
scrape timeout
Pushgateway collection timeout, which is in time format and cannot be greater than the collection interval.
scrape interval
Pushgateway collection interval, which is in time format.
CPU/core
Number limit of Pushgateway CPU cores, which cannot be greater than 64.
Memory/Gi
Pushgateway memory limit. During the configuration, the value should include the unit Gi and cannot be greater than 512 Gi.
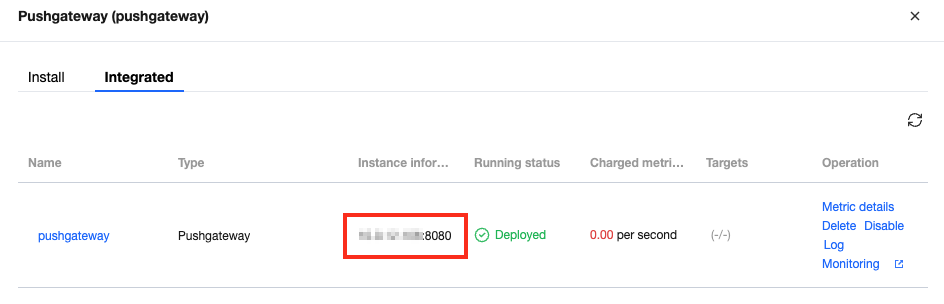
7. Obtain Pushgateway address information from the integrated list.
Search for the required CAM policy as needed, and click to complete policy association.
Data Push
After Pushgateway is installed successfully, you can obtain the address for interaction and use this address to perform related operations on Pushgateway.
1. Obtain the component status:
curl -X GET http://10.*.*.*:8080/api/v1/status
2. Add a single data record to {job="some_job"}:
curl --location --request POST '10.*.*.*:8080/metrics/job/some_job'\\
--header 'Content-Type: text/plain'\\
--data 'some_metric 3.14
'
3. Add complex data to a specific instance:
curl --location --request PUT '10.*.*.*:8080/metrics/job/some_job/instance/some_instance'\\
--header 'Content-Type: text/plain'\\
--data '# TYPE some_metric counter
some_metric{label="val1"} 42
# TYPE another_metric gauge
# HELP another_metric Just an example.
another_metric 2398.283
'
4. Delete all data under {job="some_job",instance="some_instance"}:
The Prometheus instance has been bound to a Grafana instance.
Directions
1. Log in to the TMP Console and select the corresponding Prometheus instance to enter its management page.
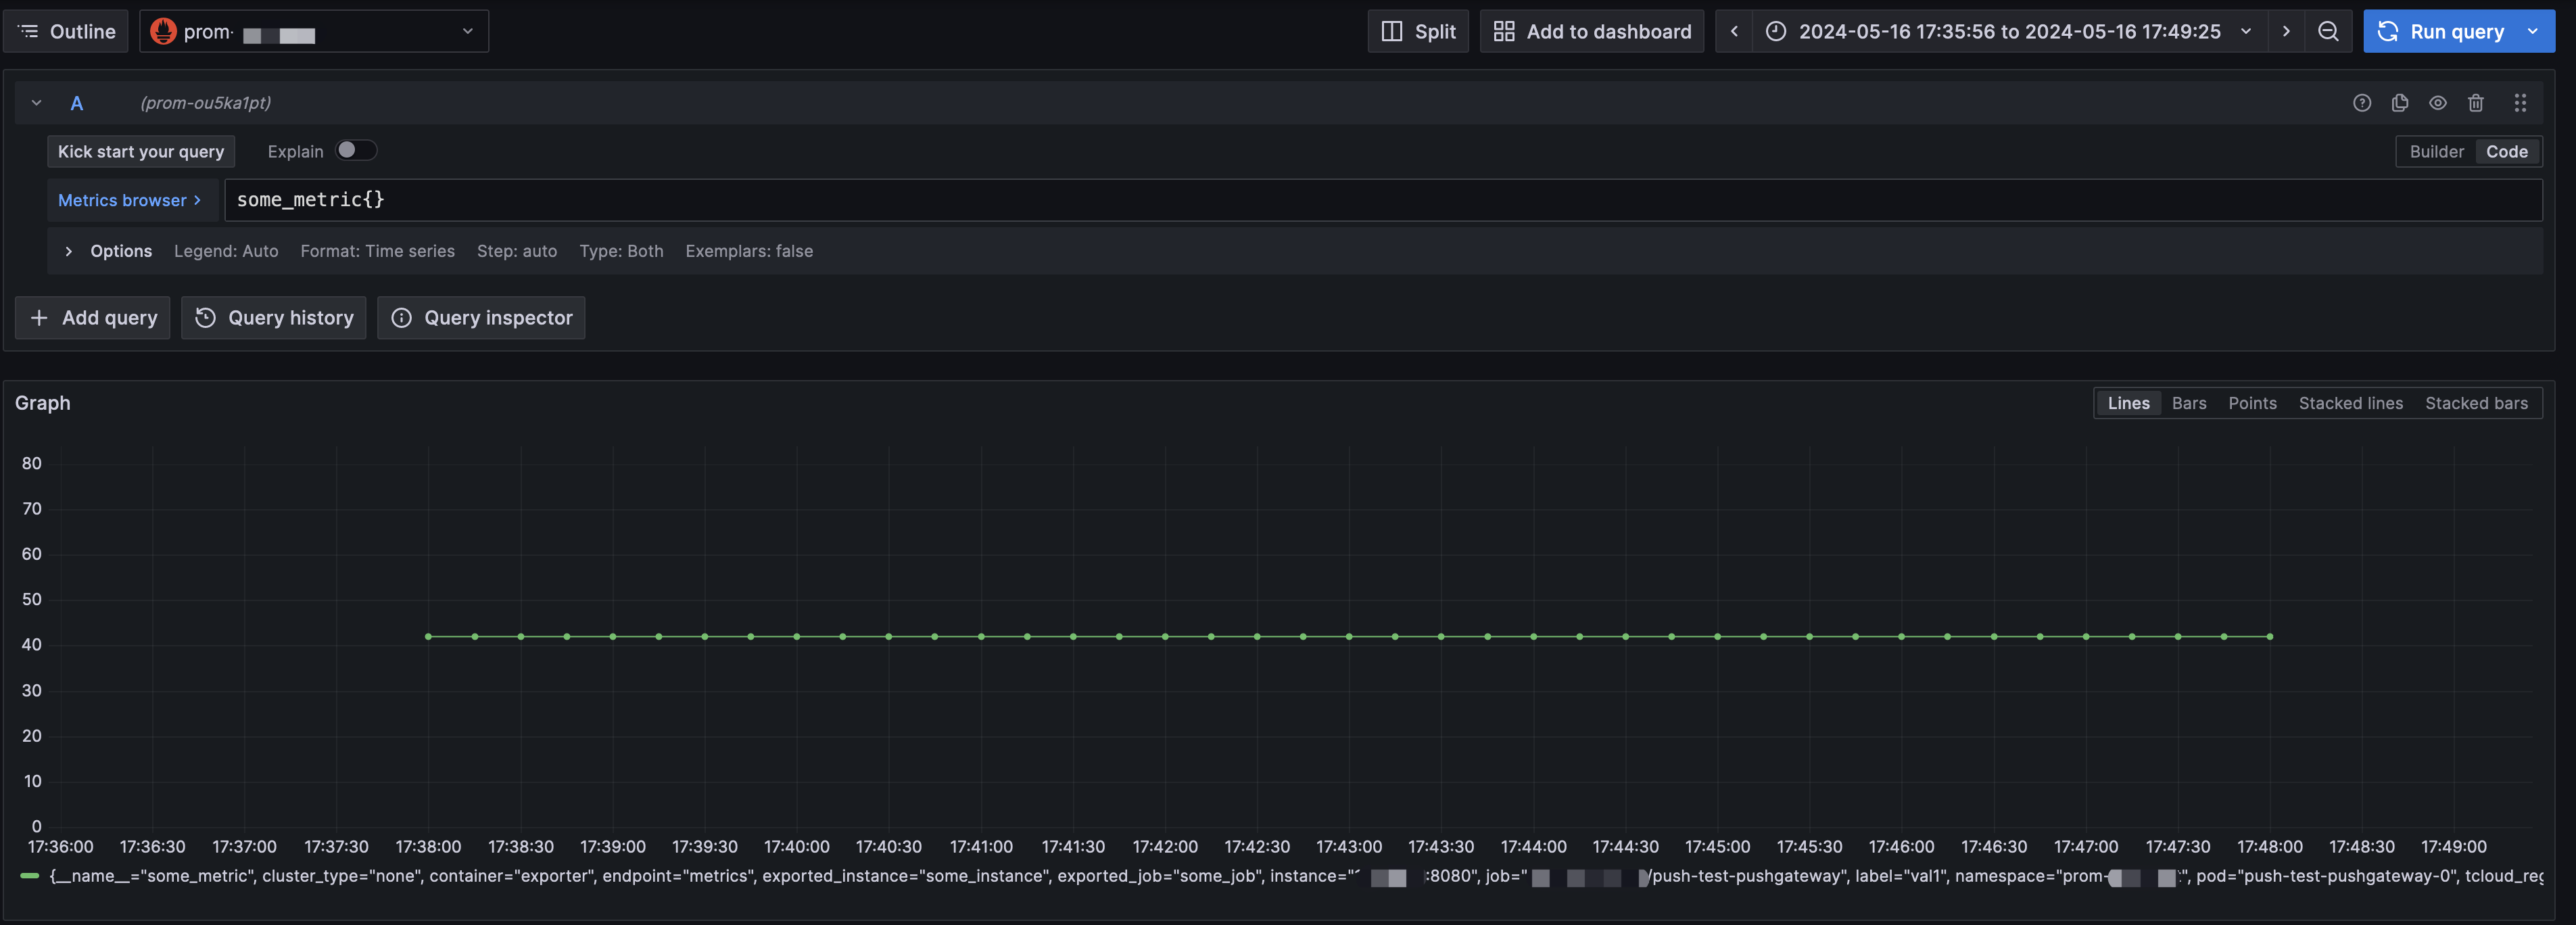
2. On the Basic Info page of the instance, find the bound Grafana address, open it, and log in to Grafana. Then, you can view the pushed metrics in Explore or create a panel to view metrics:
Search for the required CAM policy as needed, and click to complete policy association.