When you have multiple related scenarios that need to run in one script, you can configure multiple JMeter thread groups, with each thread group configured with a user scenario.
JMeter supports both parallel running and serial running of thread groups.
Running JMeter Thread Groups in Parallel or Serially
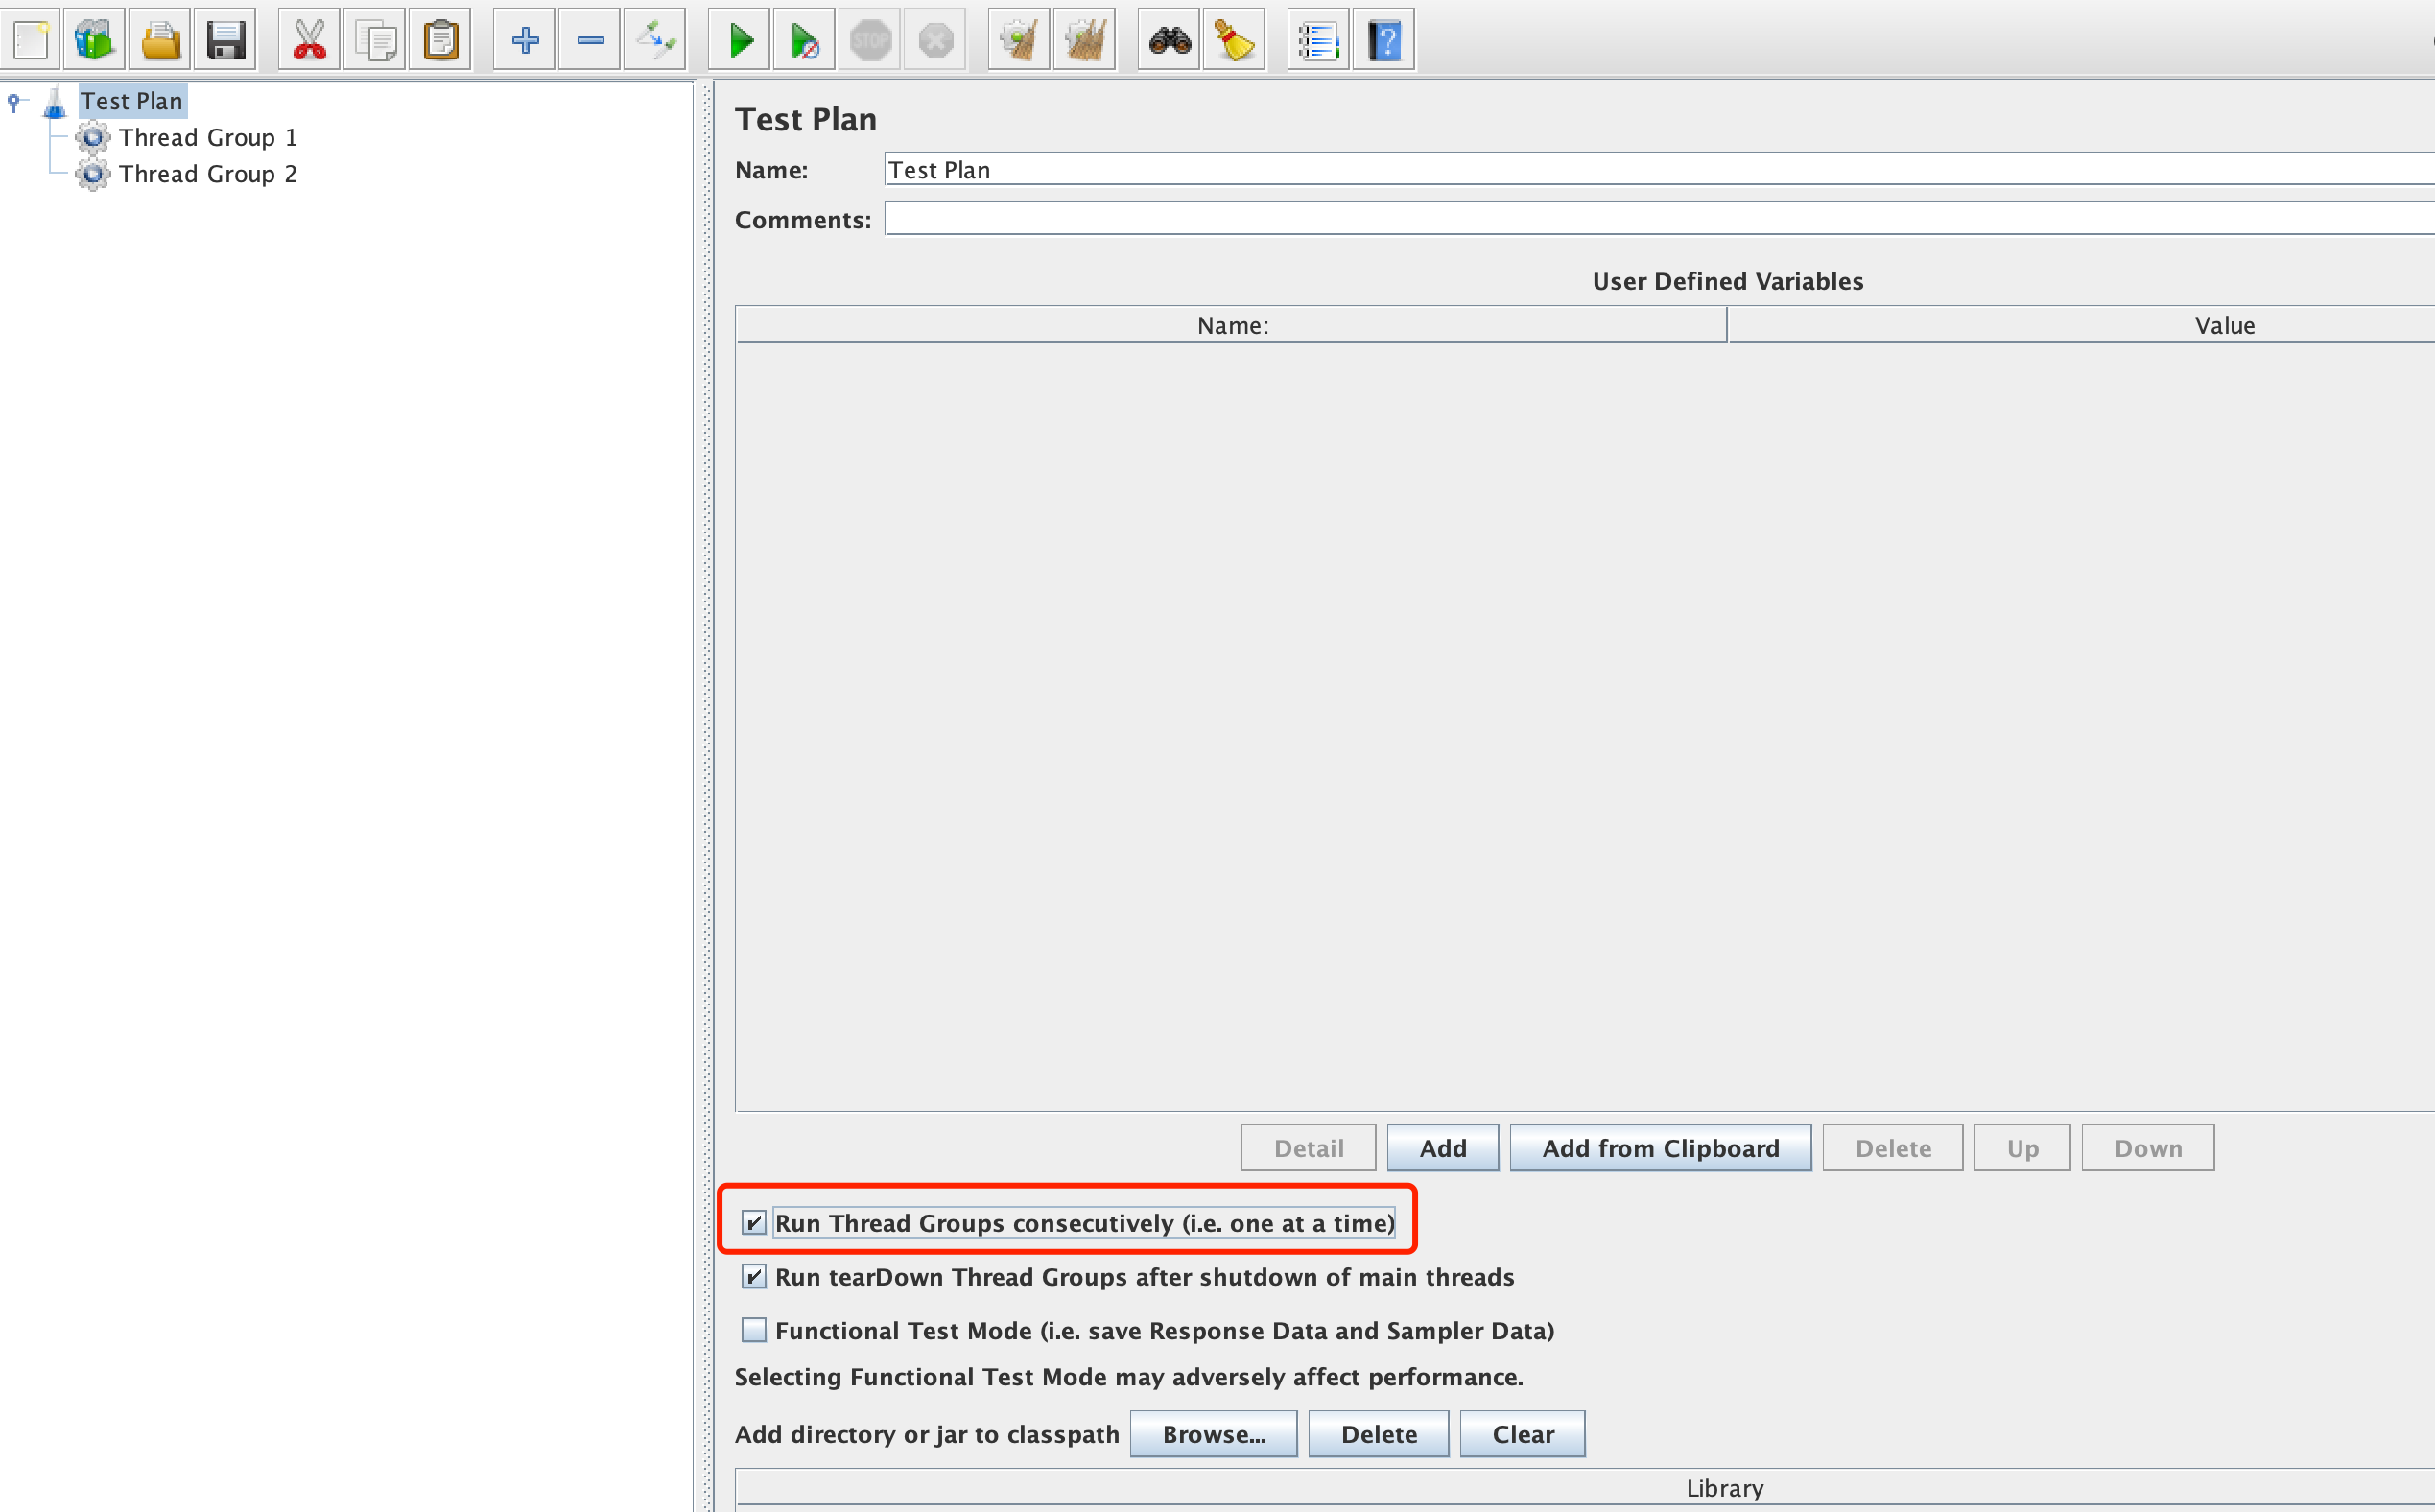
In the test plan, you can set parallel or serial running of multiple thread groups.
Serial running of thread groups: Select Run Thread Groups consecutively (i.e. one at a time). Serial running of thread groups means that when there are multiple thread groups in the test plan, the next thread group will be executed only after the previous one is completed.
Parallel running of thread groups: Do not select Run Thread Groups consecutively (i.e. one at a time). Parallel running of thread groups means that when there are multiple thread groups in the test plan, multiple thread groups run simultaneously.
Setting the Number of Loops for Threads in JMeter
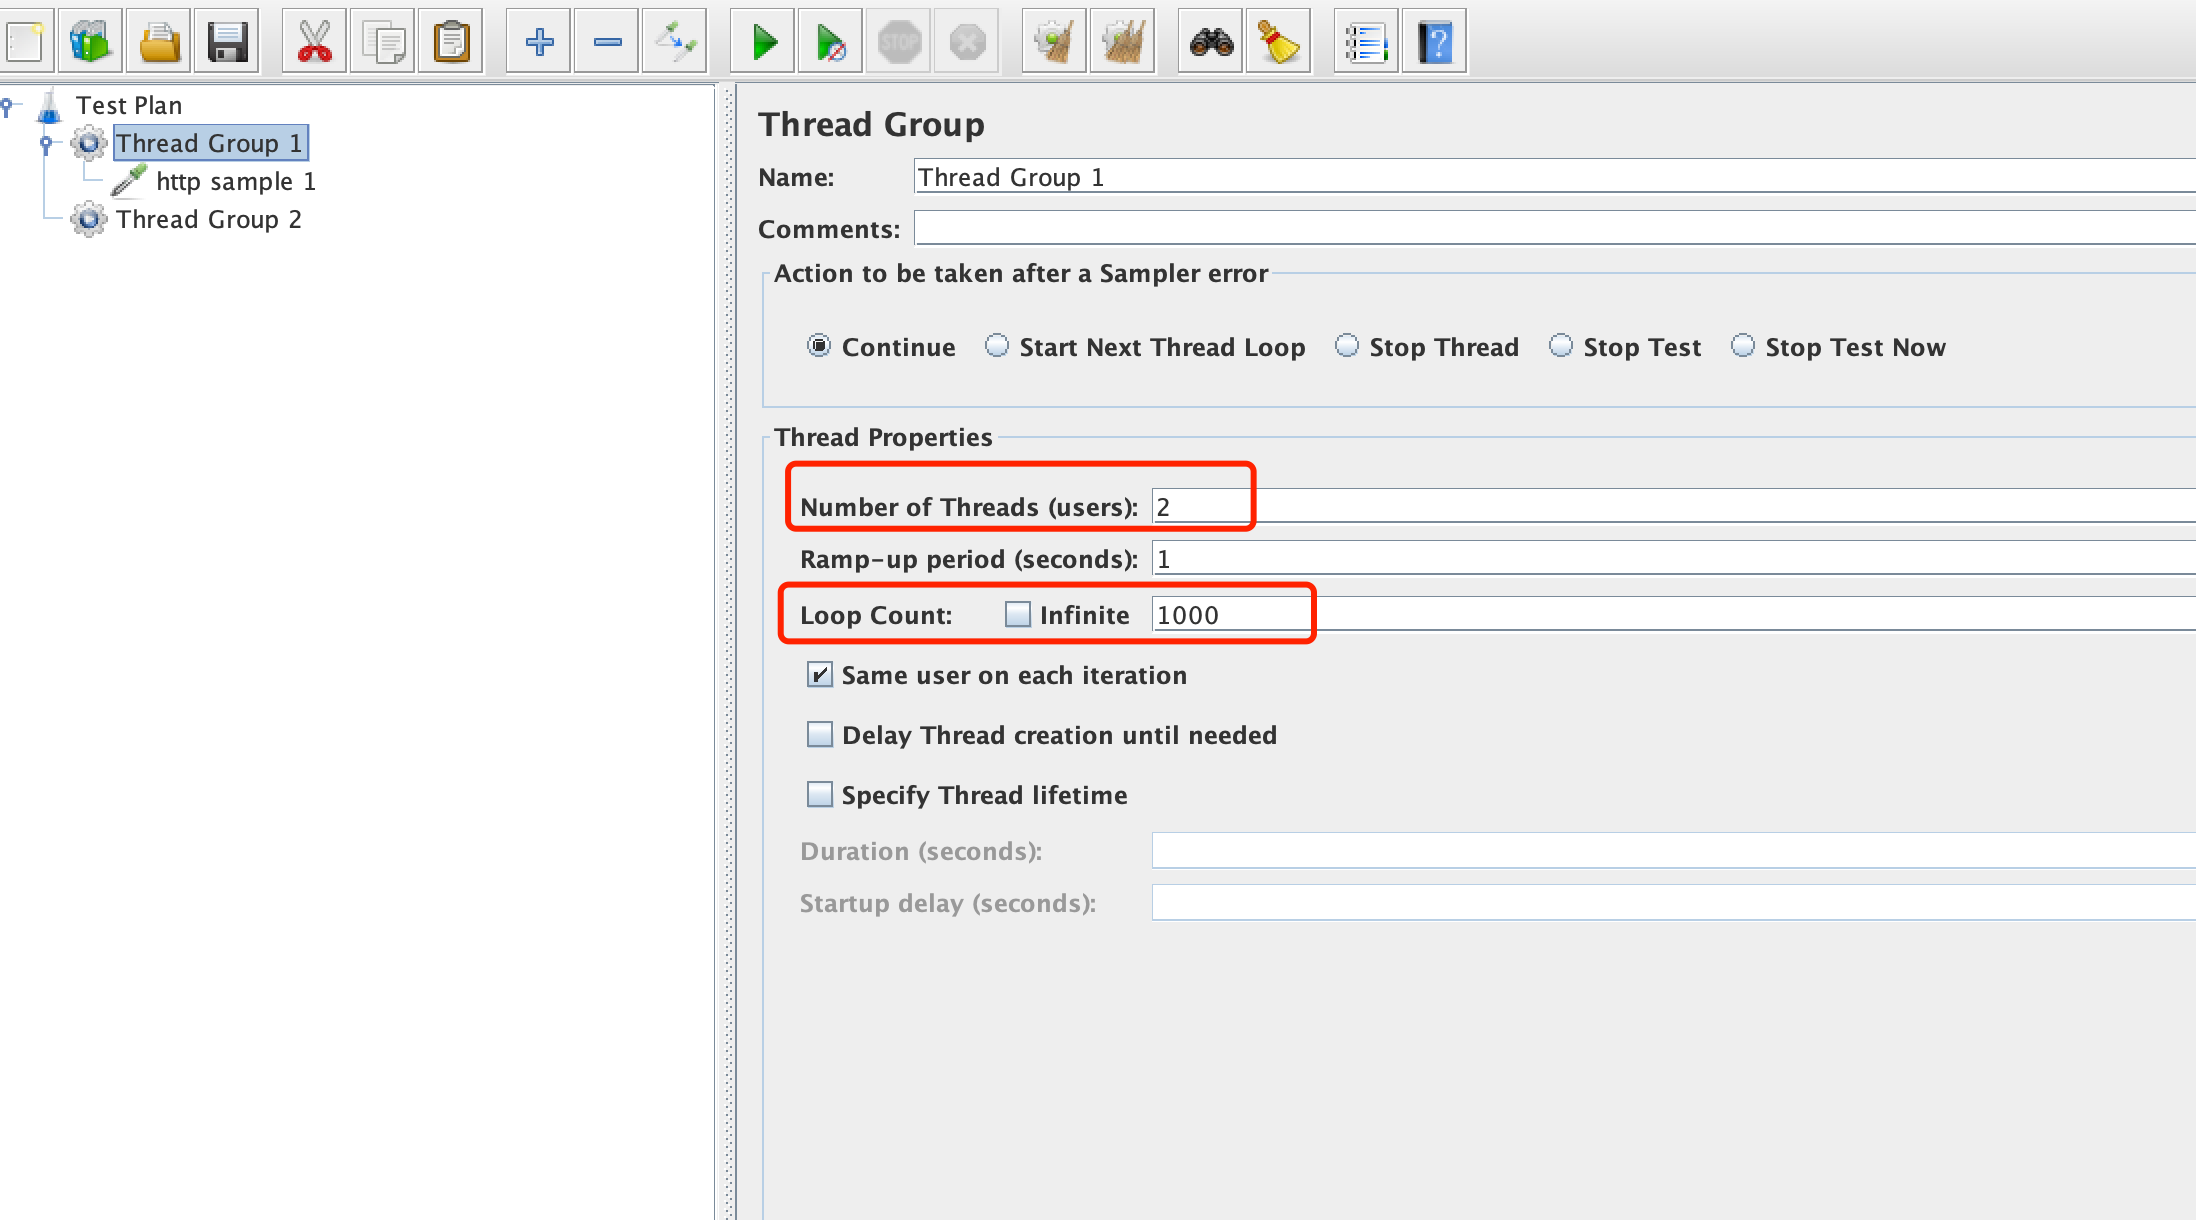
When thread groups run serially, the next thread group can be executed only after the current thread group is completed. Therefore, we need to set the number of loops for the thread group so that the current thread group can exit properly and the next thread group can obtain enough time to execute.
In the following example, Thread Group 1 contains 2 threads, and each thread is looped 1,000 times. After HTTP sampler 1 is executed 2,000 times (1,000 times per thread), Thread Group 1 exits, and Thread Group 2 starts to be executed.
Using PTS to Set the JMeter Stress Model
PTS supports two stress modes, parallel running of thread groups and parallel running of thread groups.
The stress model configured in PTS will overwrite the configuration of the main thread group in the JMX file without affecting the setUp and tearDown thread groups.
Configuring Parallel Running of Thread Groups in PTS
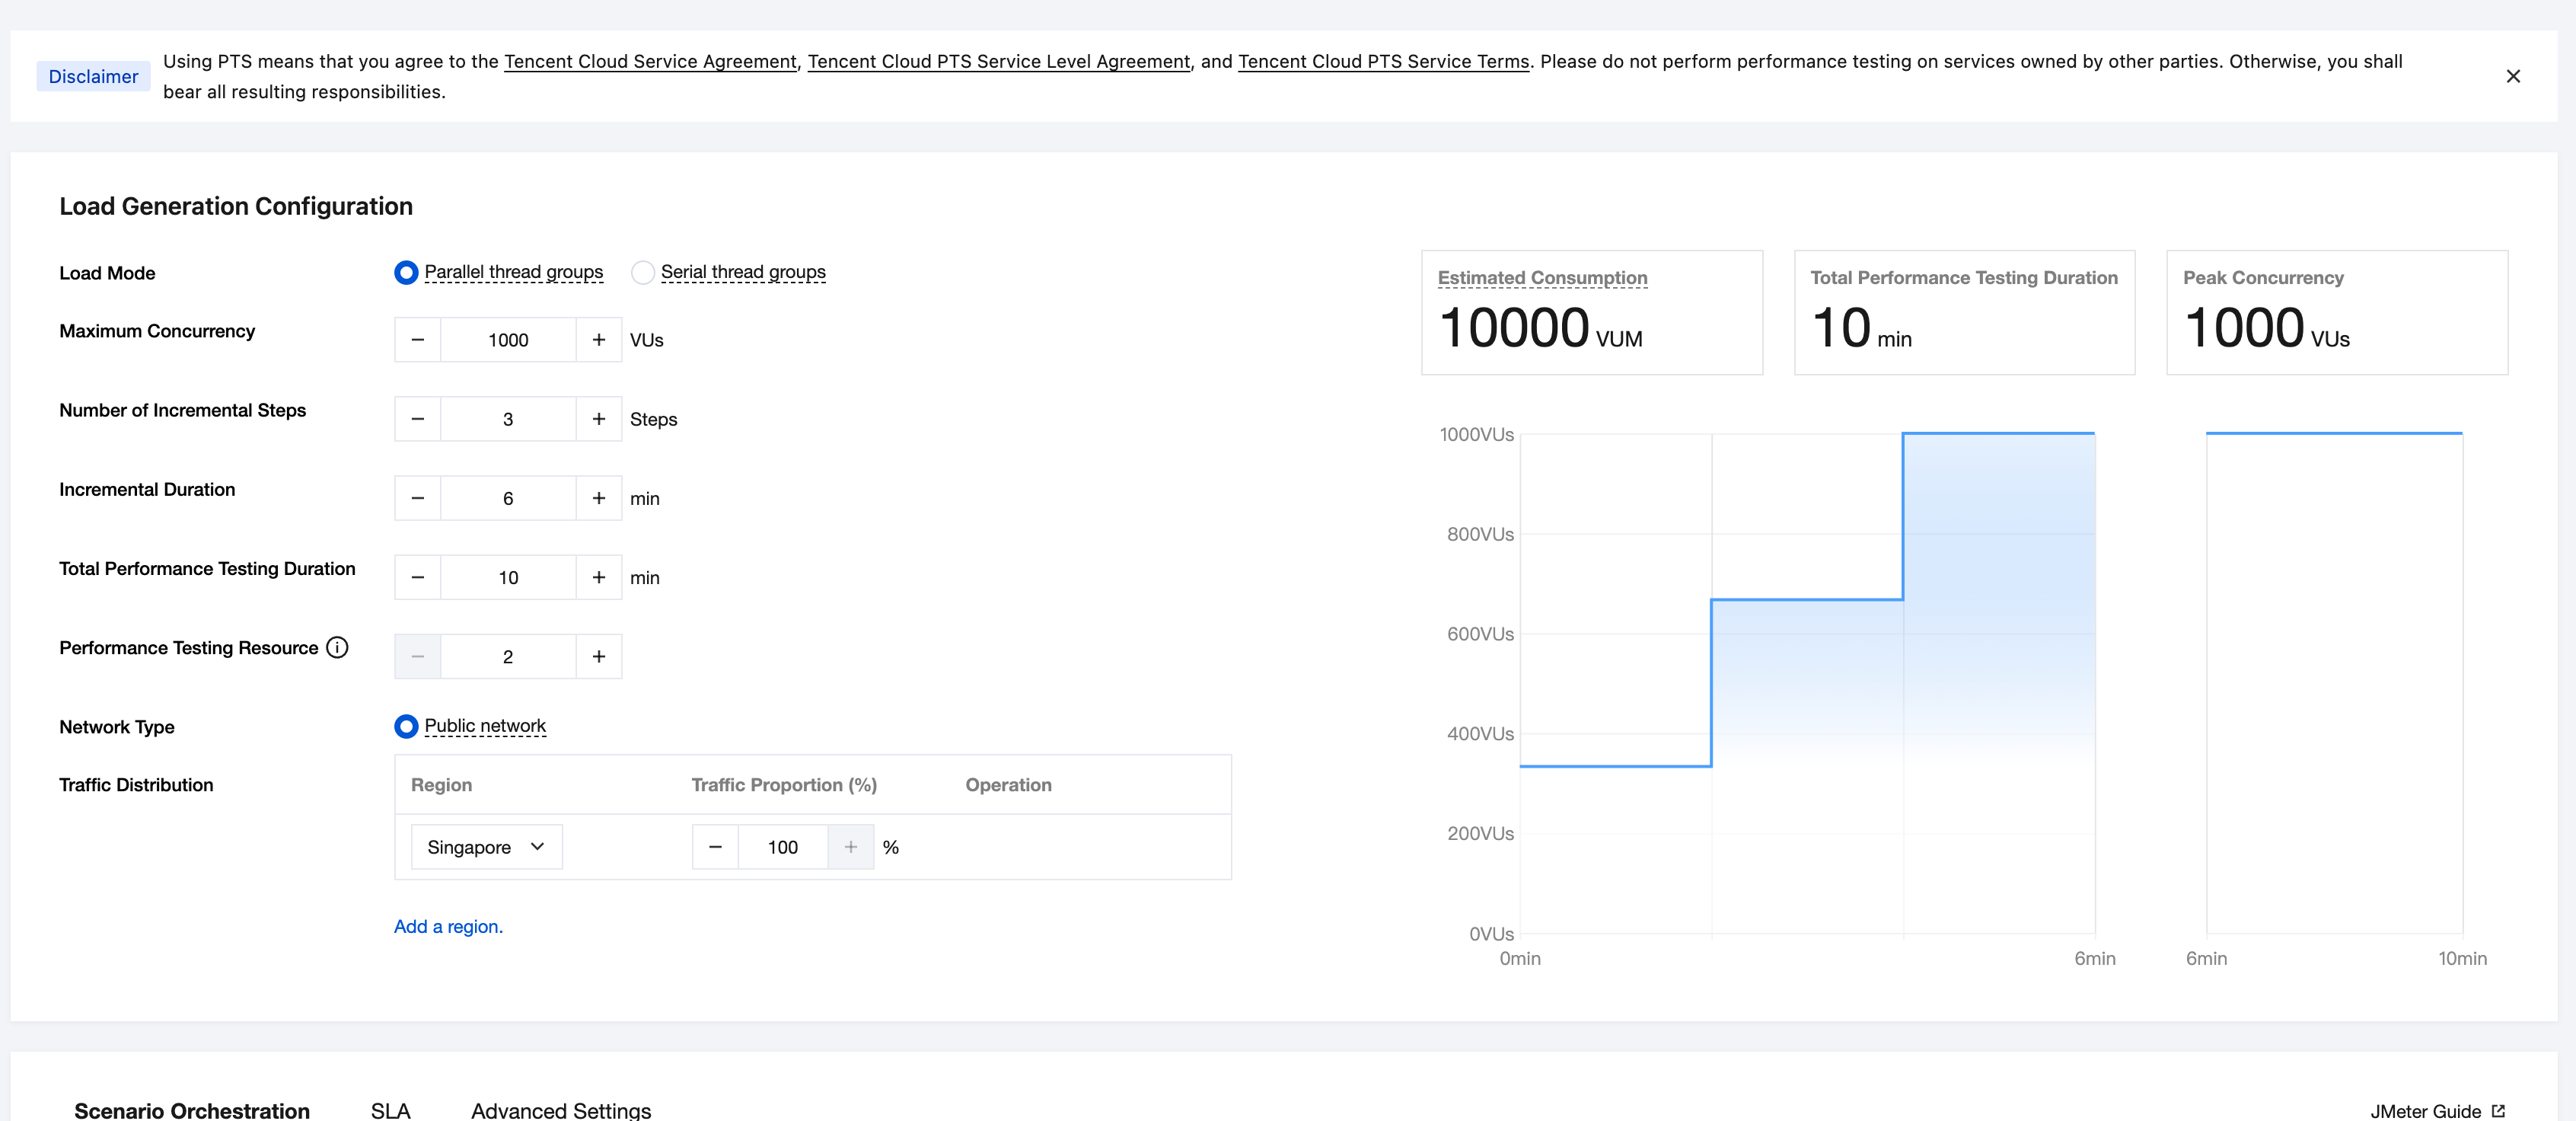
Select Thread group parallel as the stress mode, and set the desired maximum concurrency to 1,000, the increment step to 3, and the performance testing duration to 10 minutes. The corresponding stress model will be rendered on the right.
When you select Thread group parallel, the configuration of deselecting Run Thread Groups consecutively (i.e. one at a time) in the JMeter test plan will be overwritten, indicating that thread groups run in parallel.
When you set the maximum concurrency to 1,000, threads will be proportionally allocated among multiple main thread groups. Assume that there are two thread groups in the user's JMX script, the number of threads in thread group A is set to 10, and the number of threads in thread group B is set to 20. During the performance testing, 334 threads will be allocated to thread group A, and 667 threads (rounded up) will be allocated to thread group B.
The settings of the increment step, increment duration, and total performance testing duration will be applied to each main thread group. The stress models of multiple main thread groups are merged, which is equivalent to the stress model configured by the user on PTS.
Configuring Serial Running of Thread Groups in PTS
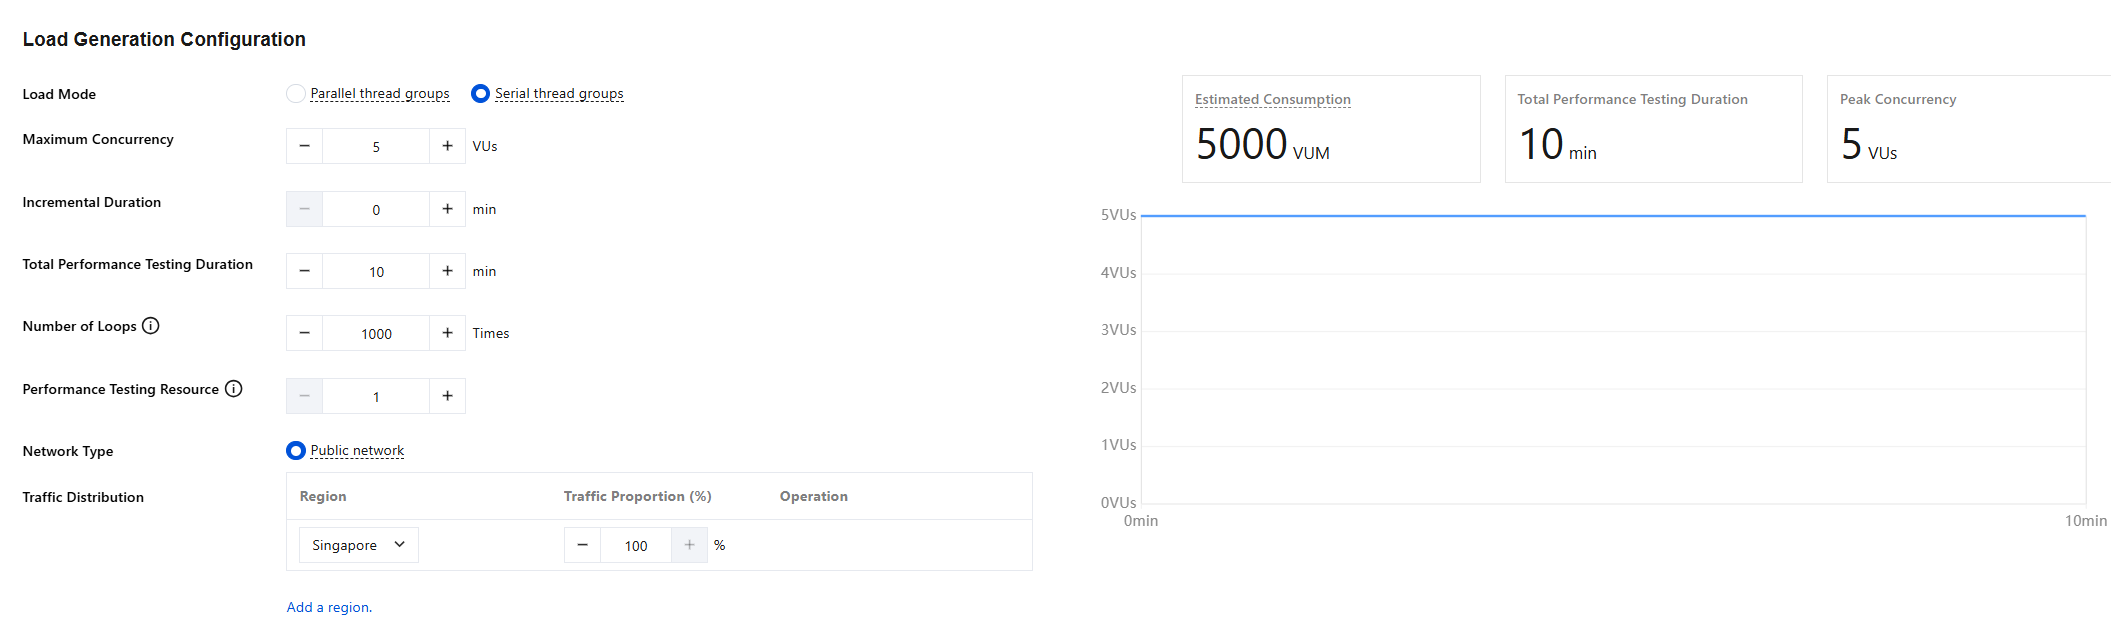
Select Thread group serialization as the stress mode, and set the maximum concurrency to 1,000, the increment duration to 1 minute, the total performance testing duration to 10 minutes, and the number of loops to 1,000.
When you select Thread group serialization, the configuration of selecting Run Thread Groups consecutively (i.e. one at a time) in the JMeter test plan will be overwritten, indicating that thread groups run serially. That is, the next thread group will be executed only after the previous one is completed.
The concurrency configuration will be applied to each main thread group. In this case, the maximum concurrency for each main thread group are 1,000, the increment duration is 1 minute, the total performance testing duration is 10 minutes, and the number of loops is 1,000.
The settings of the number of loops will be applied to each thread, indicating the number of times each thread is looped. If either the number of loops or the performance testing duration reaches the preset value, the current concurrency will be stopped.
In serial mode of thread groups, the number of loops should be set so that the current thread group can exit and the next thread group can obtain enough time to execute after the number of loops is reached.
After all concurrent executions in a thread group exit, the current thread group completes execution, and the next thread group starts execution.
Note:
In serial mode of thread groups, the number of loops should be set so that the current thread group can exit and the next thread group can obtain enough time to execute after the number of loops is reached.