The OracleDB Exporter is an open-source component designed to scrape metrics from Oracle databases and expose them in a Prometheus-compatible format. The metrics reported by this exporter, such as performance, load, and health status, are used for monitoring dashboards and anomaly alarms. Tencent Cloud Observability Platform (TCOP) Prometheus provides integration with OracleDB Exporter and pre-configured Grafana monitoring dashboards.
2. Select the corresponding Prometheus instance from the instance list.
3. Go to the instance details page, select Data Collection > Integration Center.
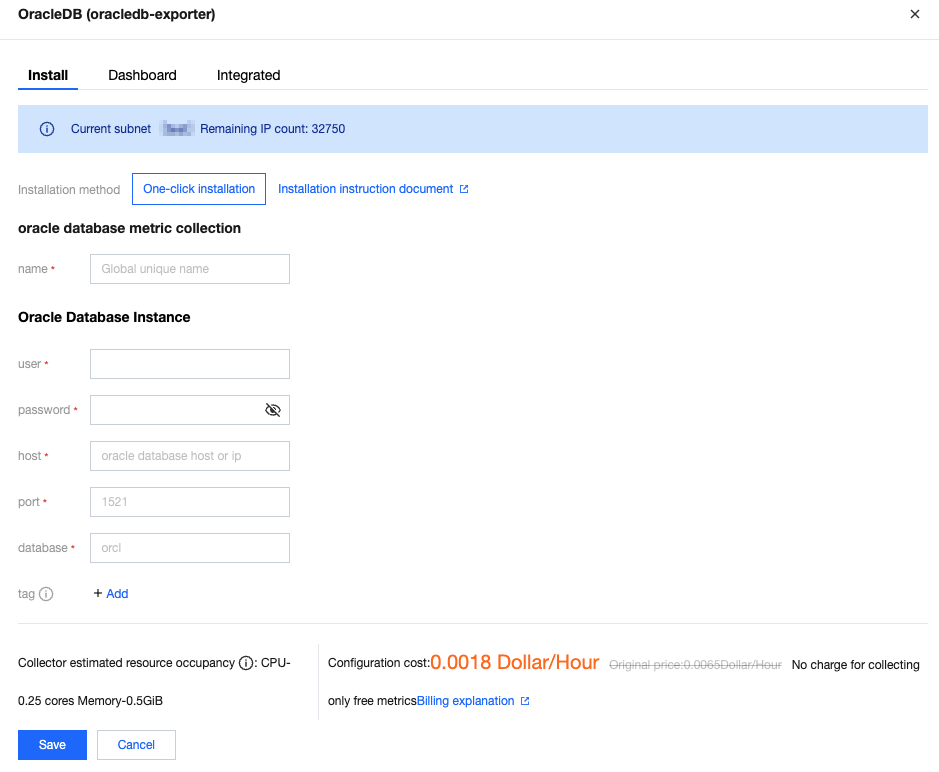
4. In the Integration Center, locate and click OracleDB to open an installation window. On the installation page, enter details such as the metric collection name and address, then click Save.
Configuration Instructions
Parameters
Description
name
Exporter name, which should meet the following requirements:
The name should be unique.
The name should conform to the following regular expression: '^[a-z0-9]([-a-z0-9]*[a-z0-9])?(\\.[a-z0-9]([-a-z0-9]*[a-z0-9])?)*$'.
user
The username of OracleDB.
password
The password of OracleDB.
host
The service domain name of OracleDB.
port
The service port of OracleDB.
database
The database name of OracleDB.
tag
Custom labels for metrics.
Method 2: Custom Installation
Description
TKE is recommended for convenient installation and management of the Exporter.
Prerequisites
A TKE cluster has been created in the region and VPC of the corresponding Prometheus instance, and a namespace has been created for the cluster.
In the TMP console , select the corresponding Prometheus instance, and then Data Collection > Integration with TKE, locate the corresponding container cluster to complete the cluster association. For details, see the guide on Integration with TKE.
Step 2: Managing OracleDB Connection String by Using Secret
1. Choose Workload > Deployment in the left sidebar to enter the Deployment page.
2. In the top-right corner of the page, click Create YAMLto create a YAML configuration. The configuration details are as follows:
3. Use Kubernetes Secret to manage the connection string and encrypt it. When starting the OracleDB Exporter, directly use the Secret Key. Adjust the corresponding connection string as needed. A sample YAML configuration is as follows:
apiVersion: v1
kind: Secret
metadata:
name: oracledb-secret-test # Adjust to the corresponding name based on business requirements.
namespace: oracledb-demo # Adjust to the corresponding namespace based on business requirements.
type: Opaque
stringData:
datasource: "oracle://test:123456/127.0.0.1:1521/ORCLPDB1"# Corresponds to the OracleDB connection string information.
# test is the username, 123456 is the user password, 127.0.0.1 is the database IP or domain name, 1521 is the database port, and ORCLPDB1 is the database name.
Step 3: Deploying OracleDB Exporter
1. In the left menu, choose Workload > Deployment to access the Deployment management page.
2. Click Create YAML in the upper right corner of the page to create a YAML file, and select the corresponding namespace for server deployment. The following part shows how to deploy the Exporter by using a YAML file. Sample configurations are as follows:
apiVersion: apps/v1
kind: Deployment
metadata:
labels:
k8s-app: oracledb-exporter # Adjust to the corresponding name based on business requirements. It is recommended to include information about the OracleDB instance.
name: oracledb-exporter # Adjust to the corresponding name based on business requirements. It is recommended to include information about the OracleDB instance.
namespace: oracledb-demo # Adjust to the corresponding namespace based on business requirements.
spec:
replicas: 1
selector:
matchLabels:
k8s-app: oracledb-exporter # Adjust to the corresponding name based on business requirements. It is recommended to include information about the OracleDB instance.
template:
metadata:
labels:
k8s-app: oracledb-exporter # Adjust to the corresponding name based on business requirements. It is recommended to include information about the OracleDB instance.
spec:
containers:
- args:
- --web.listen-address=:8080
envFrom:
- secretRef:
name: oracledb-secret-test # The name of the Secret created in the previous step.
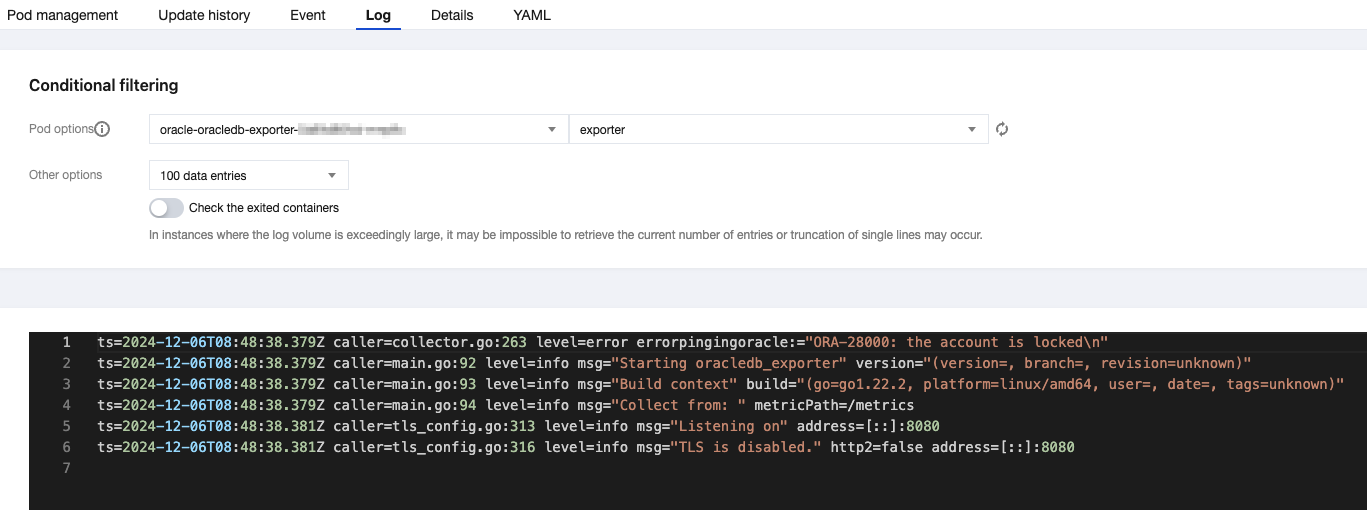
1. Click the Deployment created in the previous step on the Deployment page to go to the Deployment management page.
2. Click the Log tab. If no error messages are displayed, the setup is successful, as shown below:
3. Click the Pod tab to enter the Pod page.
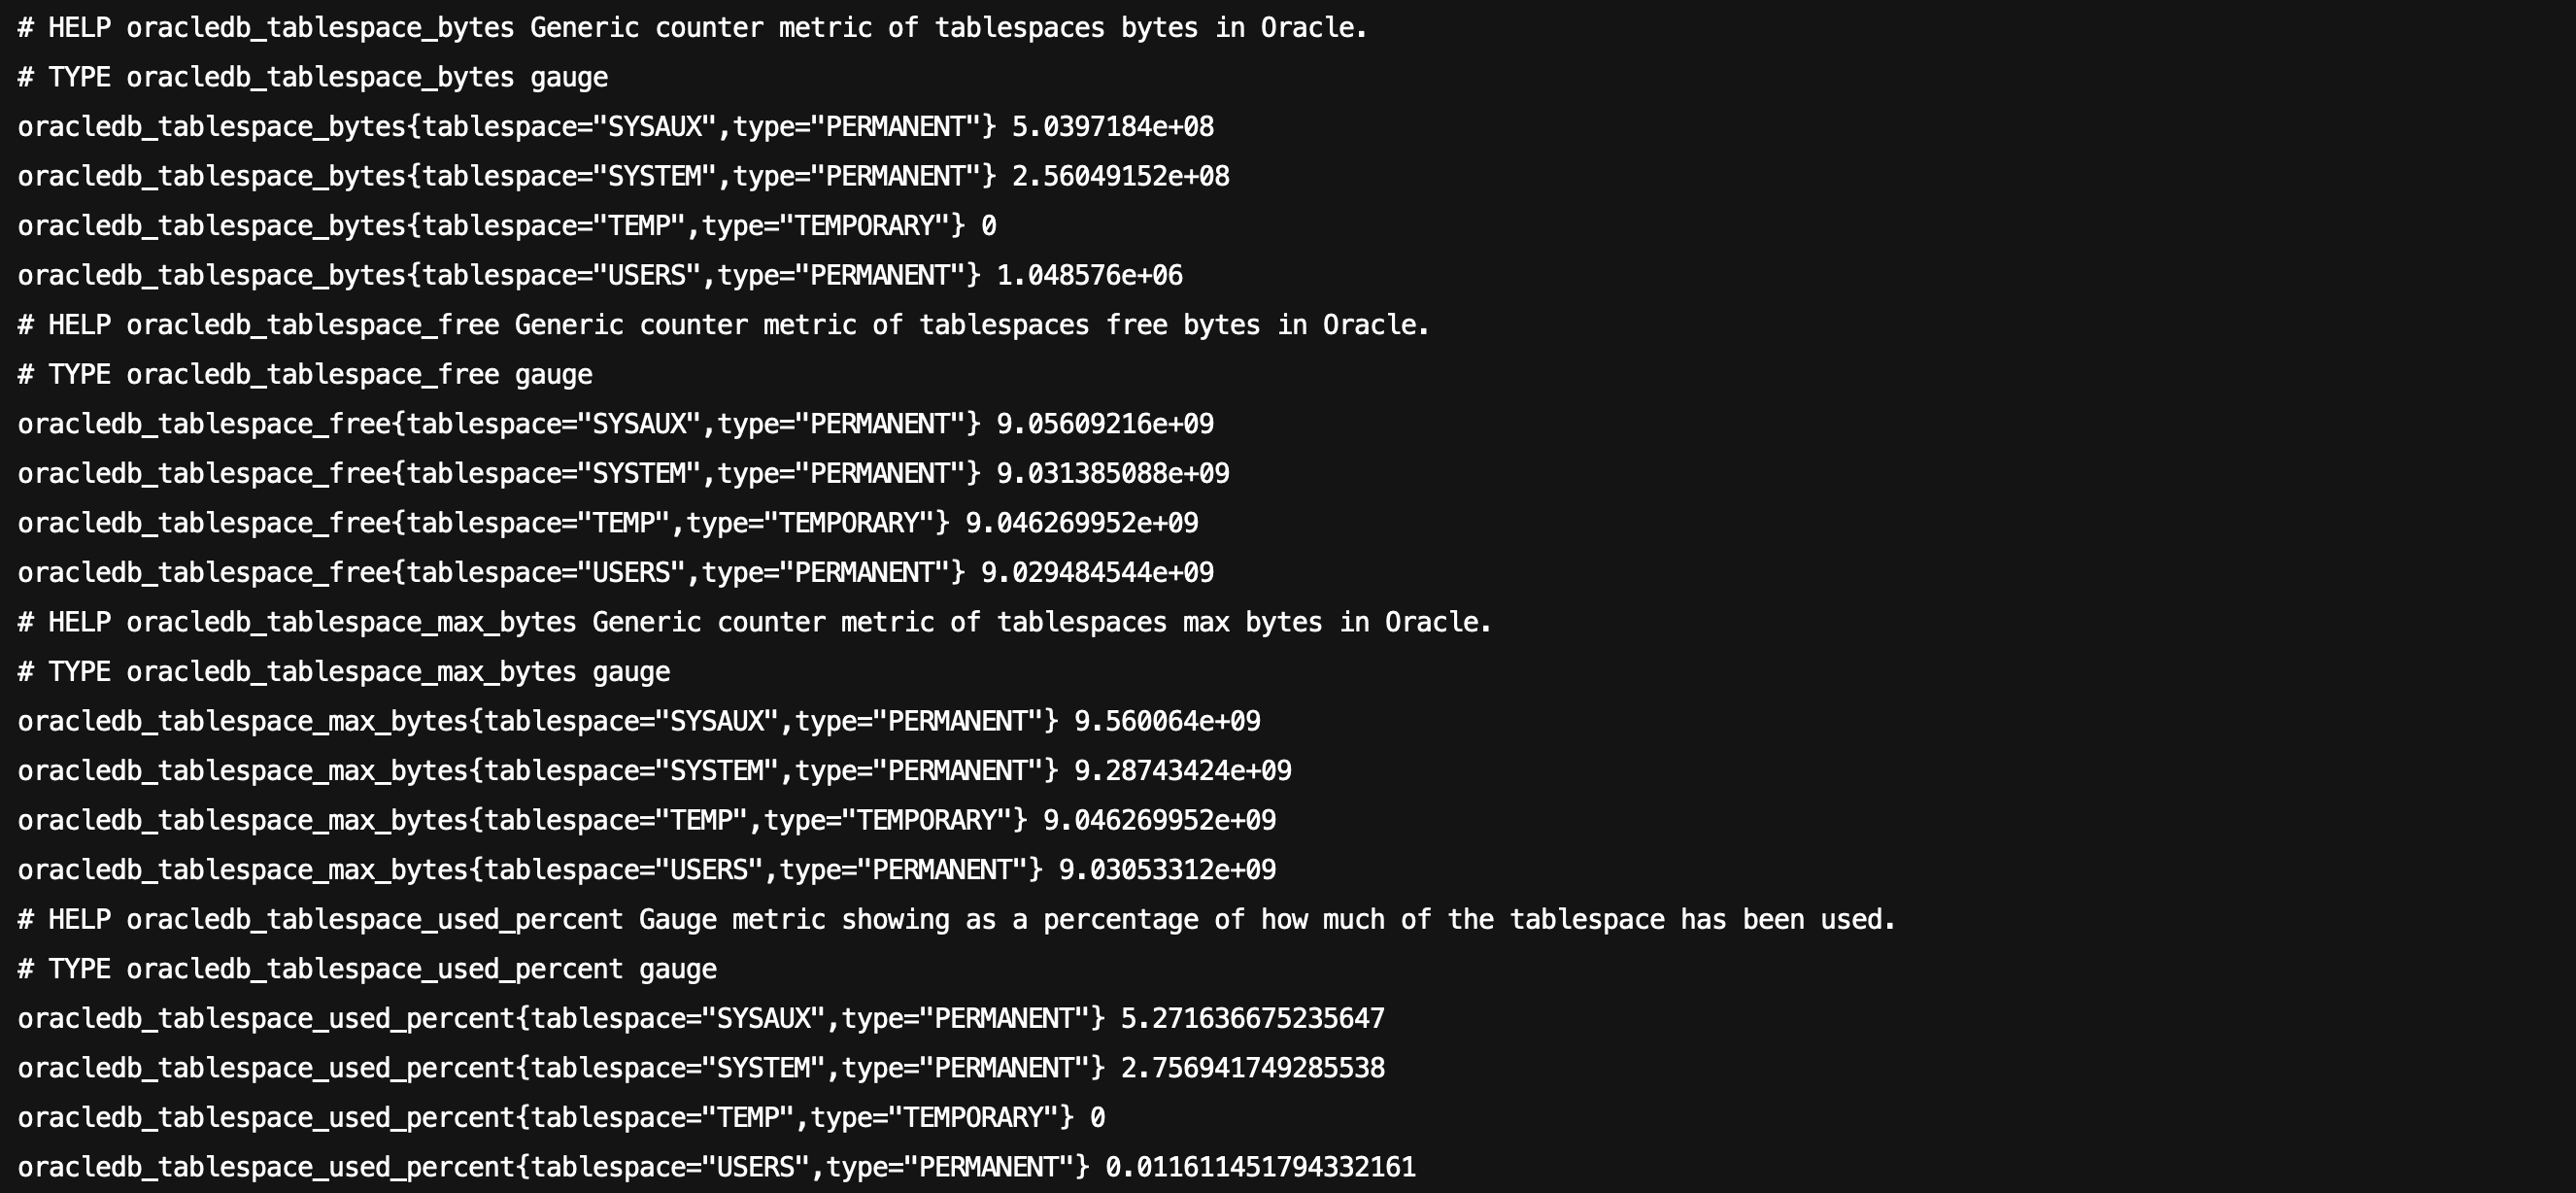
4. Click Remote login under the operation bar on the right to log in to the Pod. In the command-line window, execute the following wget command for the address exposed by the Exporter to retrieve the corresponding OracleDB metrics. If no data is retrieved, check whether the connection string is correct. Details are as follows:
wget -qO- http://localhost:8080/metrics
The successful outcome is shown in the following figure:
Step 5: Adding a Collection Task
1. Log in to the TMP console and select the corresponding Prometheus instance to go to the management page.
2. Choose Data Collection > Integrate with TKE, select the associated cluster, and choose Data Collection Configuration > Customize Monitoring Configuration > Via YAML to add a collection task.
3. Add a PodMonitor via service discovery to define the collection task. The YAML example is as follows:
apiVersion: monitoring.coreos.com/v1
kind: PodMonitor
metadata:
name: oracledb-exporter # Enter a unique name.
namespace: cm-prometheus # Pay-as-you-go instance: Use the namespace of the cluster. Yearly/monthly subscription instance (no longer available): The namespace is fixed. Do not change it.
spec:
podMetricsEndpoints:
-interval: 30s
port: metric-port # Enter the port of the Prometheus Exporter in the Pod YAML file.
path: /metrics # Enter the path of the Prometheus Exporter. Default value: /metrics.
relabelings:
-action: replace
sourceLabels:
- instance
regex: (.*)
targetLabel: instance
replacement:'crs-xxxxxx'# Replace with the corresponding OracleDB instance ID.
namespaceSelector:# Select the namespace where the OracleDB Exporter pod to be monitored is located.
matchNames:
- oracledb-demo
selector:# Enter the labels of the Pod to be monitored to locate the target Pod.
matchLabels:
k8s-app: oracledb-exporter
Viewing Monitoring Information
Prerequisites
The Prometheus instance has been bound to a Grafana instance.
Operation Steps
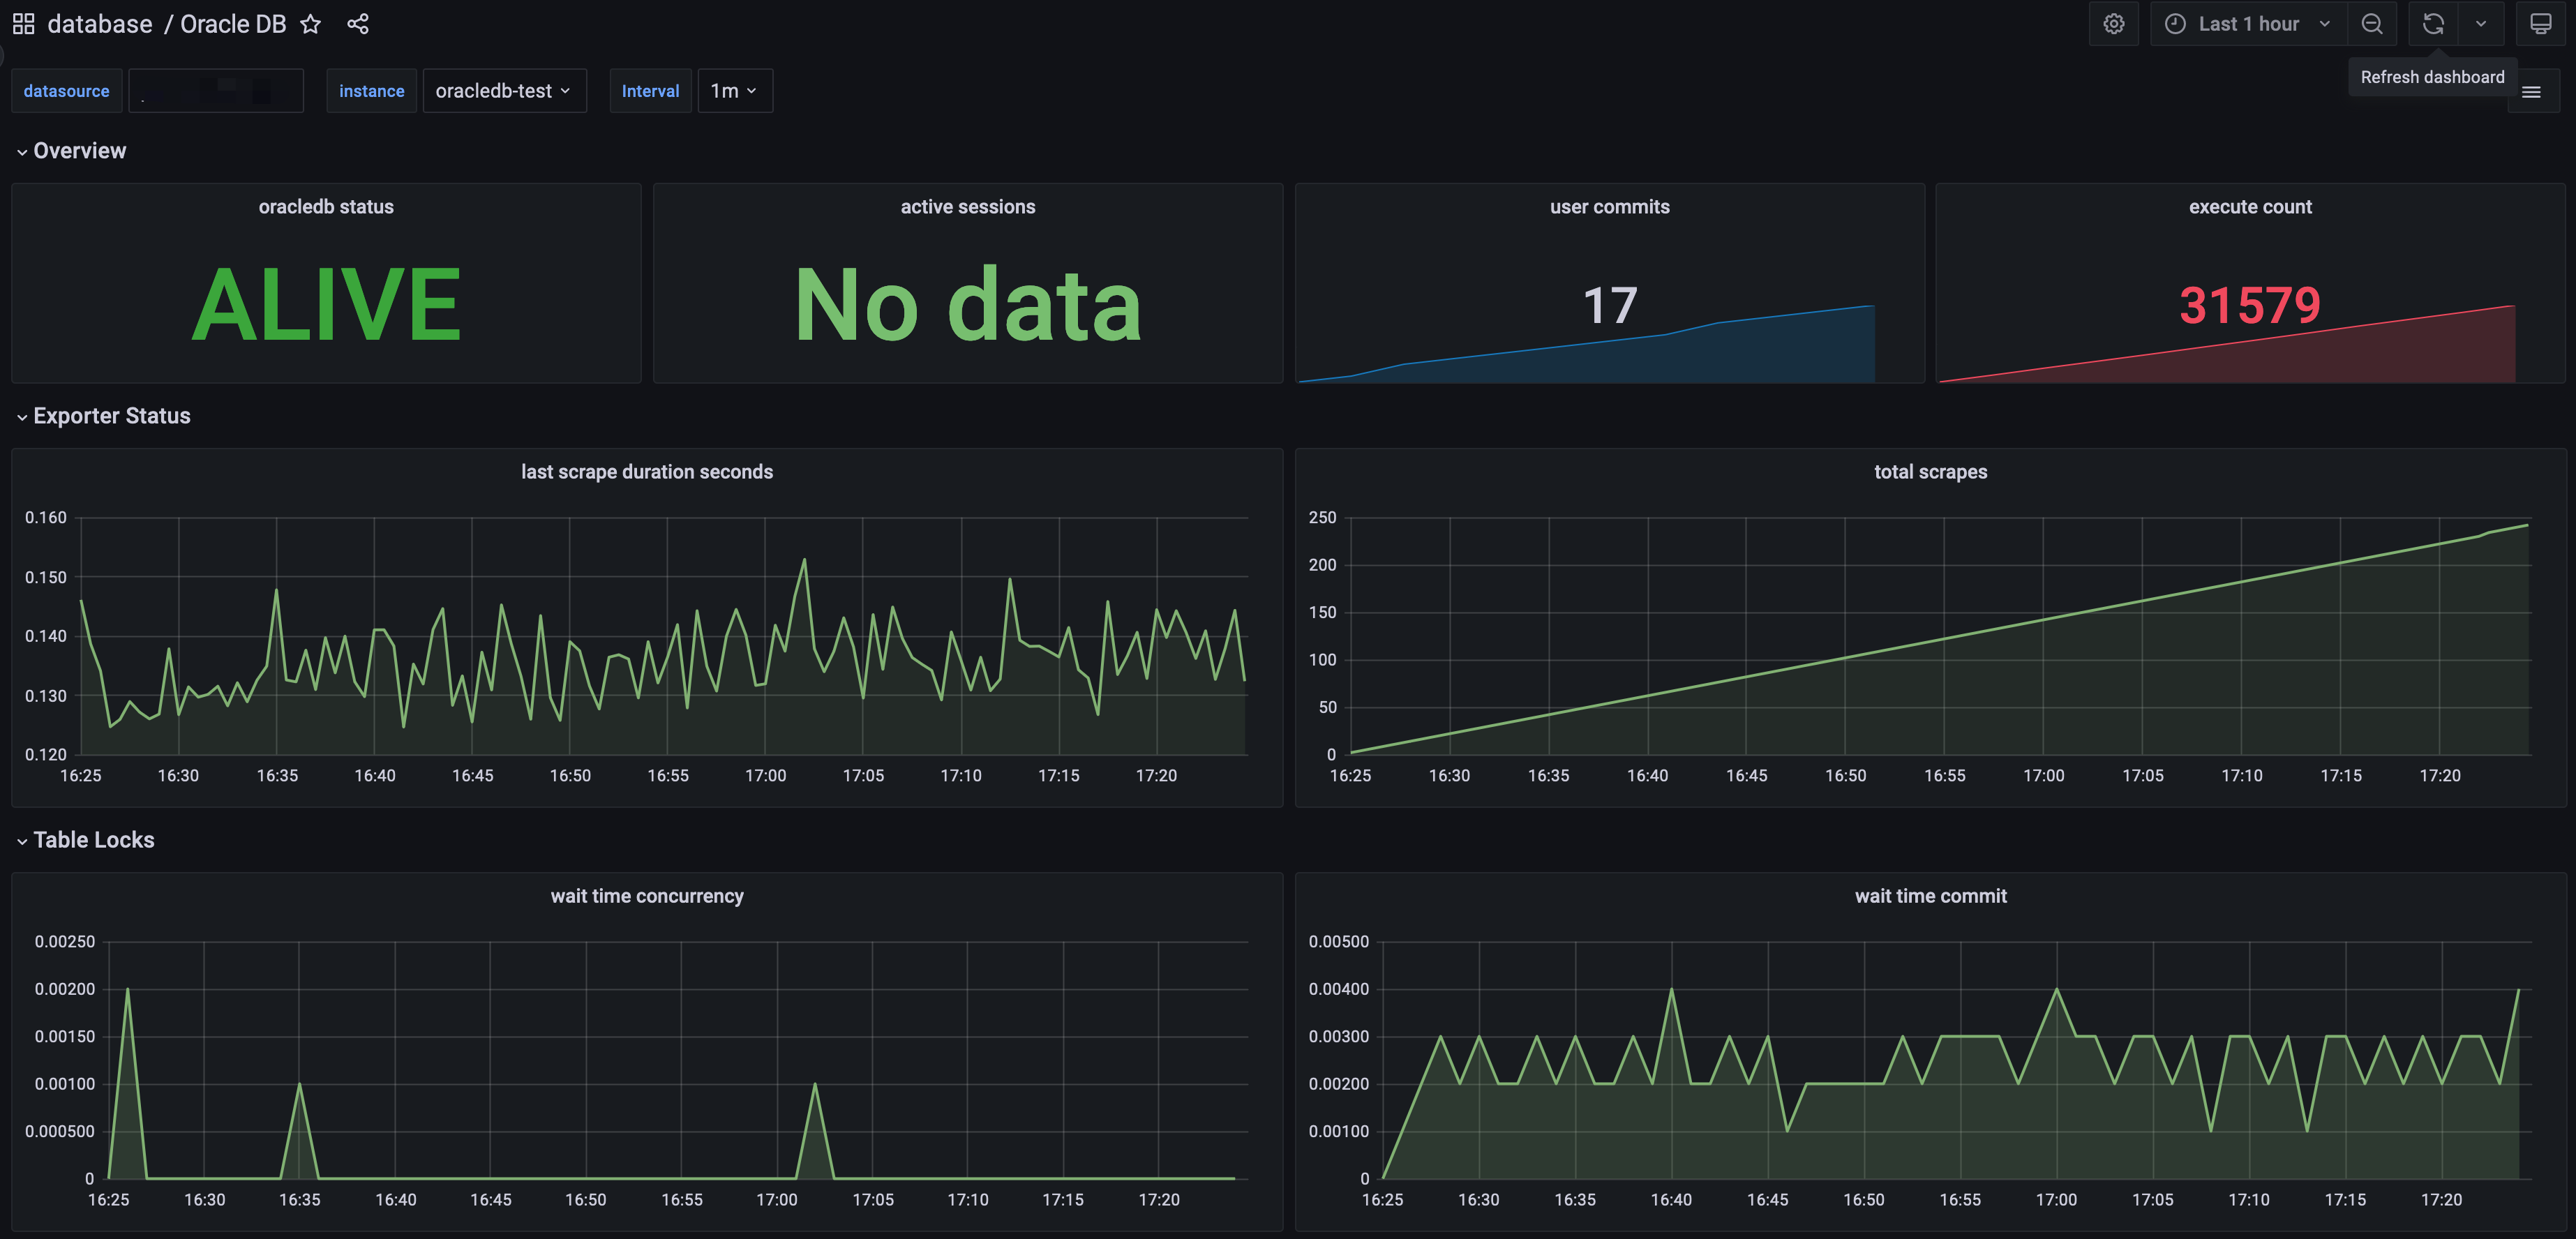
1. Log in to the TMP console and select the corresponding Prometheus instance to go to the management page.
2. On the Basic Information page of the instance, locate the bound Grafana address. Open and log in, then navigate to the database folder to find the monitoring dashboard for the OracleDB instance. View the relevant monitoring data for the instance, as shown below:
Configuring Alarm
TMP supports configuring alerting rules based on the actual business situation. For details, see Creating Alarm Rules.