The performance profiling capability is implemented based on the async-profiler technology. It enables the generation of performance profiling flame graphs with extremely low performance overhead, helping users intuitively analyze the reasons for CPU/memory spikes and quickly identify application performance bottlenecks. Compared to directly using the community async-profiler solution, the performance profiling capability provided by Application Performance Management (APM) eliminates complex operations such as tool installation, command execution, and profiling result downloads, significantly improving the efficiency of troubleshooting application performance issues.
Based on repeated performance test results, performance profiling collection was conducted on a typical Microservice application. During the collection process, the CPU overhead remained below 5%, and the memory overhead was below 50M, which had a negligible impact on the Transaction per Second (TPS) and response time.
Prerequisites
The application is accessed via Tencent Cloud Enhanced Java Agent 1.16-2024030510 or later.
OpenJDK or other JDKs developed based on the HotSpot JVM are installed in the runtime environment. Environments with only JRE installed are not supported at this time.
Linux (X64 and ARM64) operating systems are supported. macOS and Windows are not supported at this time.
It is not recommended to use JDKs earlier than Java 8u352, as there may be a risk of Memory Crash.
2. In the left sidebar, select Application Performance Management > Application Diagnosis, and click to enter the performance profiling page.
3. In the instance list on the left side of the page, find the instance that you want to perform performance profiling on, and click collect.
4. In the pop-up dialog, select the data collection duration and collection type, and click OK.
5. After the collection task is submitted, you can query the profiling results in the performance profiling records on the right side of the page. When the collection status is Collection Completed, click View Performance Analysis to view the performance profiling flame graph on the pop-up page.
Option Name
Description
Data Collection Duration
Specifies the duration for collecting profiling data, starting from when the application instance receives the collection task. Currently, supported durations include 5 seconds, 10 seconds, 30 seconds, 3 minutes, and 5 minutes.
Collection Type
Determines the performance metrics represented by the profiling data. Currently, three collection types are supported, that is, CPU, duration, and memory.
CPU: Measures the time taken by the CPU to execute a block of code.
Duration: Measures the actual time elapsed from entering to exiting a method. It is calculated based on the wall clock time. All waiting time, locking time, and thread synchronization time are included. Therefore, the wall clock time will not be shorter than the CPU time.
memory: Measures memory allocation.
How to Use Performance Profiling Flame Graphs?
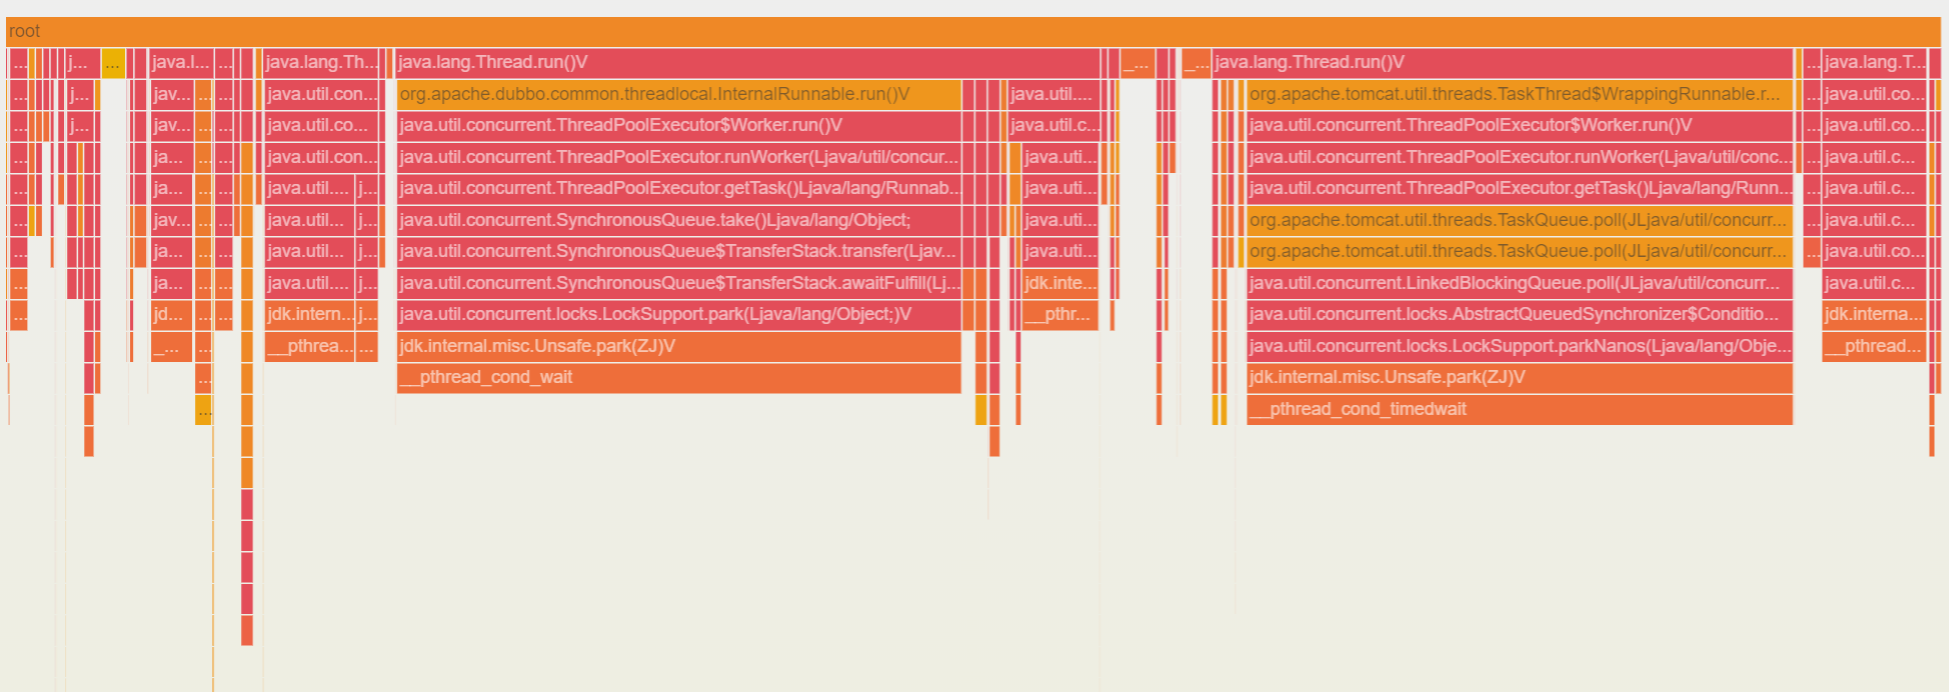
Performance profiling collects profiling data based on sampling. Performance metrics are reflected by the frequency at which functions appear in the sampling, which are not absolute values. Therefore, you need to focus on the relative proportion between methods (functions). In the flame graph, the Y-axis represents the depth of the method (function) stack, and the X-axis represents the number of times a method (function) is sampled. For example, in the case of CPU time, the wider the width of a method (function), the longer the time it takes for the CPU to execute that block of code.
When analyzing the flame graph, it is recommended to start with the deepest method (function). The deeper the stack, the closer it appears to the bottom of the flame graph, that is, the position of the "flame" (unlike natural flames, the flames in the flame graphs used by APM point downward).
Note:
The wider the flame, the greater the performance consumption. Therefore, a wide flame is often the root cause of performance issues.