The GC log analysis feature enables troubleshooting of potential risks that may affect application performance based on the garbage collector (GC) logs output by JVM.
Prerequisites
Tencent Cloud Enhanced Java Agent later than 2.3-20240831 supports the GC log analysis feature.
Before using this feature, ensure that JVM has been configured with startup parameters related to GC log printing.
2. Select Application Performance Management > Application Diagnosis in the left sidebar, then select to enter the GC log analysis page.
3. In the instance list on the left side of the page, find the instance that needs GC log analysis, and click analysis. In the pop-up dialog, select data duration, which indicates the time span of backtracking data from the GC log, then click OK.
4. The total analysis time ranges from a few seconds to about 5 minutes, depending on the size of the GC log content included in the selected data duration. Application Performance Management (APM) can analyze up to 100 MB of GC log data, and the excess part will be truncated.
5. Historical analysis records can be found in the table on the right side of the page. The records that have been analyzed will be displayed as Collection Completed status. Click View Reports to obtain the analysis results.
Interpreting the Analysis Report
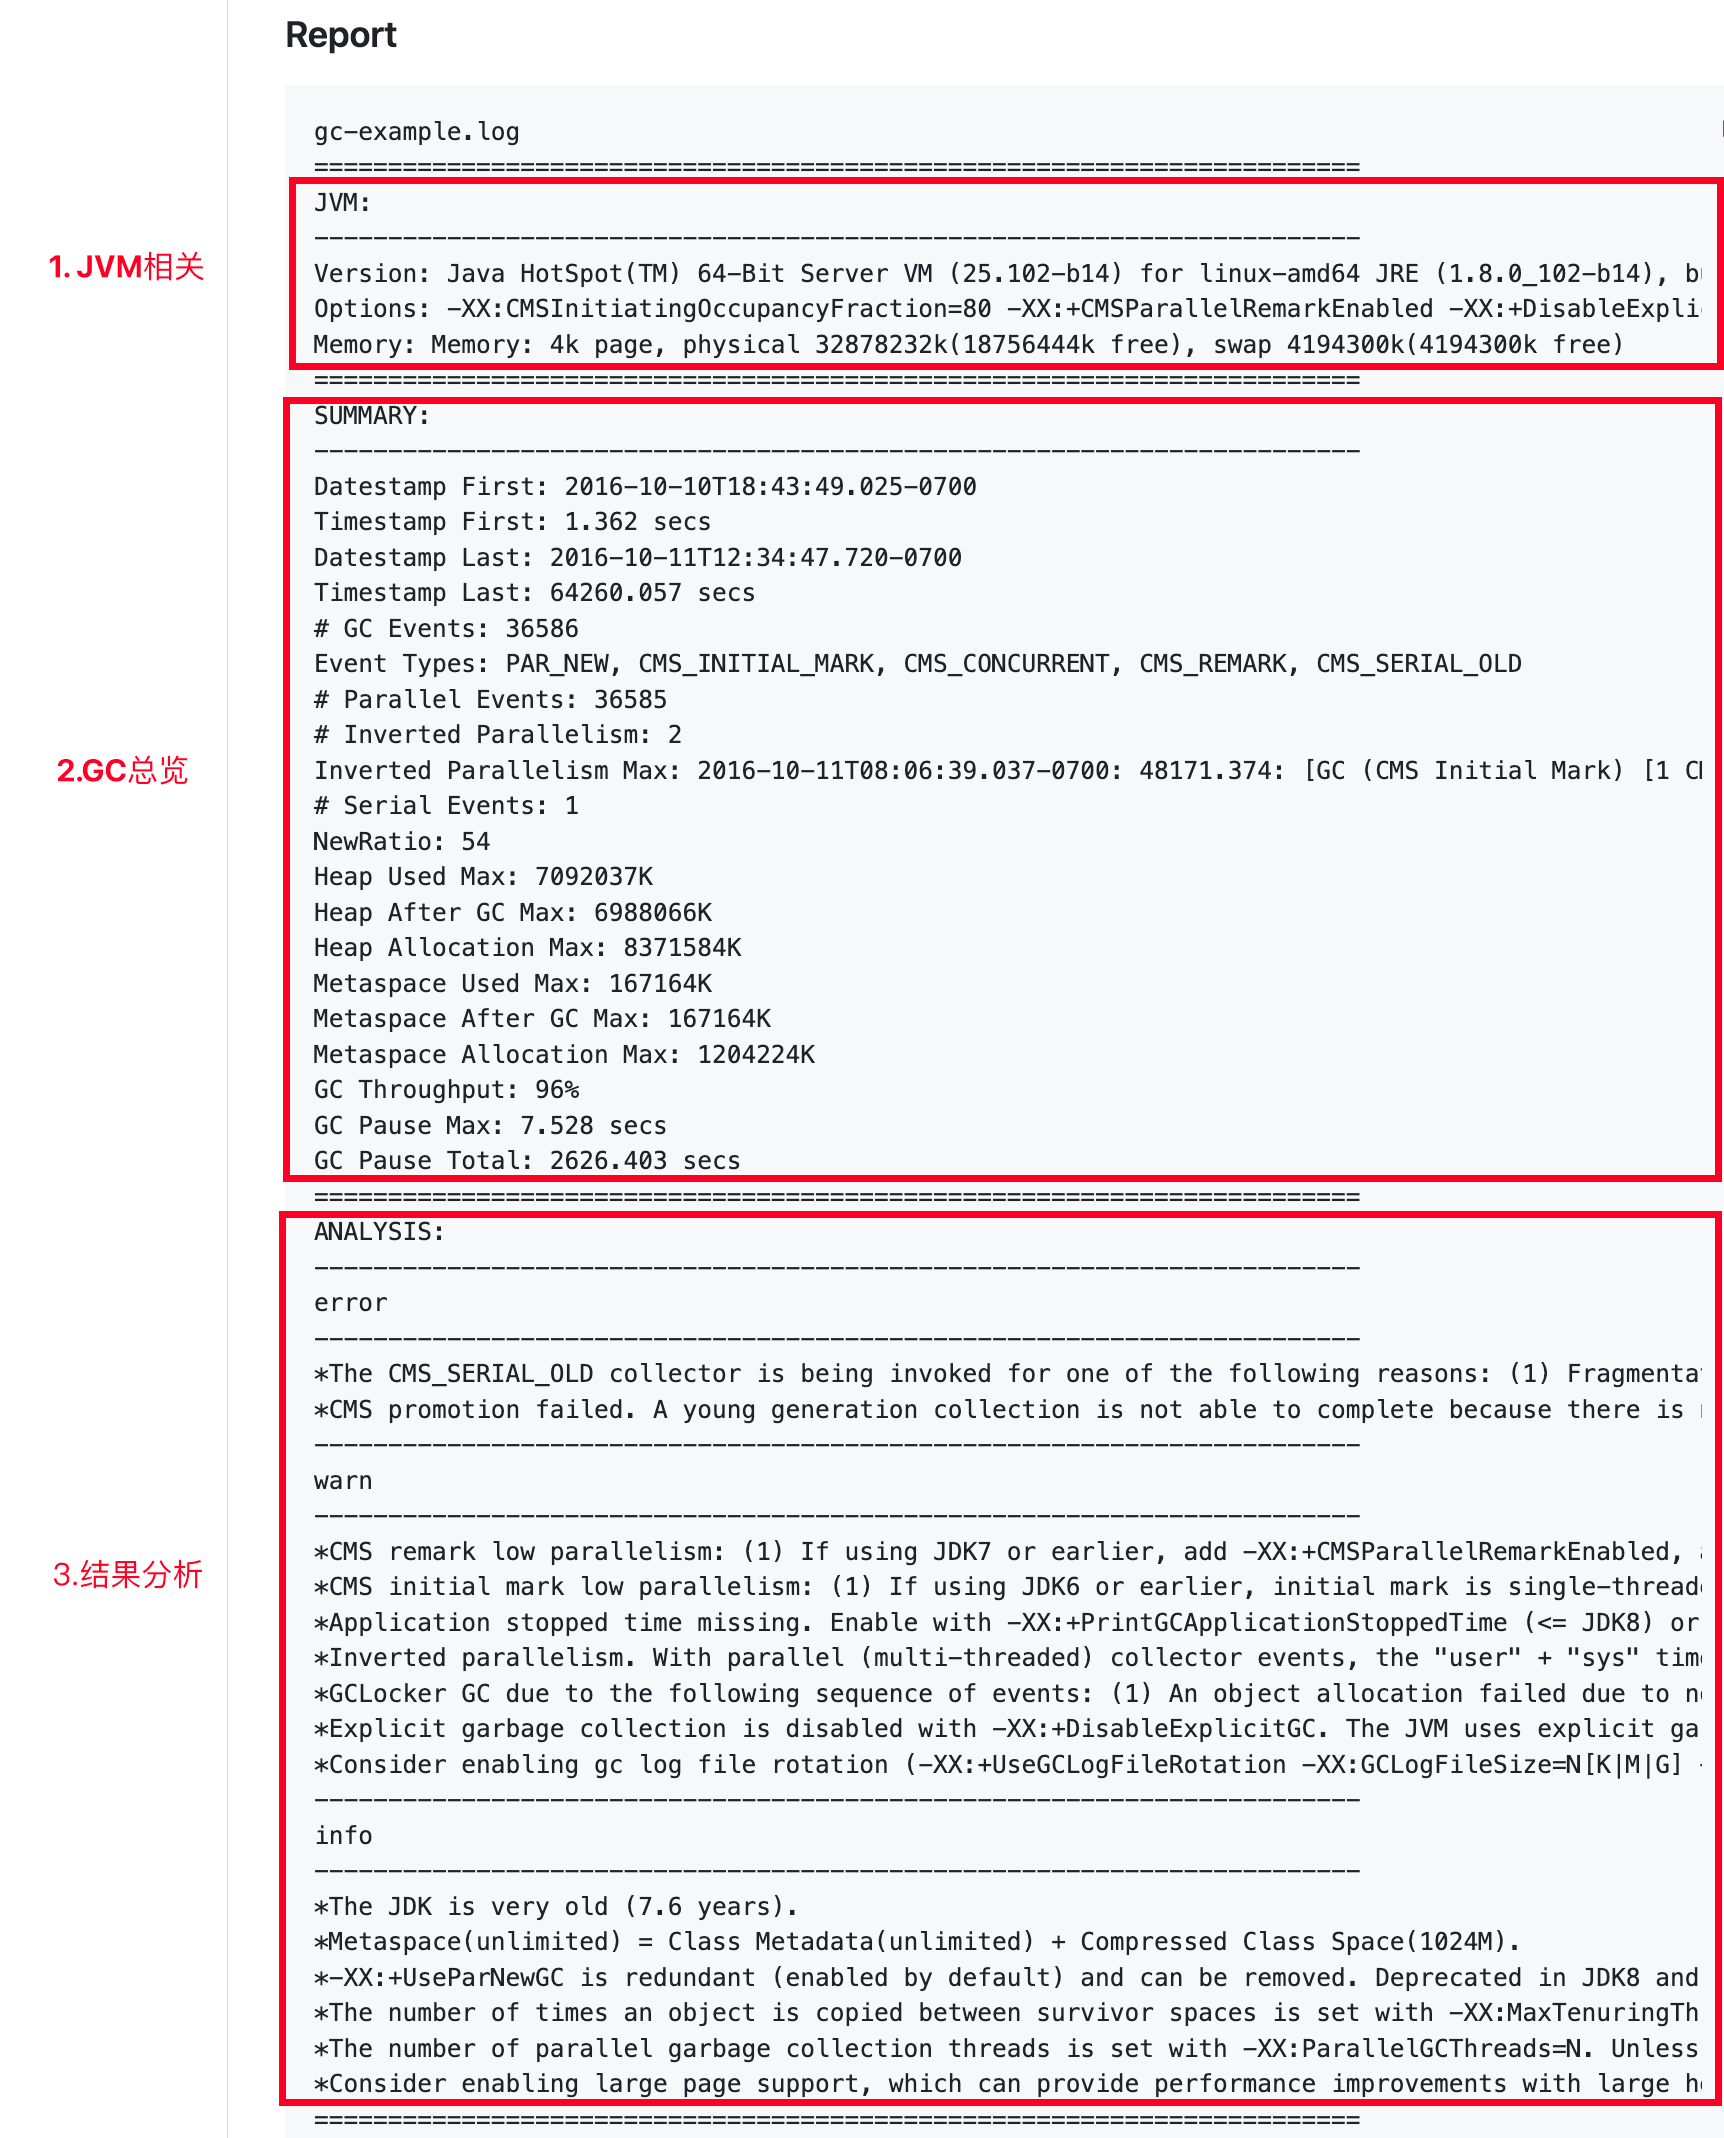
The analysis report contains three parts:
JVM: Displayed only in JDK 8 at present. It records information such as the JVM version, startup parameters, and system attributes.
Summary: Displayed when there are GC behaviors in the selected time period. Pay attention to information such as the log start time, total number of GC events, and GC throughput. GC throughput is an important metric for measuring the performance of Java GCs. You can try different GCs or adjust the related parameters of a GC to obtain a lower GC count and higher GC throughput.
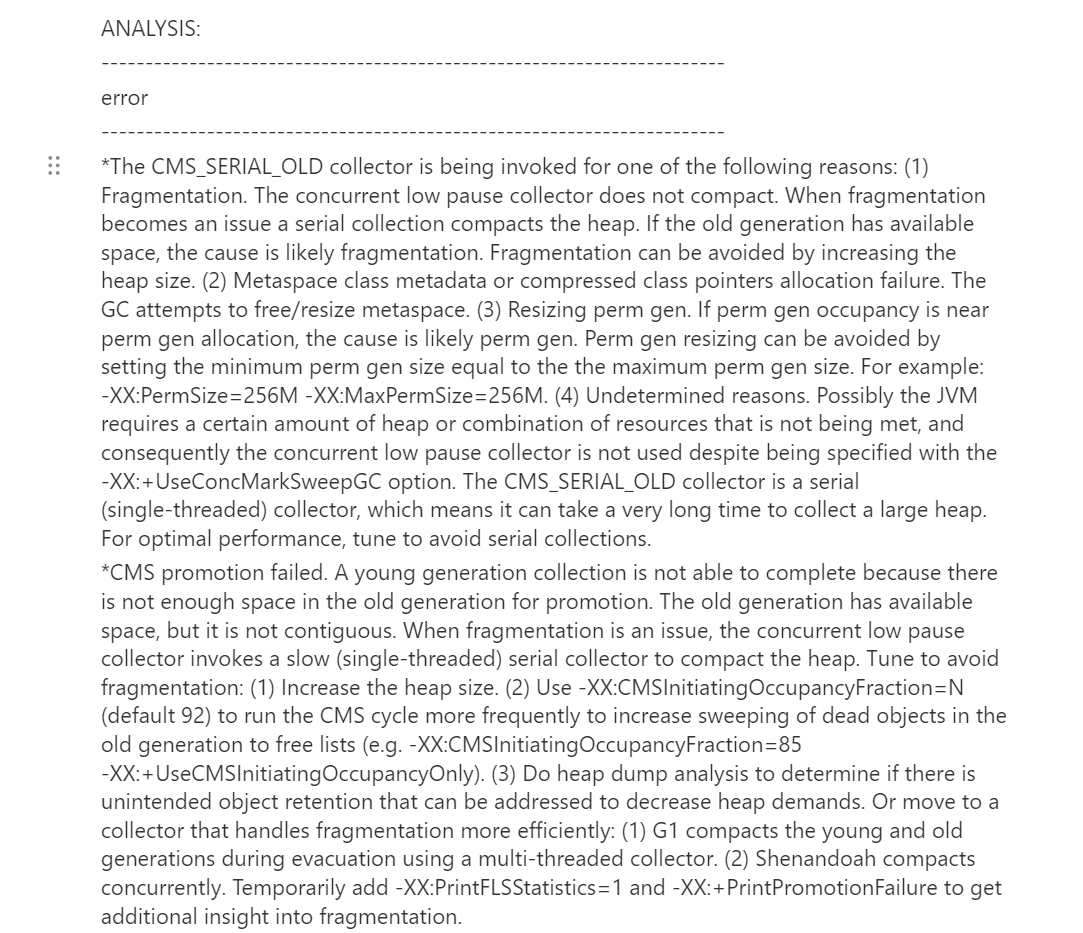
Analysis: Displayed when there are GC behaviors in the selected time period. The analysis result summarizes possible GC issues, provides reasons for the issues, and offers solution suggestions. It is the core content of the analysis report. Focus on the error and warn sections in the analysis result.
Refer to the following analysis report:
Summary
GC Events: 36,586. This value is relatively high. This means that the application may be creating a large number of short-lived objects, potentially leading to frequent garbage collection.
Event Types: During this period, GC events of types PAR_NEW, CMS_INITIAL_MARK, CMS_CONCURRENT, CMS_REMARK, and CMS_SERIAL_OLD are generated.
Parallel Events: 36,585.
Serial Events: 1.
Heap Used Max: 7,092,037 K.
Heap After GC Max: 6,988,066 K. If this value approaches the Heap Used Max, it may indicate inefficient memory usage or a memory leak.
Heap Allocation Max: 8,371,584 K.
Metaspace Used Max: 167,164 K.
Metaspace After GC Max: 167,164 K.
Metaspace Allocation Max: 1,204,224 K.
GC Throughput: 96%. This means that the application spends 96% of its time executing actual business logic and 4% on garbage collection. GC throughput is a metric that measures the performance of Java GCs. It indicates the percentage of time the application is running relative to the total runtime.
GC Pause Max: 7.528 seconds. If the pause time of a single GC is too long, it may affect the response time and delay of the application. For example, if an application needs to complete a transaction within 1000 milliseconds, any GC pause exceeding 1000 milliseconds is unacceptable. Optimization methods may include using concurrent GCs (such as G1 or CMS). These GCs can perform garbage collection while the application is running, thereby reducing the GC pause time.
Analysis
The Analysis part summarizes possible GC issues, provides reasons for the issues, and offers solution suggestions. Focus on the error and warn sections in the analysis result. For example, in the following example, it is clearly indicated that the CMS_SERIAL_OLD GC runs serially and may take a very long time to reclaim large memory, and it is recommended to adjust JVM parameters to avoid using serial GCs. Based on the analysis result, you can optimize JVM and compare the effect after optimization through features such as instance monitoring in APM.