- Release Notes and Announcements
- Announcements
- Billing Content Adjustment for Cloud Streaming Services Standard Transcoding and Top Speed Codec Transcoding
- Announcement on the Price Adjustment of CSS Audio/Video Enhancement Feature
- Announcement on the Official Billing for CSS Standby Streams Feature
- CSS to Support H.265 8K and AV1 8K Transcoding
- CSS Adds Support for AV1 Codec and Audio/Video Enhancement
- Notice: CSS to Adjust Prices of Basic Services
- CSS to Adjust Pricing of Third-Party Relay
- Delayed Playback to Become Paid Feature
- Announcements
- User Guide
- Product Introduction
- Purchase Guide
- Pricing Overview
- Basic Services
- Value-Added Services
- Live Transcoding (Watermarking, Stream Mixing, subtitles)
- Live Audio and Video Enhancement
- Live Recording
- Time Shifting (New)
- Live Screencapture
- Live Stream Moderation
- Intelligent Porn Detection
- Live Video Caster
- Relay
- Overview of Basic Fees for Value-Added Features
- Delayed Playback
- Standby Streams
- Real-Time Log Shipping
- Prepaid plan
- Purchase Process
- Changing Billing Modes
- Refund Policy
- Viewing Bills
- Renewal
- Processing for Overdue Payments
- Billing FAQs
- Live Video Broadcasting (LVB)
- Live Event Broadcasting (LEB)
- Live Video Caster
- Console Guide
- Console Overview
- Overview
- Domain Management
- Adding Domain Names
- Push Domain Name Management
- Push Configuration
- Recording Configuration
- Time Shifting Configuration
- Screencapture and Porn Detection Configuration
- Watermark Configuration
- Callback Configuration
- Standby Stream Configuration
- Latency Control
- IP Blocklist/Allowlist Configuration
- Delayed Playback
- Moderation Configuration
- Remote Authentication Configuration
- Playback Domain Name Management
- Playback Configuration
- Playback Authentication Configuration
- Referer Configuration
- Template Configuration
- HTTPS Configuration
- Region Configuration
- Origin Server Configuration
- Bandwidth Cap Configuration
- IP Blocklist/Allowlist Configuration
- Blocking Playback by Protocol
- Latency Control
- HTTP Response Header Configuration
- Access control by region Configuration
- Remote Authentication Configuration
- Certificate Management
- Stream Management
- Package Management
- Feature Configuration
- Relay
- Billing Usage Statistics
- Monitoring
- Toolkit
- OOTB live
- CAM-Based Access Control
- Feature Guide
- Push and Playback
- Features
- Live Streaming Security
- Global CSS Service
- Callback Notifications
- How to Receive Event Notification
- Stream Pushing Notification
- Recording Event Notification
- Recording Status Event Notification
- Screencapturing Event Notification
- Live Broadcasting Image Audit Event Notification
- Live Streaming Audio Auditing Service Event Notification
- Push Error Event Notifications
- Relay Event Notification
- User Guides for Common Third-Party Tools
- SDK Guide
- API Documentation
- History
- Introduction
- API Category
- Making API Requests
- Live Transcoding APIs
- Delayed Playback Management APIs
- Domain Name Management APIs
- Watermark Management APIs
- Certificate Management APIs
- Live Stream Mix APIs
- Stream Pulling APIs
- Recording Management APIs
- Time Shifting APIs
- Live Callback APIs
- Screencapturing and Porn Detection APIs
- Authentication Management APIs
- Monitoring Data Query APIs
- DescribeAllStreamPlayInfoList
- DescribeGroupProIspPlayInfoList
- DescribeHttpStatusInfoList
- DescribeLiveDomainPlayInfoList
- DescribeLiveStreamPushInfoList
- DescribeLiveTranscodeDetailInfo
- DescribePlayErrorCodeDetailInfoList
- DescribePlayErrorCodeSumInfoList
- DescribeProIspPlaySumInfoList
- DescribeProvinceIspPlayInfoList
- DescribeStreamDayPlayInfoList
- DescribeStreamPlayInfoList
- DescribeStreamPushInfoList
- DescribeTopClientIpSumInfoList
- DescribeVisitTopSumInfoList
- Billing Data Query APIs
- Live Stream Management APIs
- Data Types
- Error Codes
- Ops Guide
- Troubleshooting
- About Pushing
- Playing Method
- Live Streaming Quiz
- FAQs
- SLA
- CSS Policy
- Glossary
Billing usage statistics
In the CSS console, you can view your usage of LVB and LEB, including upstream and playback traffic/bandwidth, live recording, live transcoding, live screencapture, mic connect, relay, etc., in the last month in Statistics > Billing Usage Statistics.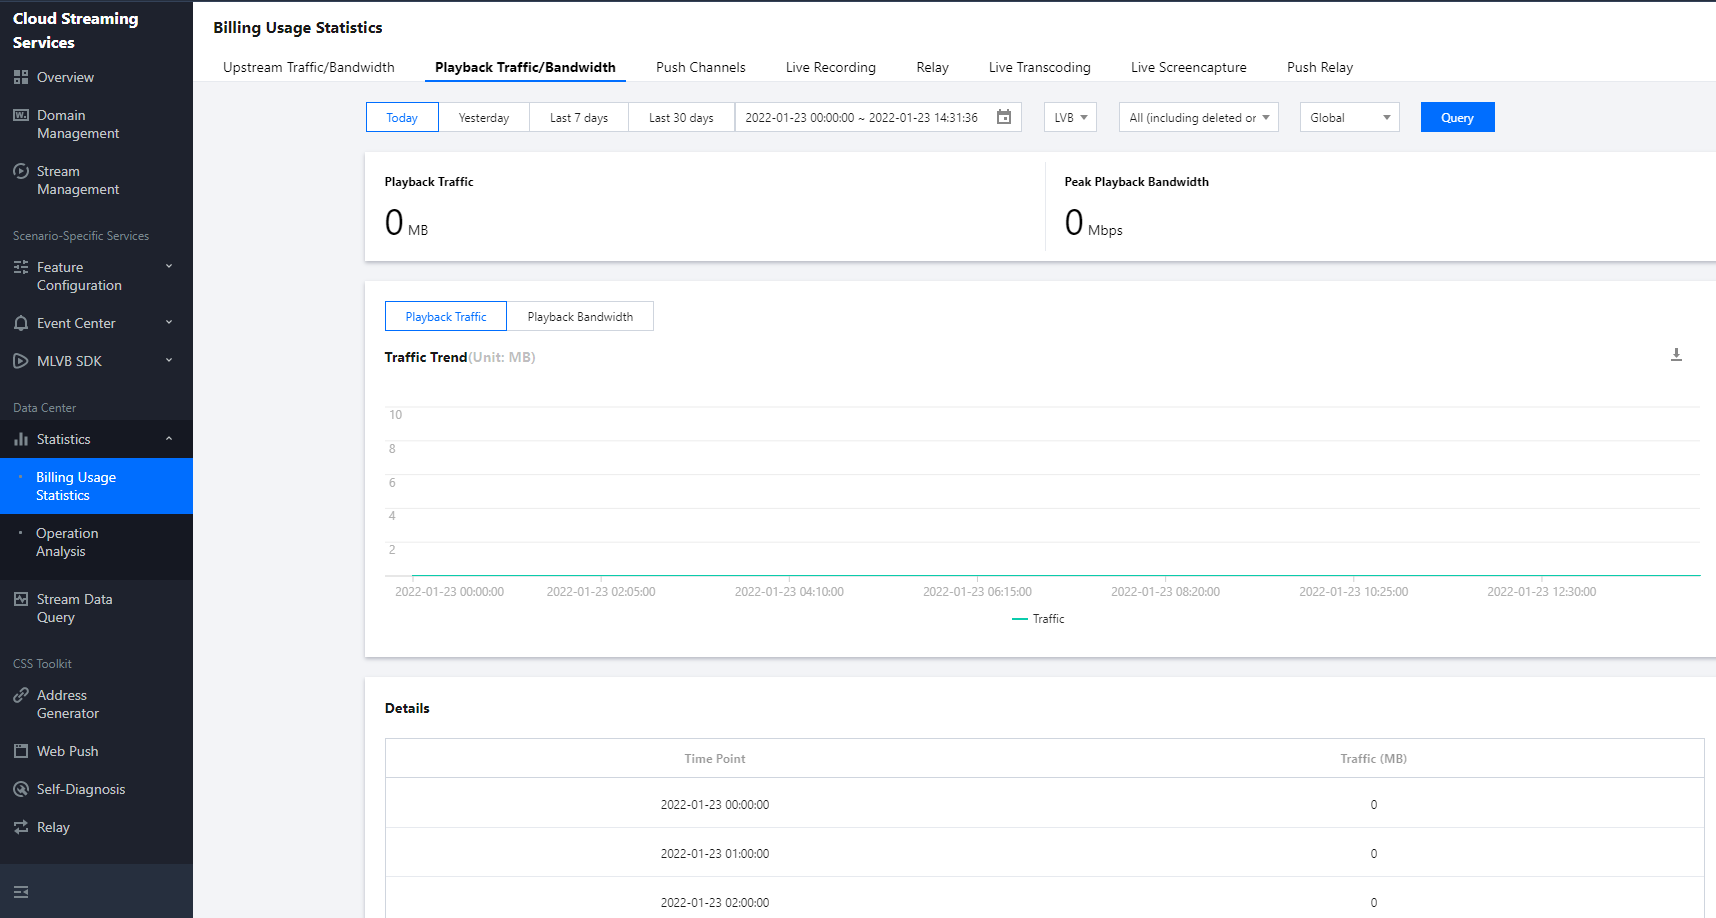
Billing details
| Billable Service | Statistical Item | Description |
|---|---|---|
| Upstream traffic/bandwidth | ||
| Upstream traffic | Upstream traffic consumed for push during the selected time range | |
| Peak upstream bandwidth | Peak bandwidth used for push during the selected time range | |
| Upstream traffic/bandwidth line chart | Upstream traffic/bandwidth usage on a 5-minute basis | |
| Playback traffic/bandwidth | ||
| Playback traffic | Downstream traffic consumed for playback during the selected time range | |
| Peak playback bandwidth | Peak bandwidth used for playback during the selected time range | |
| Playback traffic/bandwidth line chart | Downstream traffic/bandwidth usage on a 5-minute basis. You can choose to view the usage of LVB or LEB. | |
| Push channels | ||
| Current channels | Number of push channels at the time of query | |
| Peak channels | Highest number of concurrent push channels during the selected time range | |
| Push channel line chart | Number of push channels on a 5-minute basis | |
| Live recording | ||
| Recording channel peak | Highest number of concurrent recording channels during the selected time range | |
| Recording channel line chart | Highest number of concurrent recording channels on a 5-minute basis | |
| Relay | ||
| Total duration | Total duration of relay tasks during the selected time range | |
| Relay task duration line chart | Relay task durations on a 5-minute basis | |
| Live transcoding | ||
| Total transcoding duration | Total transcoding duration during the selected time range | |
| Transcoding duration line chart | Transcoding durations on a 5-minute basis | |
| Live screencapture | ||
| Accumulated screenshots | Total number of screenshots taken during the selected time range | |
| Screenshot number line chart | Number of screenshots on a 5-minute basis | |
| Push relay | ||
| Peak bandwidth | Peak bandwidth used for relay during the selected time range | |
| Push relay bandwidth line chart | Peak bandwidth used for relay on a 5-minute basis |
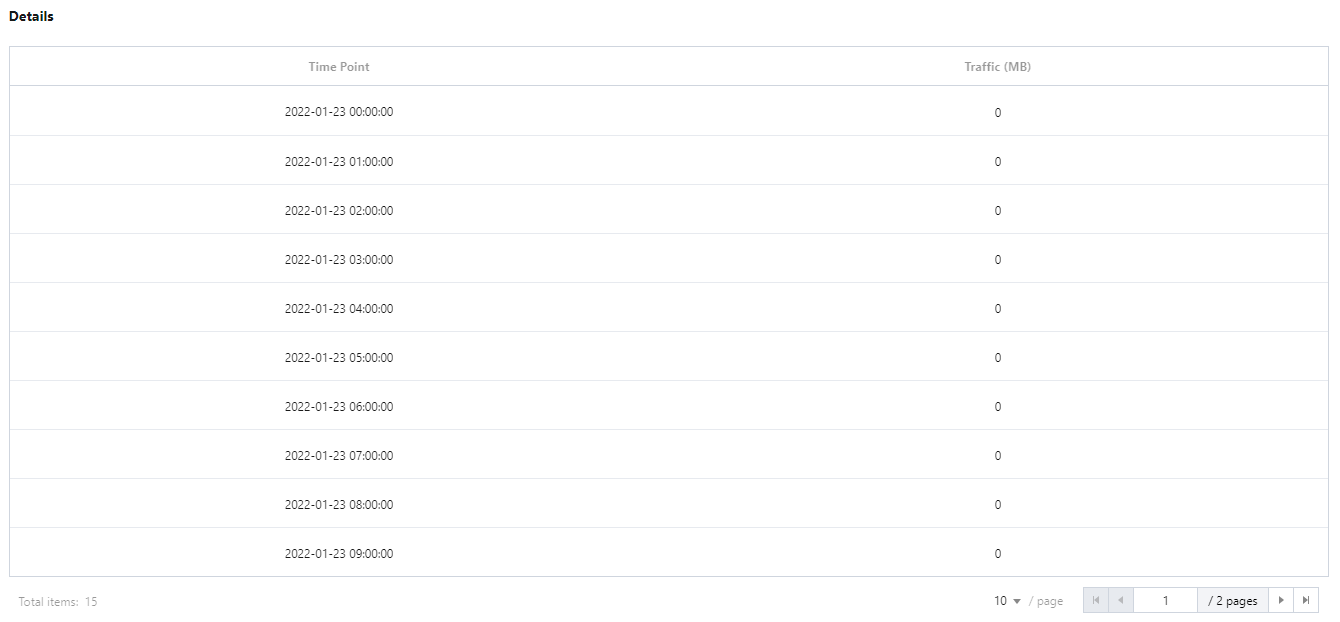
Details
You can view your upstream and playback traffic/bandwidth usage of a specific time point in the last 30 days.
Monthly usage details
Under the Live Screencapture tab, you can view your Monthly Usage of live screencapture and download the statistics of a specific month in the last 6 months by clicking Export Details.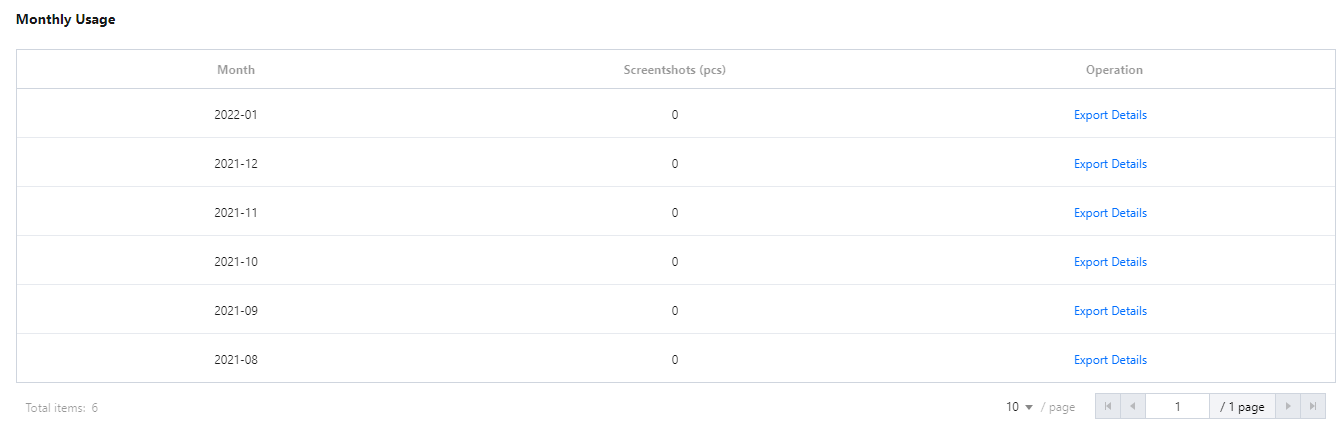
Usage in last 30 days
Under the Live Transcoding tab, you can view your usage of live transcoding in the last 30 days, including start time, end time, duration, codec, bitrate, and transcoding type.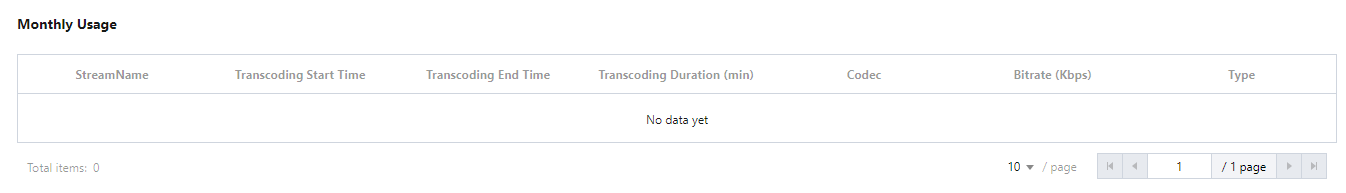

 Yes
Yes
 No
No
Was this page helpful?