Cluster resources may be deleted or modified in the case of misoperations, application bugs, or apiserver API calls from malicious programs. You can use the cluster audit feature to keep logs of apiserver API calls. In this way, you can search and analyze audit logs to find the causes of problems. This document describes how to use the cluster audit feature for troubleshooting.
Note
This document applies to only TKE clusters.
Prerequisites
You have enabled the cluster audit feature in the TKE console. For more information, see Enabling cluster audit.
2. On the Search and Analysis page, select the logset and log topic to search and a time scope.
3. Enter an analysis statement and click Search and Analysis to obtain the analysis result.
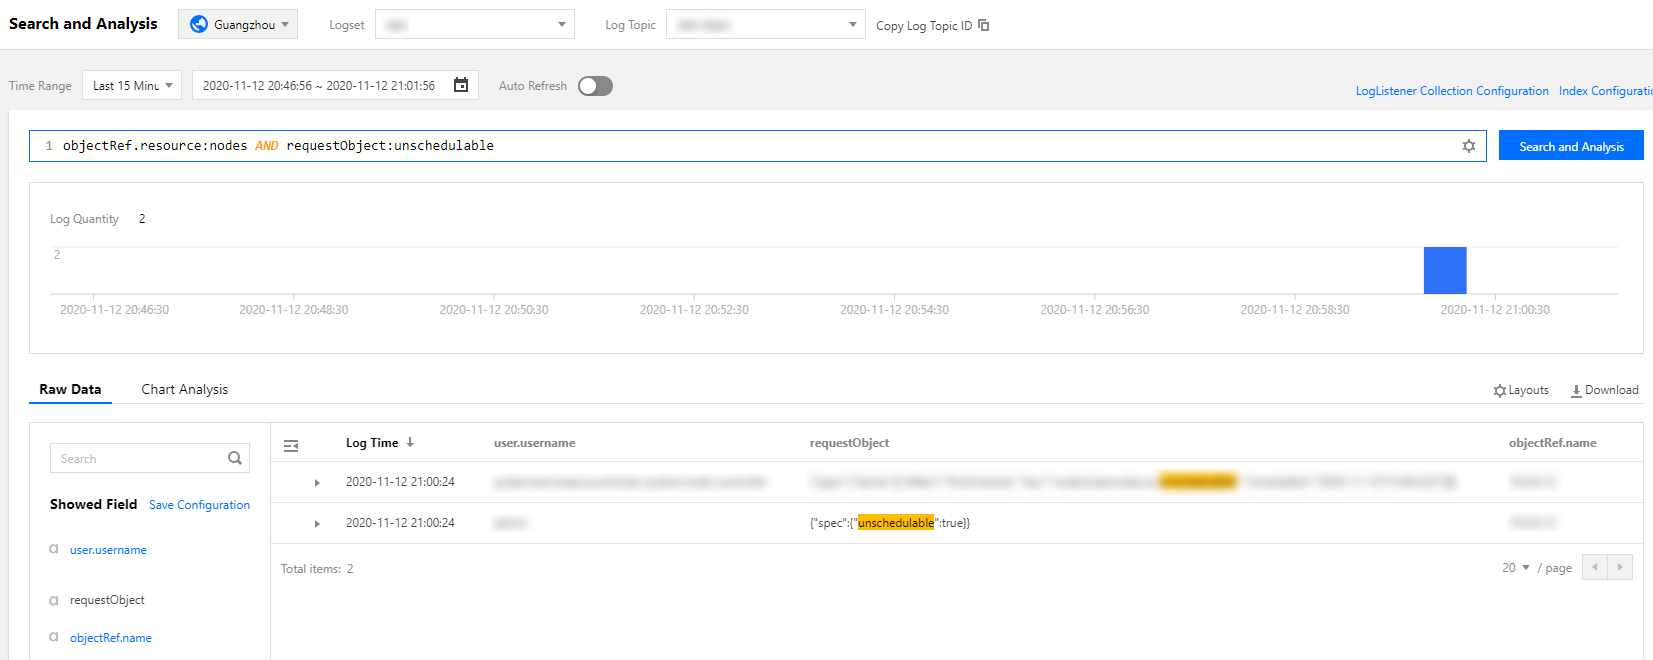
Example 1: querying the operator who cordoned a node
To query the operator who cordoned a node, run the following command:
objectRef.resource:nodes AND requestObject:unschedulable
On the Search and Analysis page, select Default Configuration for the layout. The following figure shows the query result:
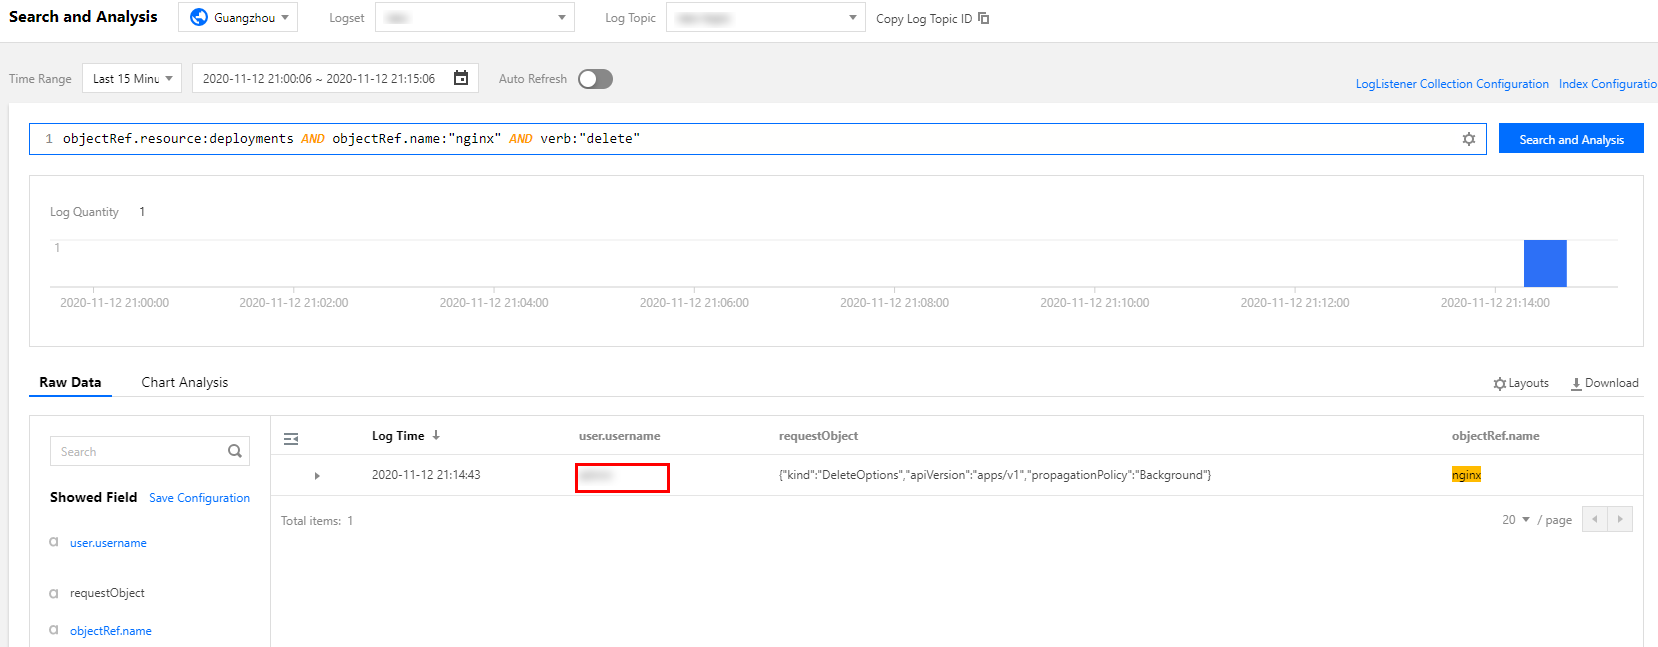
Example 2: querying the operator who deleted a workload
To query the operator who deleted a workload, run the following command:
objectRef.resource:deployments AND objectRef.name:"nginx" AND verb:"delete"
You can obtain detailed information about the operator sub-account from the query result.
.
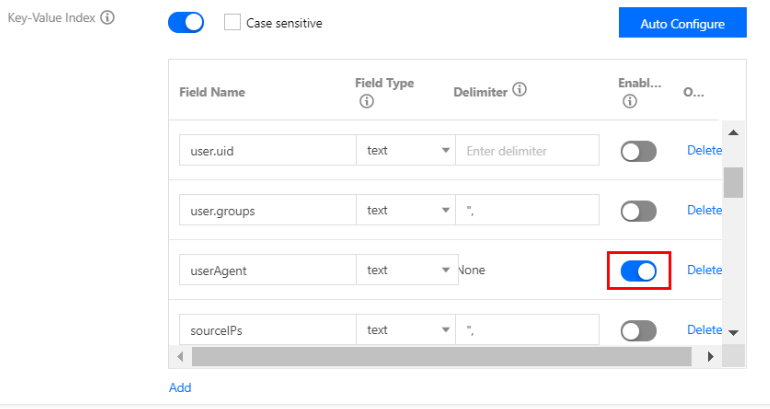
Example 3: locating the causes of apiserver access limitation
To prevent apiserver/etcd from being overloaded due to frequent apiserver access caused by malicious programs or bugs, apiserver enables an access limit mechanism by default. If the access limit is reached, you can identify the clients that have sent large numbers of requests through audit logs.
1. If you need to analyze clients that send requests based on userAgent, modify the log topic in the Key-Value Index window and collect statistics based on the userAgent field, as shown below:
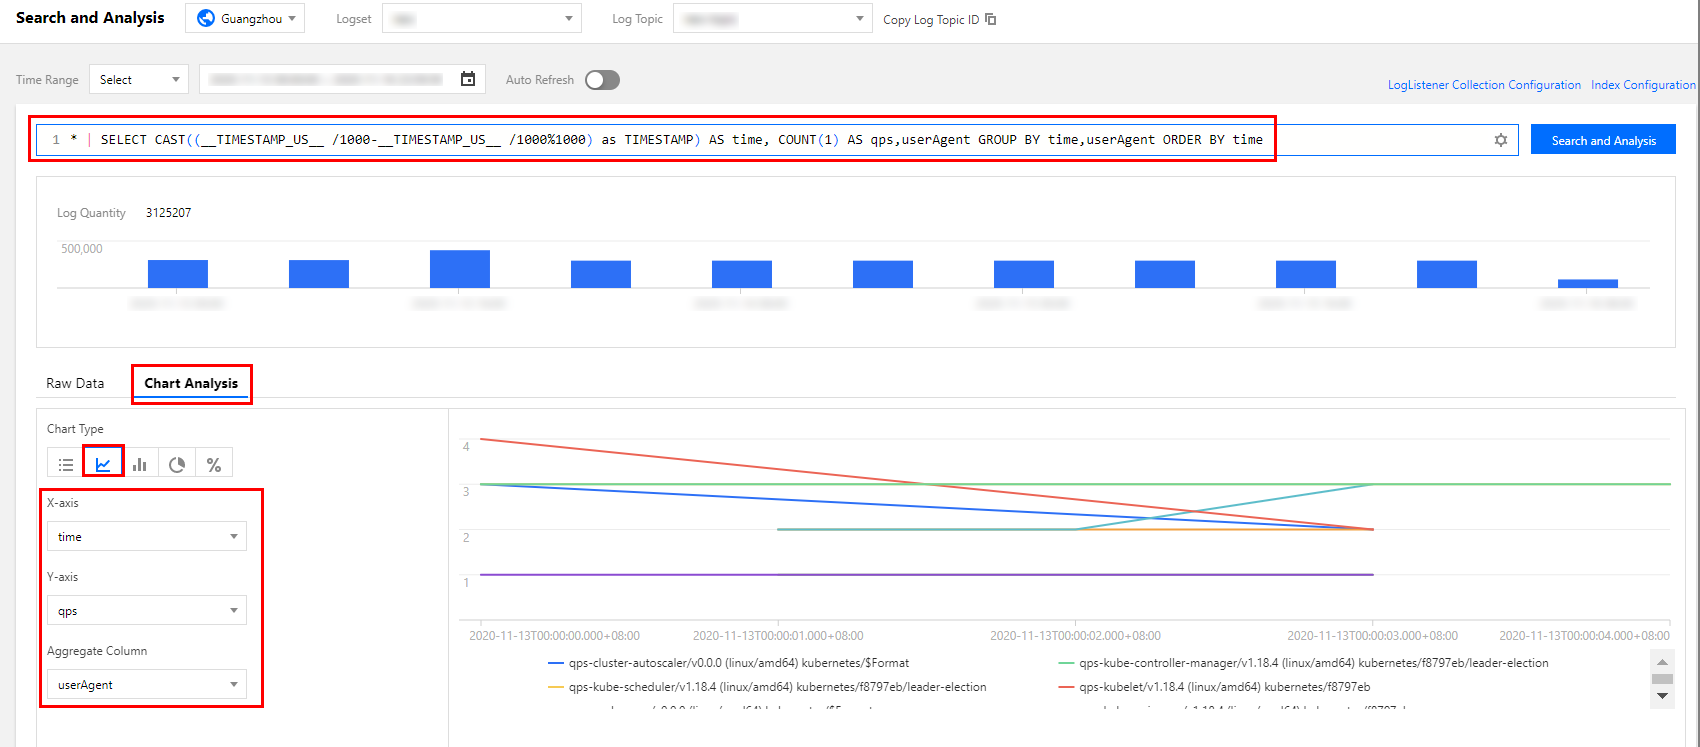
2. Run the following command to collect QPS statistics from each client to the apiserver:
* | SELECT histogram( cast(__TIMESTAMP__ as timestamp),interval 1 minute) AS time, COUNT(1) AS qps,userAgent GROUP BY time,userAgent ORDER BY time
3. Switch to the statistical chart and select the sequence diagram. Specify the basic information and coordinate axes, as shown below:
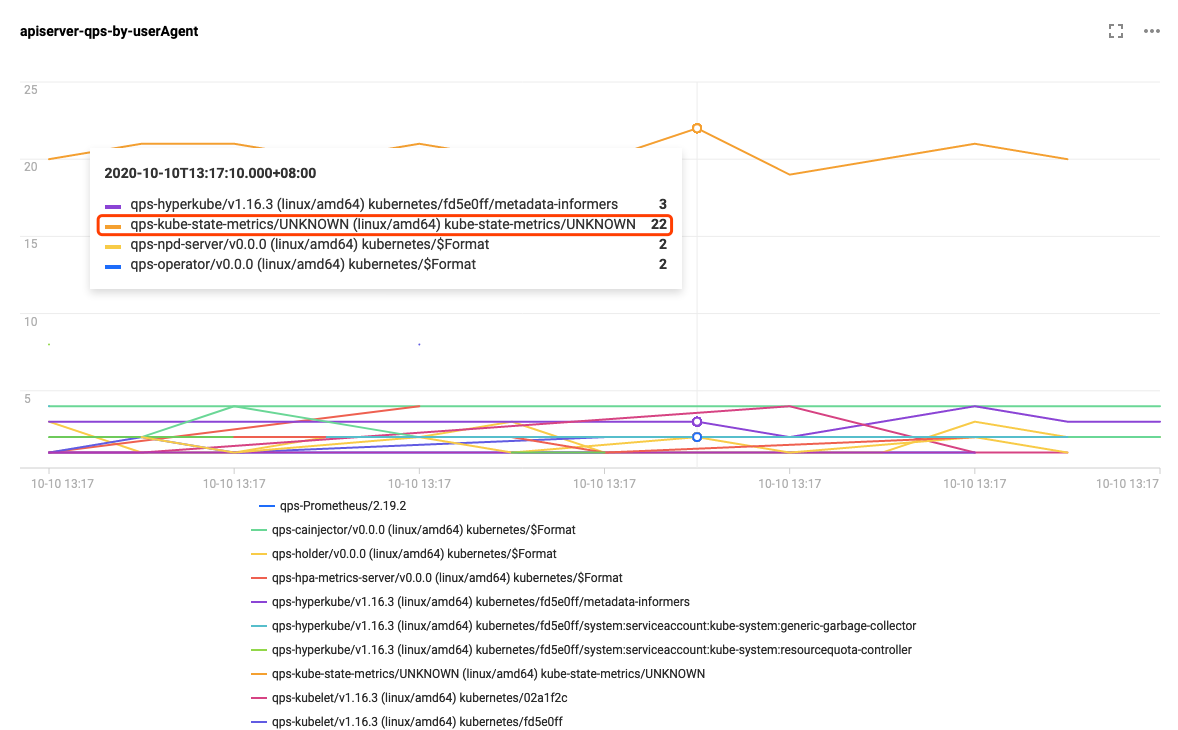
You can click specific statistics to add the statistics to the dashboard for zoomed-in display, as shown below:
As can be seen in the figure above, the client kube-state-metrics sends far more requests than the other clients. According to the logs, kube-state-metrics frequently sends requests to the apiserver due to RBAC permission issues. As a result, the apiserver access limit is triggered. The logs involved are as follows:
I1009 13:13:09.760767 1 request.go:538] Throttling request took 1.393921018s, request: GET:https://172.16.252.1:443/api/v1/endpoints?limit=500&resourceVersion=1029843735
E1009 13:13:09.766106 1 reflector.go:156] pkg/mod/k8s.io/client-go@v0.0.0-20191109102209-3c0d1af94be5/tools/cache/reflector.go:108: Failed to list *v1.Endpoints: endpoints is forbidden: User "system:serviceaccount:monitoring:kube-state-metrics" cannot list resource "endpoints"in API group "" at the cluster scope
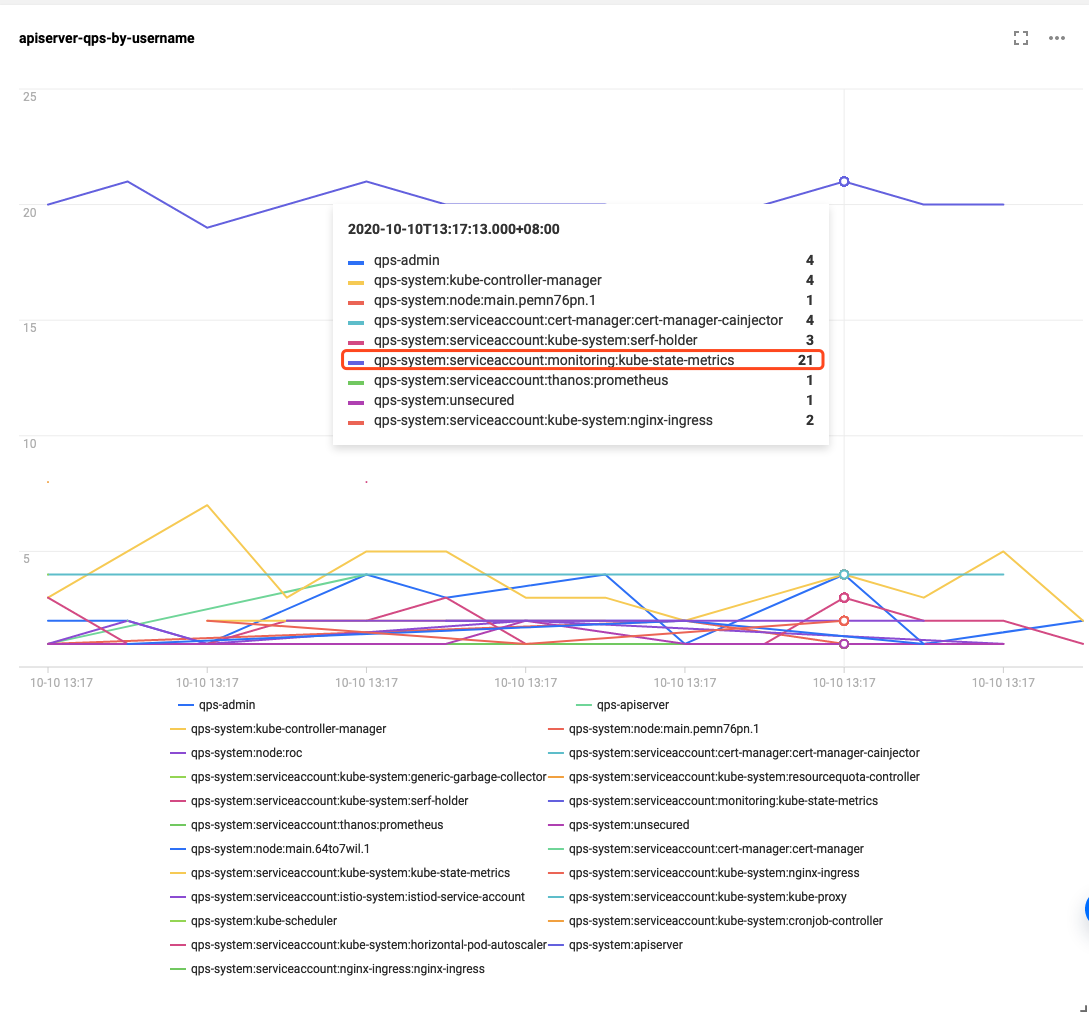
To use other fields, such as user.username, to distinguish the clients to collect data on, you can modify the SQL statement as required. An example SQL statement is as follows:
* | SELECT histogram( cast(__TIMESTAMP__ as timestamp),interval 1 minute) AS time, COUNT(1) AS qps,user.username GROUP BY time,user.username ORDER BY time
The following figure shows the display result:
References
For more information about the TKE cluster audit feature and basic operations, see Cluster Audit.
Cluster audit data is stored in CLS. To query and analyze audit data in the CLS console, see Syntax Rules for the search syntax.
To analyze audit data, an SQL statement supported by CLS is required. For more information, see Overview.