- Release Notes and Announcements
- Release Notes
- Announcements
- qGPU Service Adjustment
- Version Upgrade of Master Add-On of TKE Managed Cluster
- Upgrading tke-monitor-agent
- Discontinuing TKE API 2.0
- Instructions on Cluster Resource Quota Adjustment
- Discontinuing Kubernetes v1.14 and Earlier Versions
- Deactivation of Scaling Group Feature
- Notice on TPS Discontinuation on May 16, 2022 at 10:00 (UTC +8)
- Basic Monitoring Architecture Upgrade
- Starting Charging on Managed Clusters
- Instructions on Stopping Delivering the Kubeconfig File to Nodes
- Security Vulnerability Fix Description
- Release Notes
- Product Introduction
- Purchase Guide
- Quick Start
- TKE General Cluster Guide
- TKE General Cluster Overview
- Purchase a TKE General Cluster
- High-risk Operations of Container Service
- Deploying Containerized Applications in the Cloud
- Kubernetes API Operation Guide
- Open Source Components
- Permission Management
- Cluster Management
- Cluster Overview
- Cluster Hosting Modes Introduction
- Cluster Lifecycle
- Creating a Cluster
- Deleting a Cluster
- Cluster Scaling
- Changing the Cluster Operating System
- Connecting to a Cluster
- Upgrading a Cluster
- Enabling IPVS for a Cluster
- Enabling GPU Scheduling for a Cluster
- Custom Kubernetes Component Launch Parameters
- Using KMS for Kubernetes Data Source Encryption
- Images
- Worker node introduction
- Normal Node Management
- Native Node Management
- Overview
- Purchasing Native Nodes
- Lifecycle of a Native Node
- Native Node Parameters
- Creating Native Nodes
- Deleting Native Nodes
- Self-Heal Rules
- Declarative Operation Practice
- Native Node Scaling
- In-place Pod Configuration Adjustment
- Enabling SSH Key Login for a Native Node
- Management Parameters
- Enabling Public Network Access for a Native Node
- Supernode management
- Registered Node Management
- GPU Share
- Kubernetes Object Management
- Overview
- Namespace
- Workload
- Deployment Management
- StatefulSet Management
- DaemonSet Management
- Job Management
- CronJob Management
- Setting the Resource Limit of Workload
- Setting the Scheduling Rule for a Workload
- Setting the Health Check for a Workload
- Setting the Run Command and Parameter for a Workload
- Using a Container Image in a TCR Enterprise Instance to Create a Workload
- Auto Scaling
- Configuration
- Register node management
- Service Management
- Ingress Management
- Storage Management
- Application and Add-On Feature Management Description
- Add-On Management
- Add-on Overview
- Add-On Lifecycle Management
- CBS-CSI Description
- UserGroupAccessControl
- COS-CSI
- CFS-CSI
- P2P
- OOMGuard
- TCR Introduction
- TCR Hosts Updater
- DNSAutoscaler
- NodeProblemDetectorPlus Add-on
- NodeLocalDNSCache
- Network Policy
- DynamicScheduler
- DeScheduler
- Nginx-ingress
- HPC
- Description of tke-monitor-agent
- GPU-Manager Add-on
- CFSTURBO-CSI
- tke-log-agent
- Helm Application
- Application Market
- Network Management
- Container Network Overview
- GlobalRouter Mode
- VPC-CNI Mode
- VPC-CNI Mode
- Multiple Pods with Shared ENI Mode
- Pods with Exclusive ENI Mode
- Static IP Address Mode Instructions
- Non-static IP Address Mode Instructions
- Interconnection Between VPC-CNI and Other Cloud Resources/IDC Resources
- Security Group of VPC-CNI Mode
- Instructions on Binding an EIP to a Pod
- VPC-CNI Component Description
- Limits on the Number of Pods in VPC-CNI Mode
- Cilium-Overlay Mode
- OPS Center
- Log Management
- Backup Center
- Cloud Native Monitoring
- Remote Terminals
- TKE Serverless Cluster Guide
- TKE Edge Cluster Guide
- TKE Registered Cluster Guide
- TKE Container Instance Guide
- Cloud Native Service Guide
- Best Practices
- Cluster
- Cluster Migration
- Serverless Cluster
- Edge Cluster
- Security
- Service Deployment
- Hybrid Cloud
- Network
- DNS
- Using Network Policy for Network Access Control
- Deploying NGINX Ingress on TKE
- Nginx Ingress High-Concurrency Practices
- Nginx Ingress Best Practices
- Limiting the bandwidth on pods in TKE
- Directly connecting TKE to the CLB of pods based on the ENI
- Use CLB-Pod Direct Connection on TKE
- Obtaining the Real Client Source IP in TKE
- Using Traefik Ingress in TKE
- Release
- Logs
- Monitoring
- OPS
- Removing and Re-adding Nodes from and to Cluster
- Using Ansible to Batch Operate TKE Nodes
- Using Cluster Audit for Troubleshooting
- Renewing a TKE Ingress Certificate
- Using cert-manager to Issue Free Certificates
- Using cert-manager to Issue Free Certificate for DNSPod Domain Name
- Using the TKE NPDPlus Plug-In to Enhance the Self-Healing Capability of Nodes
- Using kubecm to Manage Multiple Clusters kubeconfig
- Quick Troubleshooting Using TKE Audit and Event Services
- Customizing RBAC Authorization in TKE
- Clearing De-registered Tencent Cloud Account Resources
- Terraform
- DevOps
- Auto Scaling
- Cluster Auto Scaling Practices
- Using tke-autoscaling-placeholder to Implement Auto Scaling in Seconds
- Installing metrics-server on TKE
- Using Custom Metrics for Auto Scaling in TKE
- Utilizing HPA to Auto Scale Businesses on TKE
- Using VPA to Realize Pod Scaling up and Scaling down in TKE
- Adjusting HPA Scaling Sensitivity Based on Different Business Scenarios
- Storage
- Containerization
- Microservice
- Cost Management
- Fault Handling
- Disk Full
- High Workload
- Memory Fragmentation
- Cluster DNS Troubleshooting
- Cluster kube-proxy Troubleshooting
- Cluster API Server Inaccessibility Troubleshooting
- Service and Ingress Inaccessibility Troubleshooting
- Troubleshooting for Pod Network Inaccessibility
- Pod Status Exception and Handling
- Authorizing Tencent Cloud OPS Team for Troubleshooting
- Engel Ingres appears in Connechtin Reverside
- CLB Loopback
- CLB Ingress Creation Error
- API Documentation
- History
- Introduction
- API Category
- Making API Requests
- Cluster APIs
- DescribeEncryptionStatus
- DisableEncryptionProtection
- EnableEncryptionProtection
- AcquireClusterAdminRole
- CreateClusterEndpoint
- CreateClusterEndpointVip
- DeleteCluster
- DeleteClusterEndpoint
- DeleteClusterEndpointVip
- DescribeAvailableClusterVersion
- DescribeClusterAuthenticationOptions
- DescribeClusterCommonNames
- DescribeClusterEndpointStatus
- DescribeClusterEndpointVipStatus
- DescribeClusterEndpoints
- DescribeClusterKubeconfig
- DescribeClusterLevelAttribute
- DescribeClusterLevelChangeRecords
- DescribeClusterSecurity
- DescribeClusterStatus
- DescribeClusters
- DescribeEdgeAvailableExtraArgs
- DescribeEdgeClusterExtraArgs
- DescribeResourceUsage
- DisableClusterDeletionProtection
- EnableClusterDeletionProtection
- GetClusterLevelPrice
- GetUpgradeInstanceProgress
- ModifyClusterAttribute
- ModifyClusterAuthenticationOptions
- ModifyClusterEndpointSP
- UpgradeClusterInstances
- CreateCluster
- UpdateClusterVersion
- UpdateClusterKubeconfig
- DescribeBackupStorageLocations
- DeleteBackupStorageLocation
- CreateBackupStorageLocation
- Add-on APIs
- Network APIs
- Node APIs
- Node Pool APIs
- TKE Edge Cluster APIs
- DescribeTKEEdgeScript
- DescribeTKEEdgeExternalKubeconfig
- DescribeTKEEdgeClusters
- DescribeTKEEdgeClusterStatus
- DescribeTKEEdgeClusterCredential
- DescribeEdgeClusterInstances
- DescribeEdgeCVMInstances
- DescribeECMInstances
- DescribeAvailableTKEEdgeVersion
- DeleteTKEEdgeCluster
- DeleteEdgeClusterInstances
- DeleteEdgeCVMInstances
- DeleteECMInstances
- CreateTKEEdgeCluster
- CreateECMInstances
- CheckEdgeClusterCIDR
- ForwardTKEEdgeApplicationRequestV3
- UninstallEdgeLogAgent
- InstallEdgeLogAgent
- DescribeEdgeLogSwitches
- CreateEdgeLogConfig
- CreateEdgeCVMInstances
- UpdateEdgeClusterVersion
- DescribeEdgeClusterUpgradeInfo
- Cloud Native Monitoring APIs
- Virtual node APIs
- Other APIs
- Scaling group APIs
- Data Types
- Error Codes
- API Mapping Guide
- TKE Insight
- TKE Scheduling
- FAQs
- Service Agreement
- Contact Us
- Purchase Channels
- Glossary
- User Guide(Old)
NoteTencent Prometheus Service (TPS) has been integrated into TMP, which supports cross-region monitoring in multiple VPCs, and provides a unified Grafana dashboard, allowing for checking of multiple monitoring instances. For more information on TMP billing, see Pay-as-You-Go. For cloud resource usage details, see Billing Mode and Resource Usage. Free metrics for basic monitoring will not be billed.
TPS will be discontinued soon. Click here to try out TMP. TPS instances can no longer be created, but you can use our quick migration tool to migrate your TPS instances to TMP. Before the migration, streamline monitoring metrics or reduce the collection frequency; otherwise, higher costs may be incurred.
Overview
This document describes how to configure monitoring collection items for the associated cluster.
Prerequisites
Before configuring monitoring collection items, you need to perform the following operations:
- You've created a TMP instance.
- The cluster to be monitored has been associated with the corresponding instance as instructed in Associating with Cluster.
Directions
Configuring data collection
- Log in to the TKE console and click Cloud Native Monitoring in the left sidebar.
- On the instance list page, select the target instance to enter its details page.
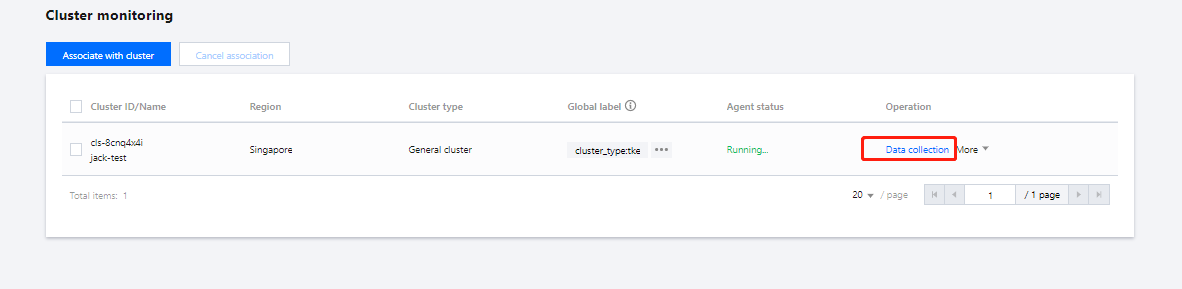
- On the Associate with cluster page, click Data collection on the right of the instance to enter the collection configuration list page.
- On the Data collection page, add the data collection configuration. The cloud native monitoring has preset some collection configuration files to collect regular monitoring data. You can configure new data collection rules to monitor your business data by using the following two methods:
Monitoring service
- Click Add.
- In the Create collection policy pop-up window, enter the configuration information.
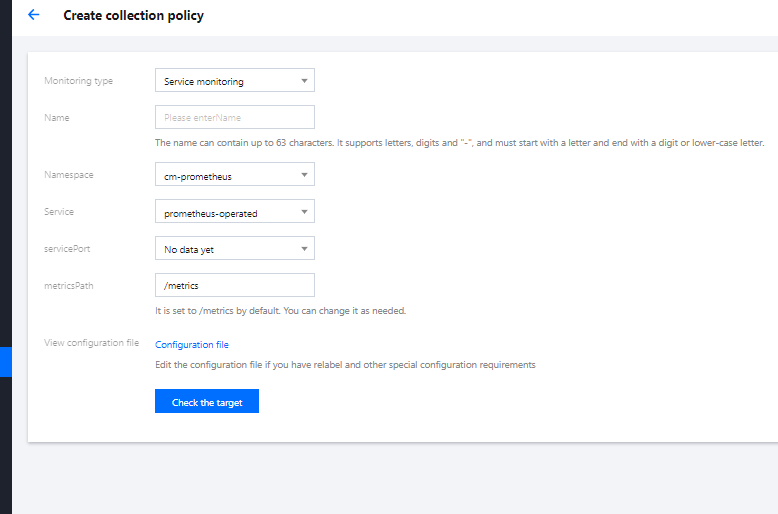
- Monitoring type: Select Service monitoring.
- Name: Enter the rule name.
- Namespace: Select the namespace to which the service belongs.
- Service: Select the service to be monitored.
- ServicePort: Select the corresponding port.
- MetricsPath: Defaults to
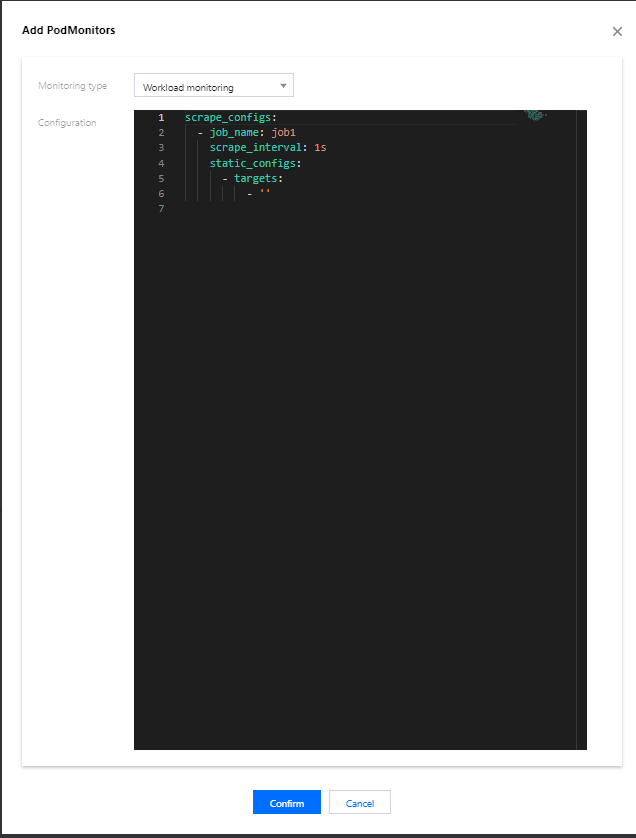
/metrics. You can directly enter the collection API as needed. - View configuration file: Click Configuration file to view the current configuration file. If you have special configuration requirements such as relabel, you can edit them in the configuration file.
- Check the target: Click Check the target to view a list of all targets that can be collected under the current collection policy, and confirm whether the collection policy meets your expectations.
Monitoring workload
- Click Add.
- In the Create collection policy pop-up window, enter the configuration information.
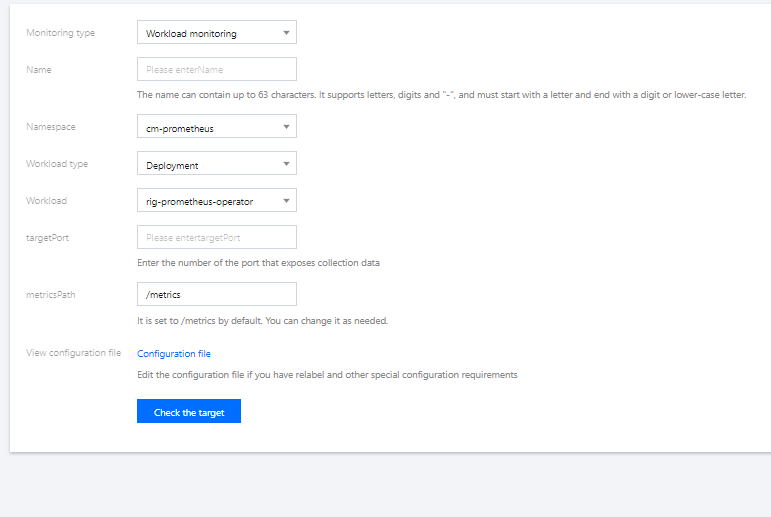
- Monitoring type: Select Workload monitoring.
- Name: Enter the rule name.
- Namespace: Select the namespace to which the workload belongs.
- Workload type: Select the workload type to be monitored.
- Workload: Select the workload to be monitored.
- targetPort: Enter the target port that exposes the collection metrics through which the collection target can be found. If the port is incorrect, the collection target will not be obtained correctly.
- MetricsPath: Defaults to
/metrics. You can directly enter the collection API as needed. - View configuration file: Click Configuration Ffile to view the current configuration file. If you have special configuration requirements such as relabel, you can edit them in the configuration file.
- Check the target: Click Check the target to view a list of all targets that can be collected under the current collection policy, and confirm whether the collection policy meets your expectations.
- Click OK.
- You can view the status of the collection target on the Data collection page of the instance.

targets (1/1) indicates one actually captured target/one checked collection target. When the number of actual captured targets equals to the number of checked targets, the status will be "up", which means that the current capture is normal. When the number of actual captured targets is less than the number of checked targets, the status will be "down", which means that some endpoints capture failed.
Click the field value (1/1) to view the details of the collection target.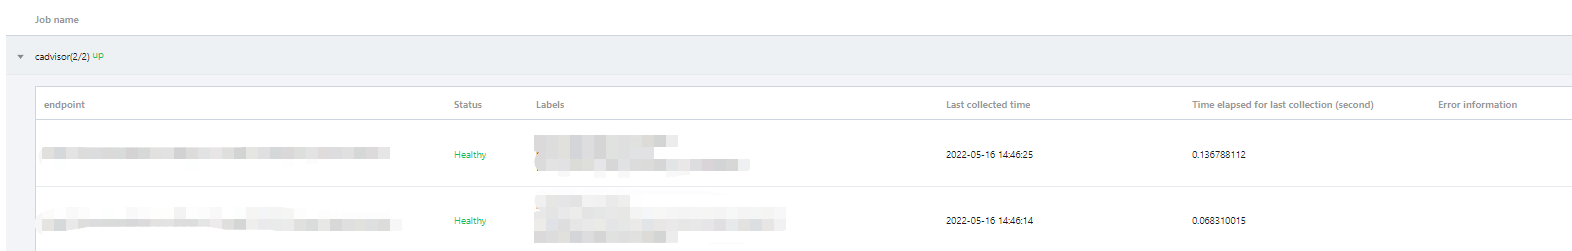
On the Associate with cluster tab of the instance, click More > Target Jobs on the right of the cluster name to view all the collection targets of this cluster.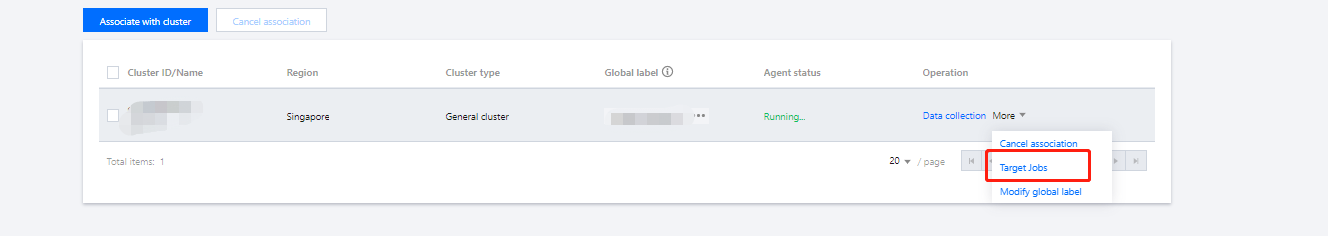
Viewing existing configuration
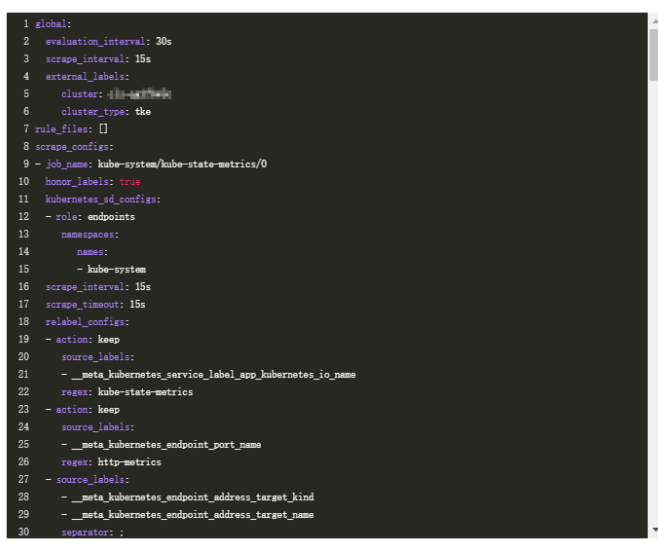
- Log in to the TKE console and click Cloud Native Monitoring in the left sidebar.
- On the instance list page, click View configuration in the upper-right corner.
- In the View configuration pop-up window, view all monitoring metrics configured in the yaml file.
Viewing collection targets
- Log in to the TKE console and click Cloud Native Monitoring in the left sidebar.
- On the instance list page, select the target instance to enter its details page.
- On the Associate with cluster tab, click Target Jobs on the right of the instance.
- On the targets list page, view the collection status of current data.
The endpoints in the status of "Unhealthy" are displayed at the top of the list by default. You can filter a target by resource attribute on the collection target page.
Related Operations
Mounting file to collector
When configuring the collection item, if you need to provide some files for the configuration, such as a certificate, you can mount the file to the collector in the following way, and the update of the file will be synchronized to the collector in real time.
prometheus.tke.tencent.cloud.com/scrape-mount = "true"
Add the above label to the configmap under theprom-xxxnamespace, and all the keys will be mounted to the collector path/etc/prometheus/configmaps/[configmap-name]/.prometheus.tke.tencent.cloud.com/scrape-mount = "true"
Add the above label to the secret under theprom-xxxnamespace, and all the keys will be mounted to the collector path/etc/prometheus/secrets/[secret-name]/.

 Yes
Yes
 No
No
Was this page helpful?