
Alarm records

Last updated: 2024-12-18 17:46:07
Overview
This document describes how to query the alarm history in cloud native monitoring.
Prerequisites
Before querying alarm history, you need to perform the following operations:
Create a TMP instance.
Associate the desired clusters with the TMP instance.
Configure the information to be collected.
Configure alarm rules.
Directions
1. Log in to the TKE console and select TMP on the left sidebar.
2. On the instance list page, select an instance name that needs to query alarm history to go to its details page.
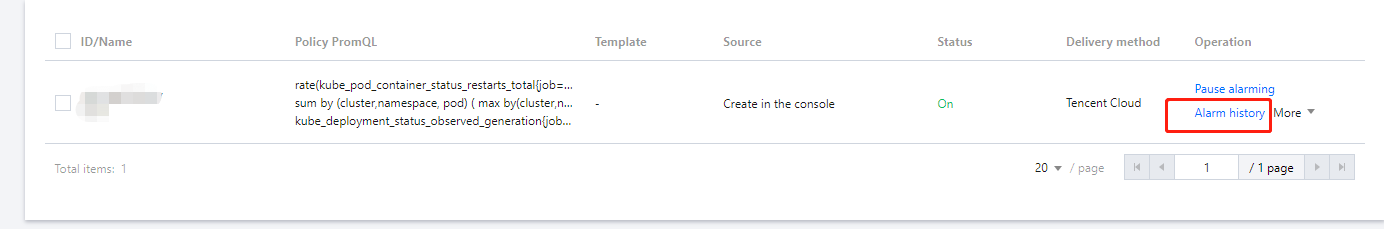
3. On the Alarm Configuration page, select Alarm history.
Was this page helpful?
You can also Contact Sales or Submit a Ticket for help.
Yes
No
Feedback