Release Notes
Announcements
Release Notes
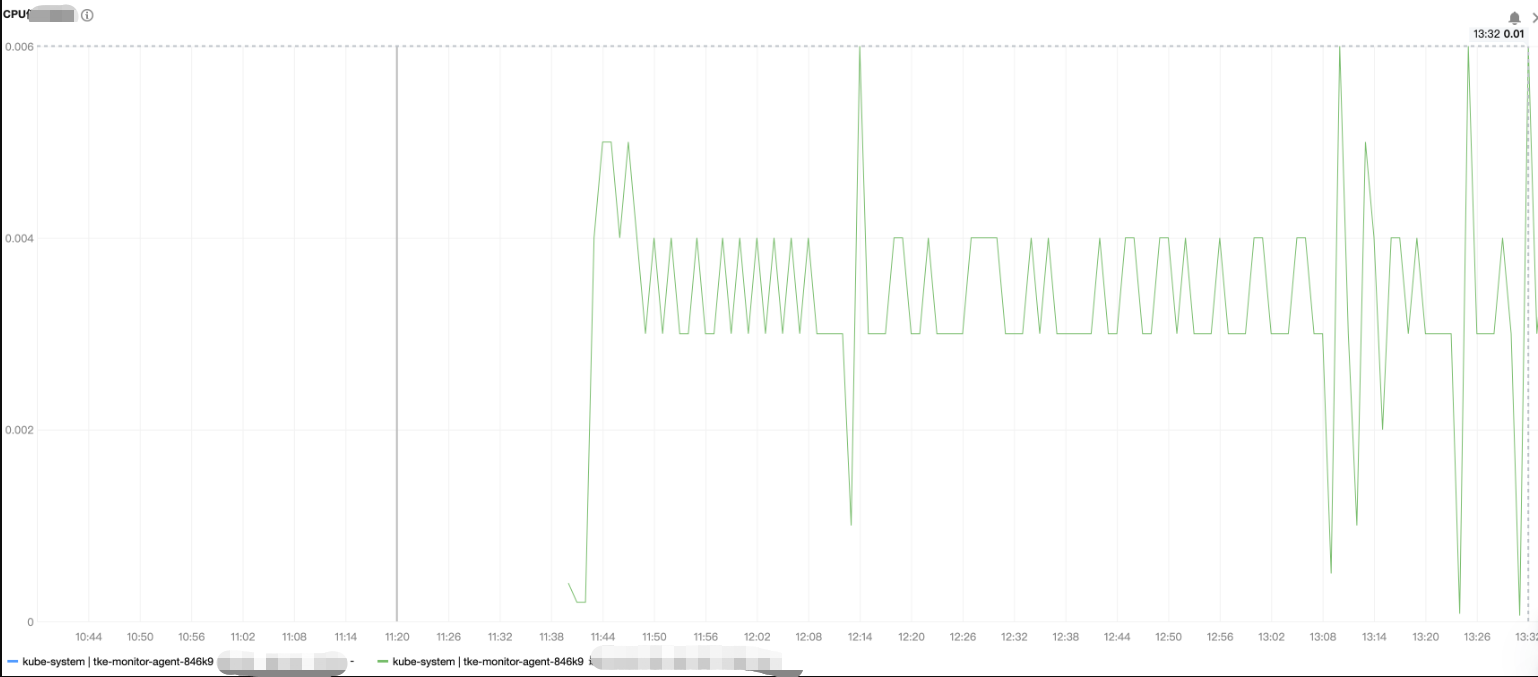
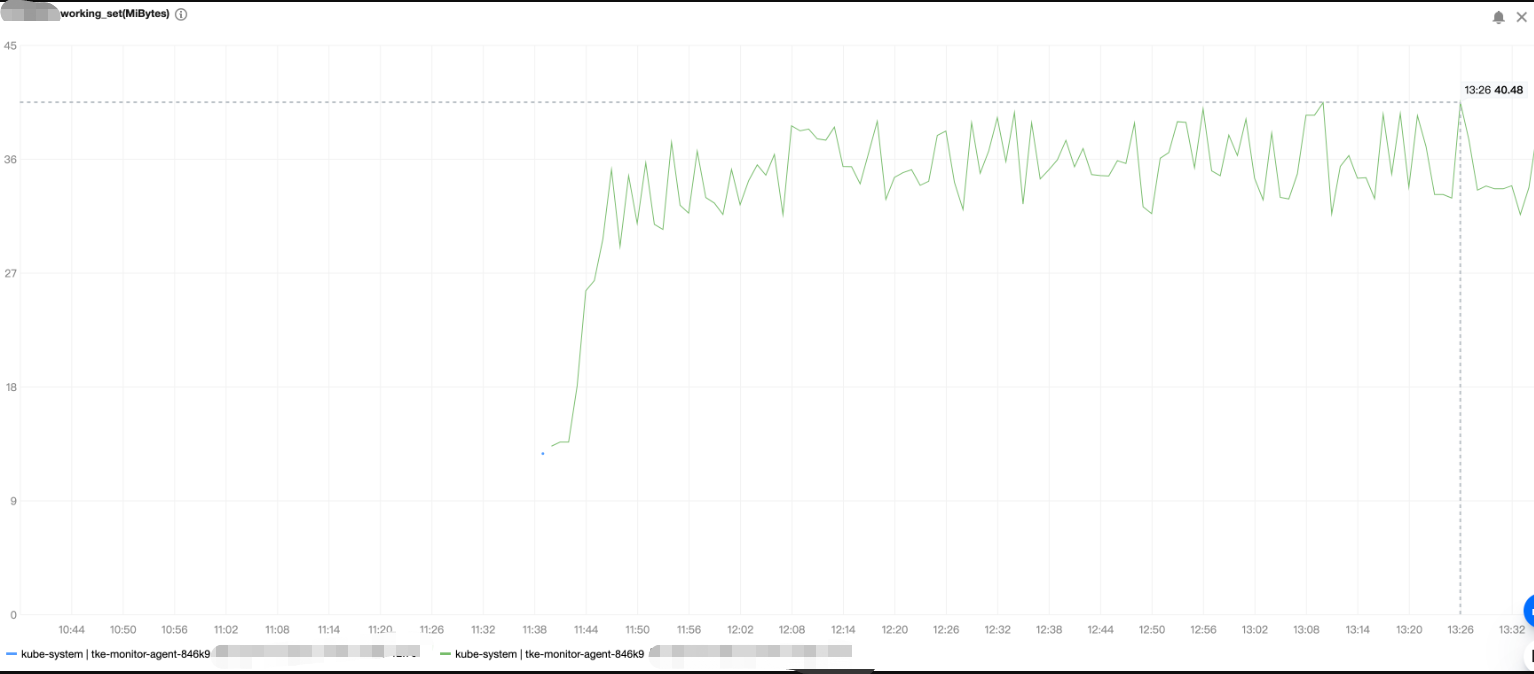
tke-monitor-agent is deployed under the kube-system namespace in the cluster, and the K8s resource objects of authentication and authorization are created, including ClusterRole, ServiceAccount, and ClusterRoleBinding. These resource objects are all named tke-monitor-agent.tke-monitor-agent DaemonSet is in the status of Pending, Evicted, OOMKilled or CrashLoopBackOff. The details of the status are as follows:tke-monitor-agent DaemonSet to 0. For more information, see Pod Remains in Pending.kubectl describe pod -n kube-system <podName> to check the cause according to the description in the Message field.kubectl describe pod -n kube-system <podName> to check the cause according to the description in the Events field.kubectl describe pod -n kube-system <podName> to check whether an OOM error occurs. If yes, you can increase the value of memory limits, which can't exceed 100 MB. If the error still occurs after the value is set to 100 MB, submit a ticket for assistance.kubectl describe pod -n kube-system <podName> to check the Events field. If Failed to create pod sandbox: rpc error: code = Unknown desc = failed to create a sandbox for pod "<pod name >": Error response from daemon: Failed to set projid for /data/docker/overlay2/xxx-init: no space left on device is displayed, the container data disk is full, and you can clear the data disk to restore it.tke-monitor-agent) is positively correlated with the number of Pods and containers running on the node. Below is a sample stress test with low MEM and CPU usage:
Data volume
220 Pods are deployed on a node, and each Pod contains three containers.
Resources consumedMEM (peak) | CPU (peak) |
About 40 MiB | 0.01C |


Feature | Involved Object | Involved Operation Permission |
It is required to gather the number of Pods and related information in the cluster. | ReplicaSets, Deployments, and Pods | list/watch |
Obtaining the metric information of cadvisor by visiting the /metrics port on the Kubelet of the node. | nodes, nodes/proxy, and nodes/metrics | list/watch/get |
Delivering metric data with cluster-monitor | services | list/watch |
Reporting metrics to HPA-Metrics-Server | custommetrics | update |
apiVersion: rbac.authorization.k8s.io/v1kind: ClusterRolemetadata:name: tke-monitor-agentrules:- apiGroups: ["apps"]resources: ["replicasets"]verbs: ["list", "watch"]- apiGroups: ["apps"]resources: ["deployments"]verbs: ["list", "watch"]- apiGroups: [""]resources: ["nodes", "nodes/proxy", "nodes/metrics"]verbs: ["list", "watch", "get"]- apiGroups: [""]resources: ["services"]verbs: ["list", "watch"]- apiGroups: [""]resources: ["pods"]verbs: ["list", "watch"]- apiGroups: ["monitor.tencent.io"]resources: ["custommetrics"]verbs: ["update"]
Was this page helpful?
You can also Contact sales or Submit a Ticket for help.
Help us improve! Rate your documentation experience in 5 mins.
Feedback