The multi-line - full regular expression mode is a log parsing mode where multiple key-value pairs can be extracted from a complete piece of log data that spans multiple lines in a log text file (such as Java program logs) based on a regular expression. If you don't need to extract key-value pairs, configure it as instructed in Collecting Logs with Full Text in Multi Lines.
When configuring the multi-line - full regular expression mode, you need to enter a sample log first and then customize your regular expression. After the configuration is completed, the system will extract the corresponding key-value pairs according to the capture group in the regular expression.
This document describes how to collect logs in multi-line - full regular expression mode.
Note:
To collect logs in multi-line - full regular expression mode, you need to upgrade to LogListener 2.4.5 as instructed in LogListener Installation Guide.
2. On the left sidebar, click Log Topic to go to the log topic management page.
Creating a log topic
1. Click Create Log Topic.
2. In the pop-up dialog box, enter test-multi as Log Topic Name and click Confirm.
Managing the machine group
1. After the log topic is created successfully, click its name to go to the log topic management page.
2. Click the Collection Configuration tab, click Add in LogListener Collection Configuration, and select the format in which you need to collect logs.
3. On the Machine Group Management page, select the server group to which to bind the current log topic and click Next to proceed to collection configuration.
For more information, see Machine Group Management.
Configuring collection
Configuring the log file collection path
On the Collection Configuration page, enter the collection rule name and enter the Collection Path according to the log collection path format.
Log collection path format: [directory prefix expression]/**/[filename expression].
After the log collection path is entered, LogListener will match all common prefix paths that meet the [directory prefix expression] rule and listen for all log files in the directories (including subdirectories) that meet the [filename expression] rule. The parameters are as detailed below:
Parameter
Description
Directory Prefix
Directory prefix for log files, which supports only the wildcard characters * and ?.
\\* indicates to match any multiple characters.
? indicates to match any single character.
/**/
Current directory and all its subdirectories.
File Name
Log file name, which supports only the wildcard characters * and ?.
In this example, the log path is configured as /var/log/nginx/**/access.log. LogListener will listen for log files named access.log in all subdirectories in the /var/log/nginx prefix path.
2.
/var/log/nginx
*.log
In this example, the log path is configured as /var/log/nginx/**/*.log. LogListener will listen for log files suffixed with .log in all subdirectories in the /var/log/nginx prefix path.
3.
/var/log/nginx
error*
In this example, the log path is configured as /var/log/nginx/**/error*. LogListener will listen for log files prefixed with error in all subdirectories in the /var/log/nginx prefix path.
Note:
Only LogListener 2.3.9 and later support adding multiple collection paths.
The system does not support uploading logs with contents in multiple text formats, which may cause write failures, such as key:"{"substream":XXX}".
We recommend you configure the collection path as log/*.log and rename the old file after log rotation as log/*.log.xxxx.
By default, a log file can only be collected by one log topic. If you want to have multiple collection configurations for the same file, add a soft link to the source file and add it to another collection configuration.
Configuring the collection policy
Full collection: When LogListener collects a file, it starts reading data from the beginning of the file.
Incremental collection: When LogListener collects a file, it collects only the newly added content in the file.
Configuring the multi-line - full regular expression mode
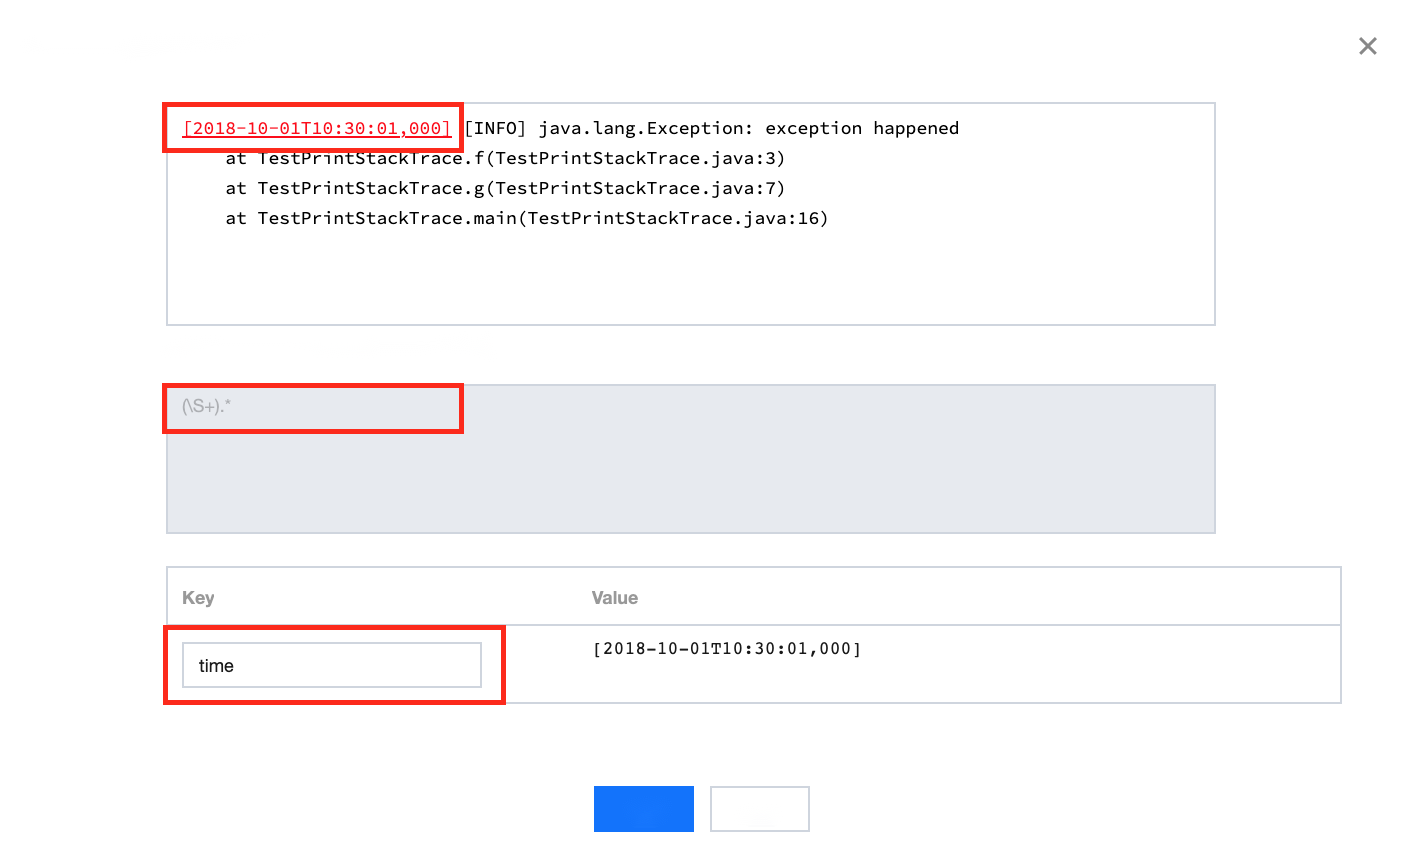
1. On the Collection Configuration page, set Extraction Mode to Multi-line - Full regular expression and enter a sample log in the Log Sample text box.
2. Define a regular expression according to the following rules.
You can choose Auto-Generate or Enter Manually to define a first-line regular expression in order to determine the boundary for multi-line logs. After the expression is verified successfully, the system will determine the number of logs that match the first-line regular expression.
Auto-Generate: Click Auto-Generate, and the system will automatically generate the first-line regular expression in the grayed-out text box.
Enter Manually: In the text box, enter the first-line regular expression, click Verify, and the system will determine whether the expression has passed.
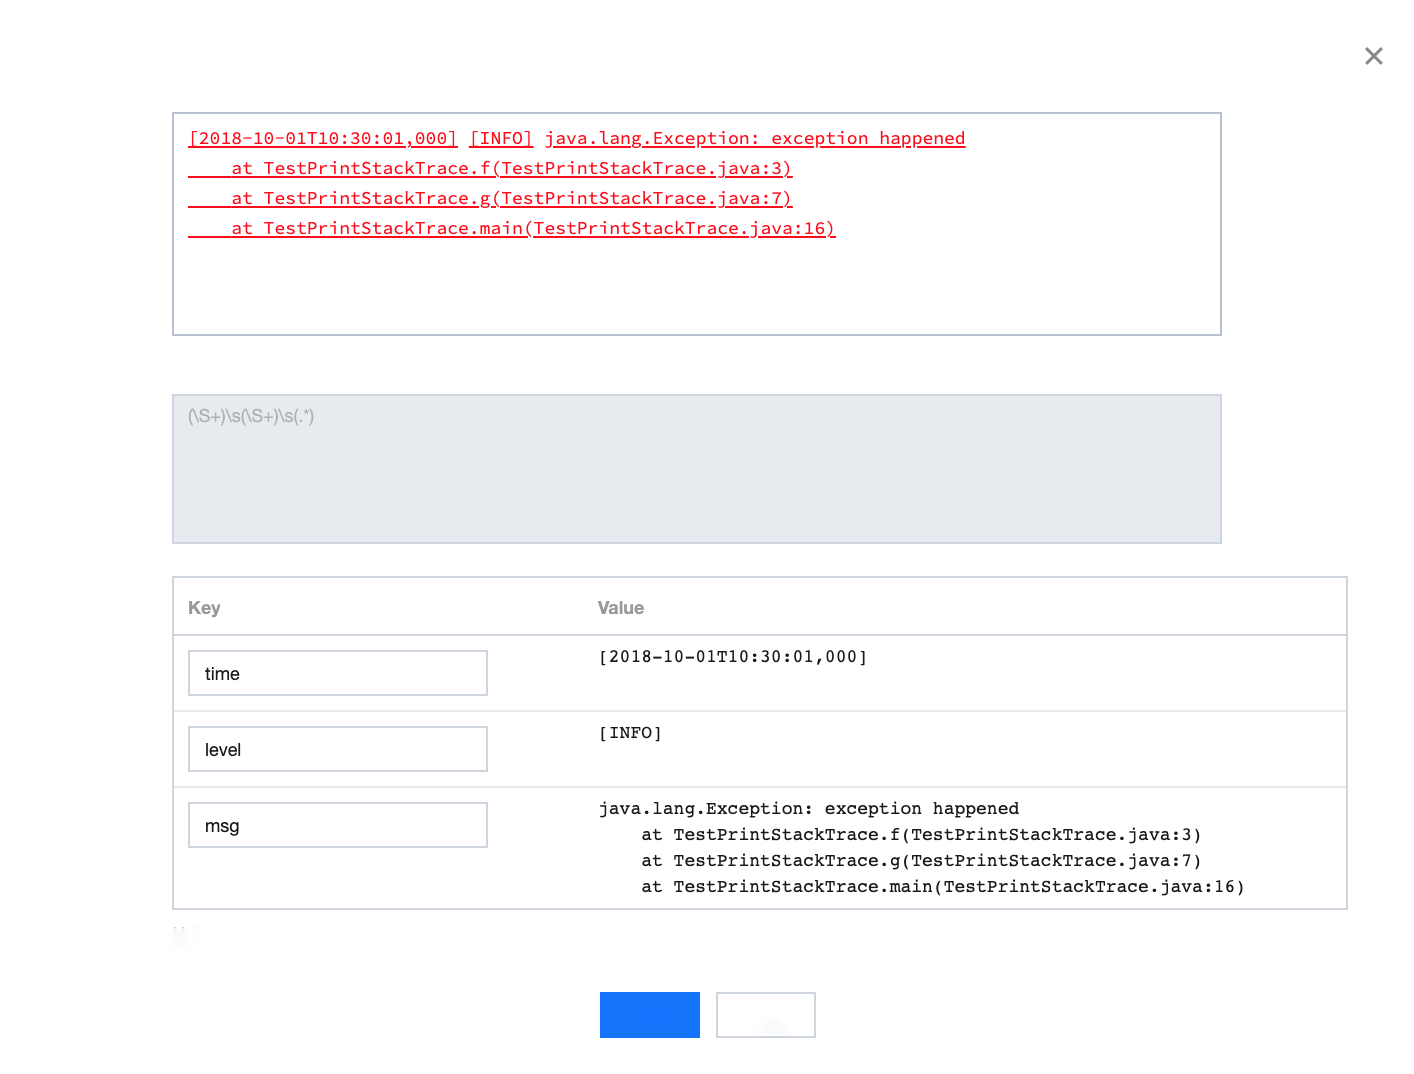
3. Extract the regular expression.
The system offers two ways to define a regular expression: manual mode and auto mode. You can manually enter the expression to extract key-value pairs for verification or click Auto-Generate Regular Expression to switch to auto mode. The system will extract key-value pairs to verify the regular expression according to the mode you selected and the regular expression you defined.
Manual mode:
3.1.1 Enter the regular expression in the Regular Expression text box.
3.1.2 Click Verify, and the system will determine whether the sample log matches the regular expression.
Auto Mode (click Auto-Generate Regular Expression to switch):
3.1.1
In
the Auto-Generate Regular Expression pop-up view, select the log content from which to extract key-value pairs based on your actual search and analysis needs, enter the key name in the pop-up text box, and click Confirm.
The system will automatically extract a regular expression from the content, and the Automatic Extraction Result will appear in the key-value table.
3.1.2 Repeat step a until all key-value pairs are extracted.
3.1.3 Click OK, and the system will automatically generate a complete regular expression according to the extracted key-value pairs.
Note:
No matter whether in auto mode or manual mode, the extraction result will be displayed in the Extraction Result after the regular mode is defined and verified successfully. You only need to define the key name of each key-value pair for use in log search and analysis.
Performing manual verification
1. If your log data is complex, you can set Manual Verification to
to enable manual verification.
2. Enter multiple sample logs, click Verify, and the system will verify the pass rate of the regular expression for the logs.
Configuring the collection time
Note:
The log time is measured in seconds. If the log time is entered in an incorrect format, the collection time is used as the log time.
The time attribute of a log is defined in two ways: collection time and original timestamp.
Collection time: The time attribute of a log is determined by the time when CLS collects the log.
Original timestamp: The time attribute of a log is determined by the timestamp in the raw log.
Using the collection time as the time attribute of logs: Keep Collection Time enabled.
Using the original timestamp as the time attribute of logs: Disable Collection Time and enter the time key of the original timestamp and the corresponding time parsing format in Time Key and Time Parsing Format respectively. For more information on the time parsing format, see Configuring Time Format.
Below are examples of how to enter a time parsing format:
Example 1: The parsing format of the original timestamp 10/Dec/2017:08:00:00 is %d/%b/%Y:%H:%M:%S.
Example 2: The parsing format of the original timestamp `2017-12-10 08:00:00` is %Y-%m-%d %H:%M:%S.
Example 3: The parsing format of the original timestamp 12/10/2017, 08:00:00 is %m/%d/%Y, %H:%M:%S.
Configuring filter rules
Filters are designed to help you extract valuable log data by adding log collection filter rules based on your business needs. If the filter rule is a Perl regular expression, the created filter rule will be used for matching; in other words, only logs that match the regular expression will be collected and reported.
To collect logs in full regular expression mode, you need to configure a filter rule according to the defined custom key-value pair. For example, if you want to collect all log data with a status field with the value 400 or 500 after the sample log is parsed in full regular expression mode, you need to configure key as status and the filter rule as 400|500.
Note:
The relationship between multiple filter rules is logic "AND". If multiple filter rules are configured for the same key name, previous rules will be overwritten.
Configuring parsing-failed log upload
We recommend you enable Upload Parsing-Failed Logs. After it is enabled, LogListener will upload all types of parsing-failed logs. If it is disabled, such logs will be discarded.
After this feature is enabled, you need to configure the Key value for parsing failures (which is LogParseFailure by default). All parsing-failed logs are uploaded with the input content as the key name (Key) and the raw log content as the key value (Value).
Configuring indexes
1. Click Next to enter the Index Configuration page.
2. On the Index Configuration page, set the following information:
Index Status: Select whether to enable it.
Note:
Index configuration must be enabled before you can perform searches.
Full-Text Index: Select whether to set it to case-sensitive.
Full-Text Delimiter: The default value is @&()='",;:<>[]{}/ \\n\\t\\r and can be modified as needed.
Key-Value Index: Disabled by default. You can configure the field type, delimiters, and whether to enable statistical analysis according to the key name as needed. To enable key-value index, you can set