In a database system, when multiple processes concurrently access the same data, the locking mechanism can ensure that the data is only accessed by one process at a time, ensuring data integrity and consistency. Because of resource preemption during execution, locking may cause a deadlock in which two or more processes wait for each other.
There are many types of deadlocks, and the entire lock system is very complex. In InnoDB's lock system, there are table-level locks and row-level locks, depending on their granularity. Row locks include gap locks, insert intention locks, and next-key locks. They are divided into exclusive locks and shared locks according to their mode. Some of these locks are compatible, while some are incompatible. In addition, both the isolation level and data access method affect the scope of locking and the types of lock.
Viewing deadlock logs has traditionally been used to locate deadlocks, which is inefficient and requires database lock system expertise.
Feature Description
DBbrain offers an all-new deadlock visualization feature to intelligently diagnose and analyze database deadlocks and help you use better SQL statements to eliminate unreasonable locking. This effectively reduces slow queries, improves the resource utilization, and prevents deadlocks.
Visual topology: The topology of a deadlock is displayed to visually reproduce the deadlock situation and reflect the information of and wait relationship between transactions.
Lock information display: Click a lock in the visual chart to view the scope of locking, locked data, etc.
SQL information display: Executions are inferred through SQL parsing to help avoid deadlocks.
Operation Entry
1. Log in to the DBbrain console and select Performance Optimization on the left sidebar. On the displayed page, select a database type and an instance at the top, and select the Exception Diagnosis tab.
2. In the Diagnosis Prompt list, if a diagnosis item is Deadlock, click it to enter the deadlock analysis and visualization page.
Visual Topology
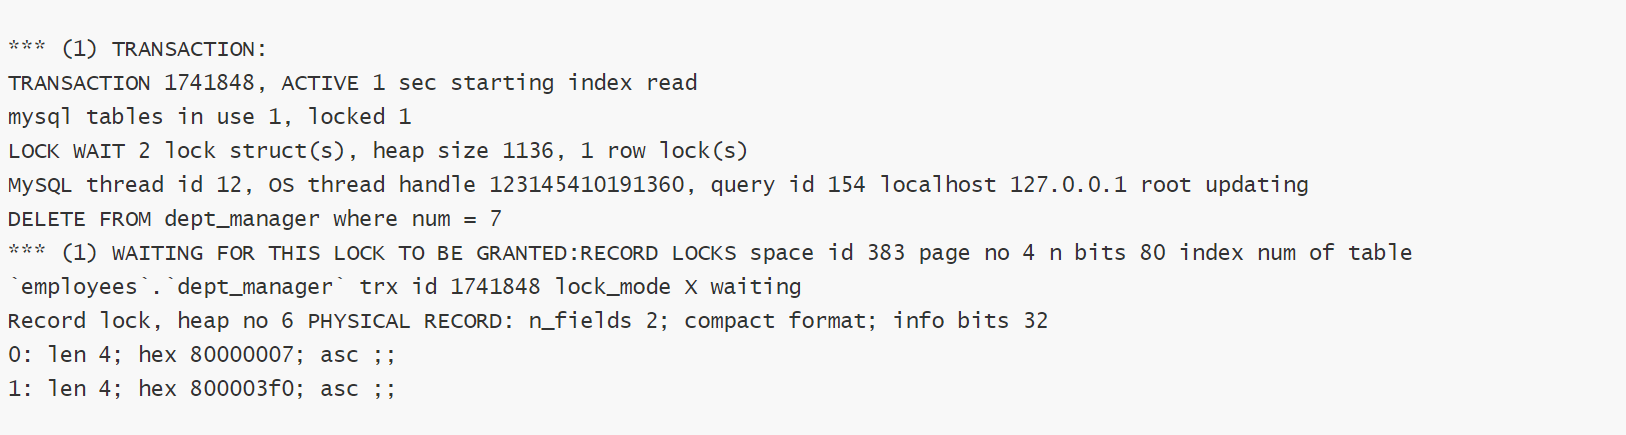
Traditionally, deadlocks are located by viewing deadlock logs, and the information about the last deadlock in InnoDB can be viewed through SHOW ENGINE INNODB STATUS. The logs show the SQL statements and transaction IDs but not lock_mode X waiting and hex 80000007 data (particularly the relationship between the locks involved in the deadlock situation). They can be efficiently analyzed and located only if you have a good knowledge of database locking systems and deadlock logs.
DBbrain visually displays the topology of a deadlock, with transactions and locks as points (to display the requesting and holding relationships between transactions and locks), and with the conflicts between locks as lines (to form a cycle). The following illustrates the visual topologies of various deadlocks.
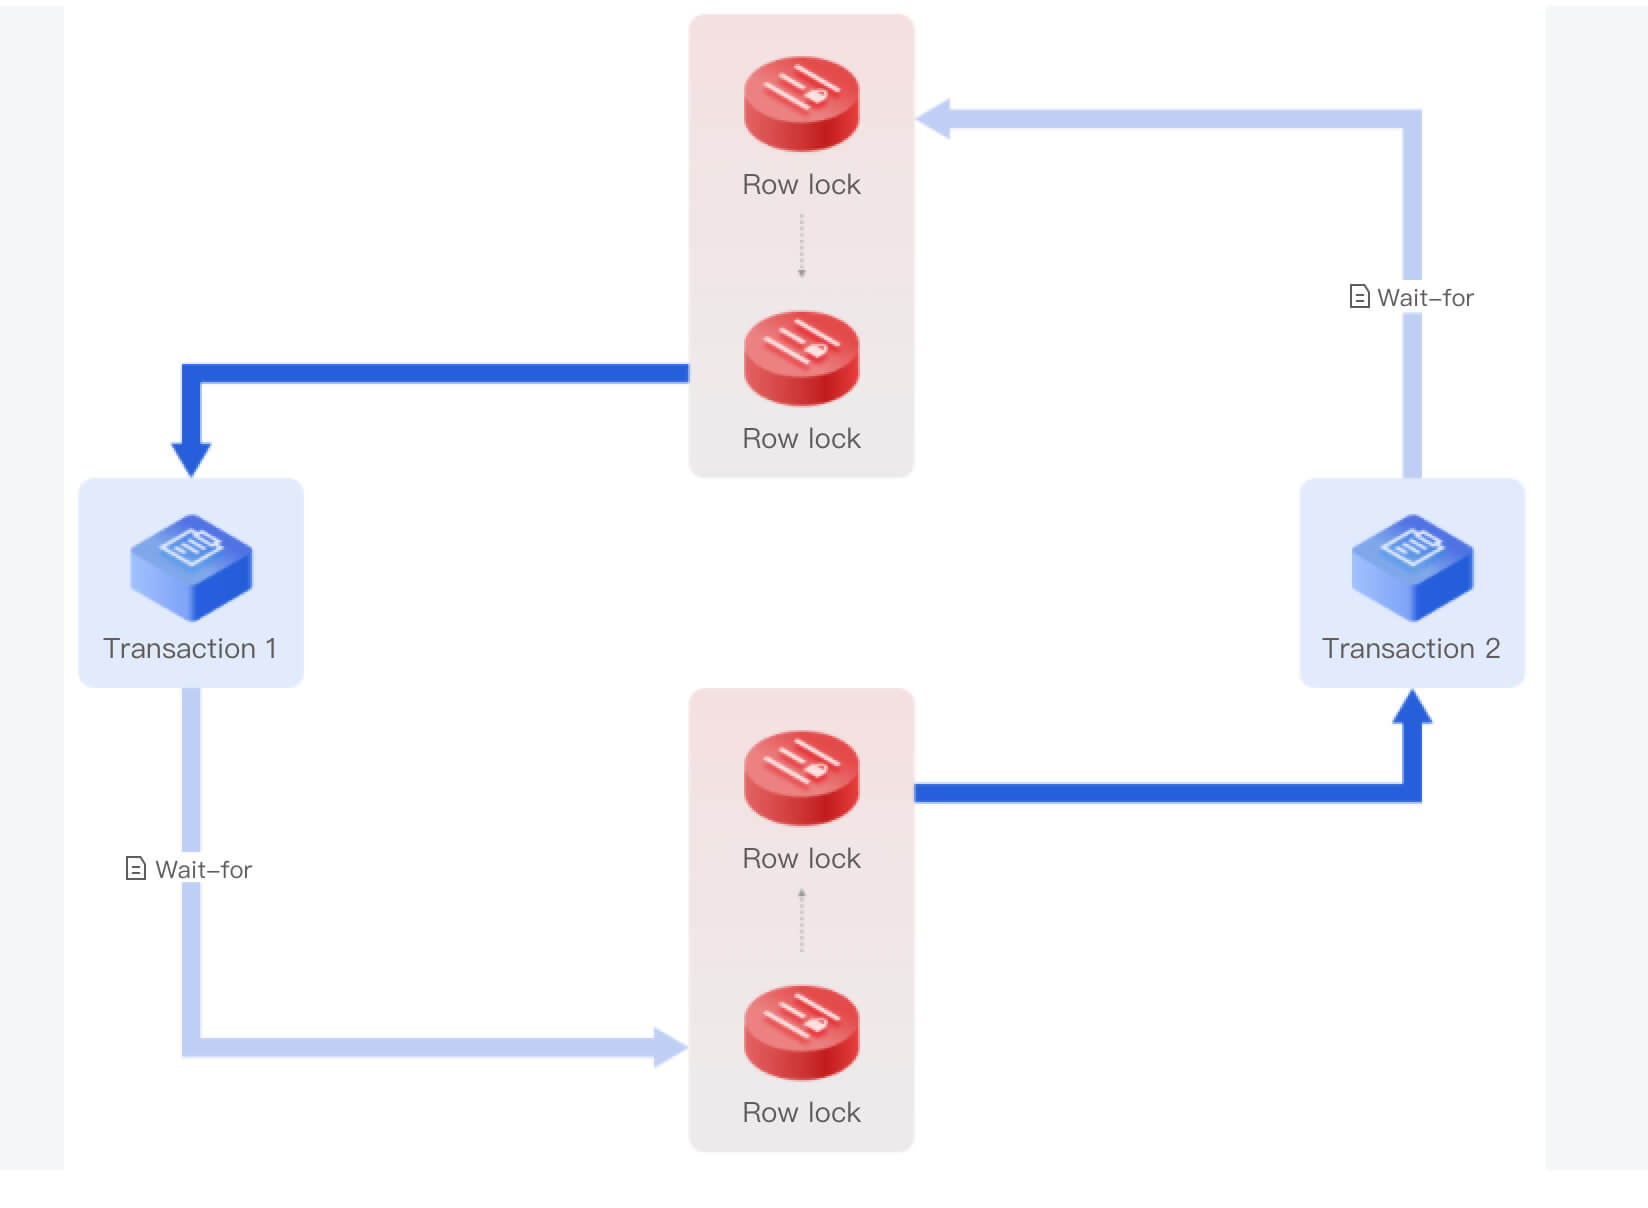
Sample 1. A deadlock between two transactions
Transaction 1 and transaction 2 each hold a lock (represented by a dark blue line) and request a lock (represented by a light blue line). The lock held by transaction 1 blocks the lock requested by transaction 2, and the lock requested by transaction 1 is blocked by the lock held by transaction 2, causing a deadlock.
Incompatible and conflicting locks that are placed on the same record are connected by a dotted line.
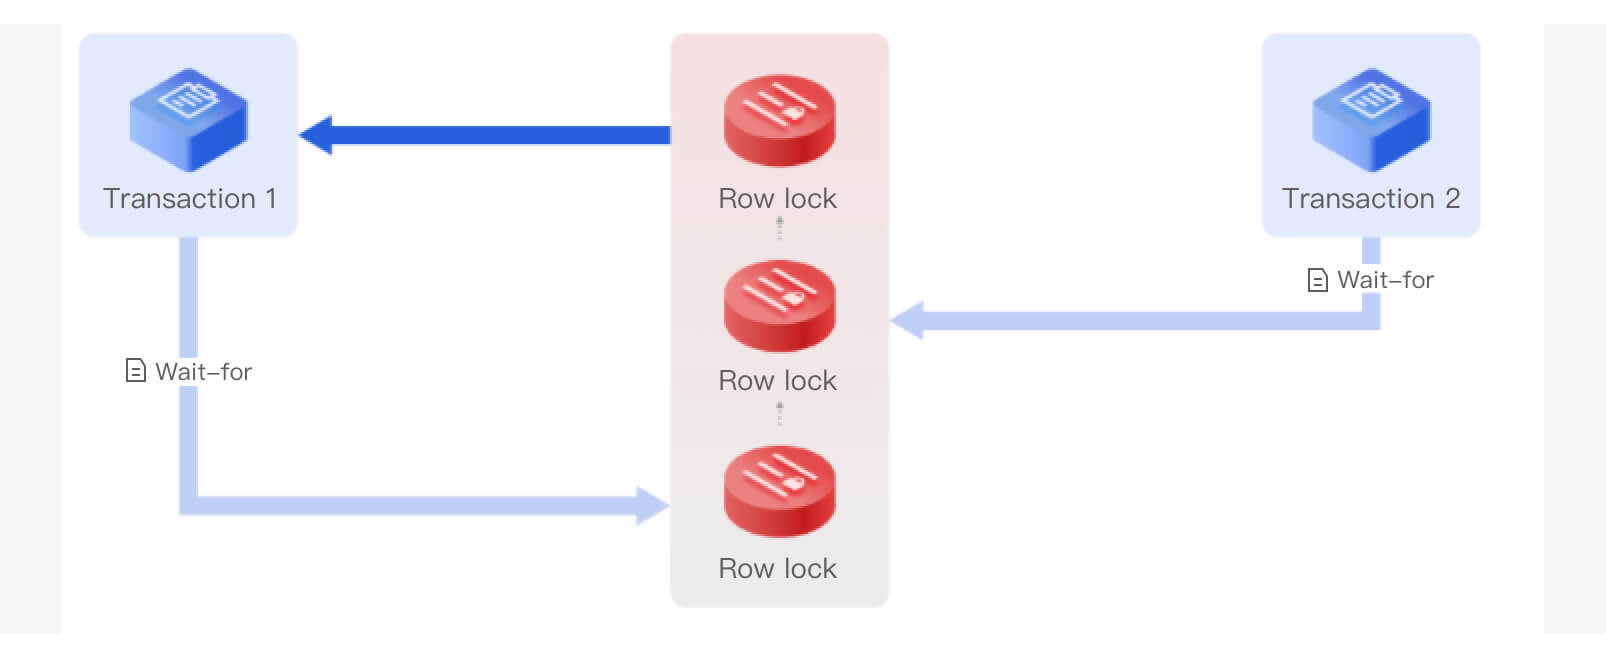
Sample 2. A deadlock caused while waiting for unlocking
In MySQL, even if a waited unlock has not been acquired successfully (i.e., in waiting status), it can still block other lock requests. This is different from locks in operating systems.
As shown below, the row lock requested by transaction 2 (represented by a light blue line) is blocked by the row lock held by transaction 1 (represented by a dark blue line), and the row lock requested by transaction 2 blocks the row lock requested by transaction 1, causing a deadlock.
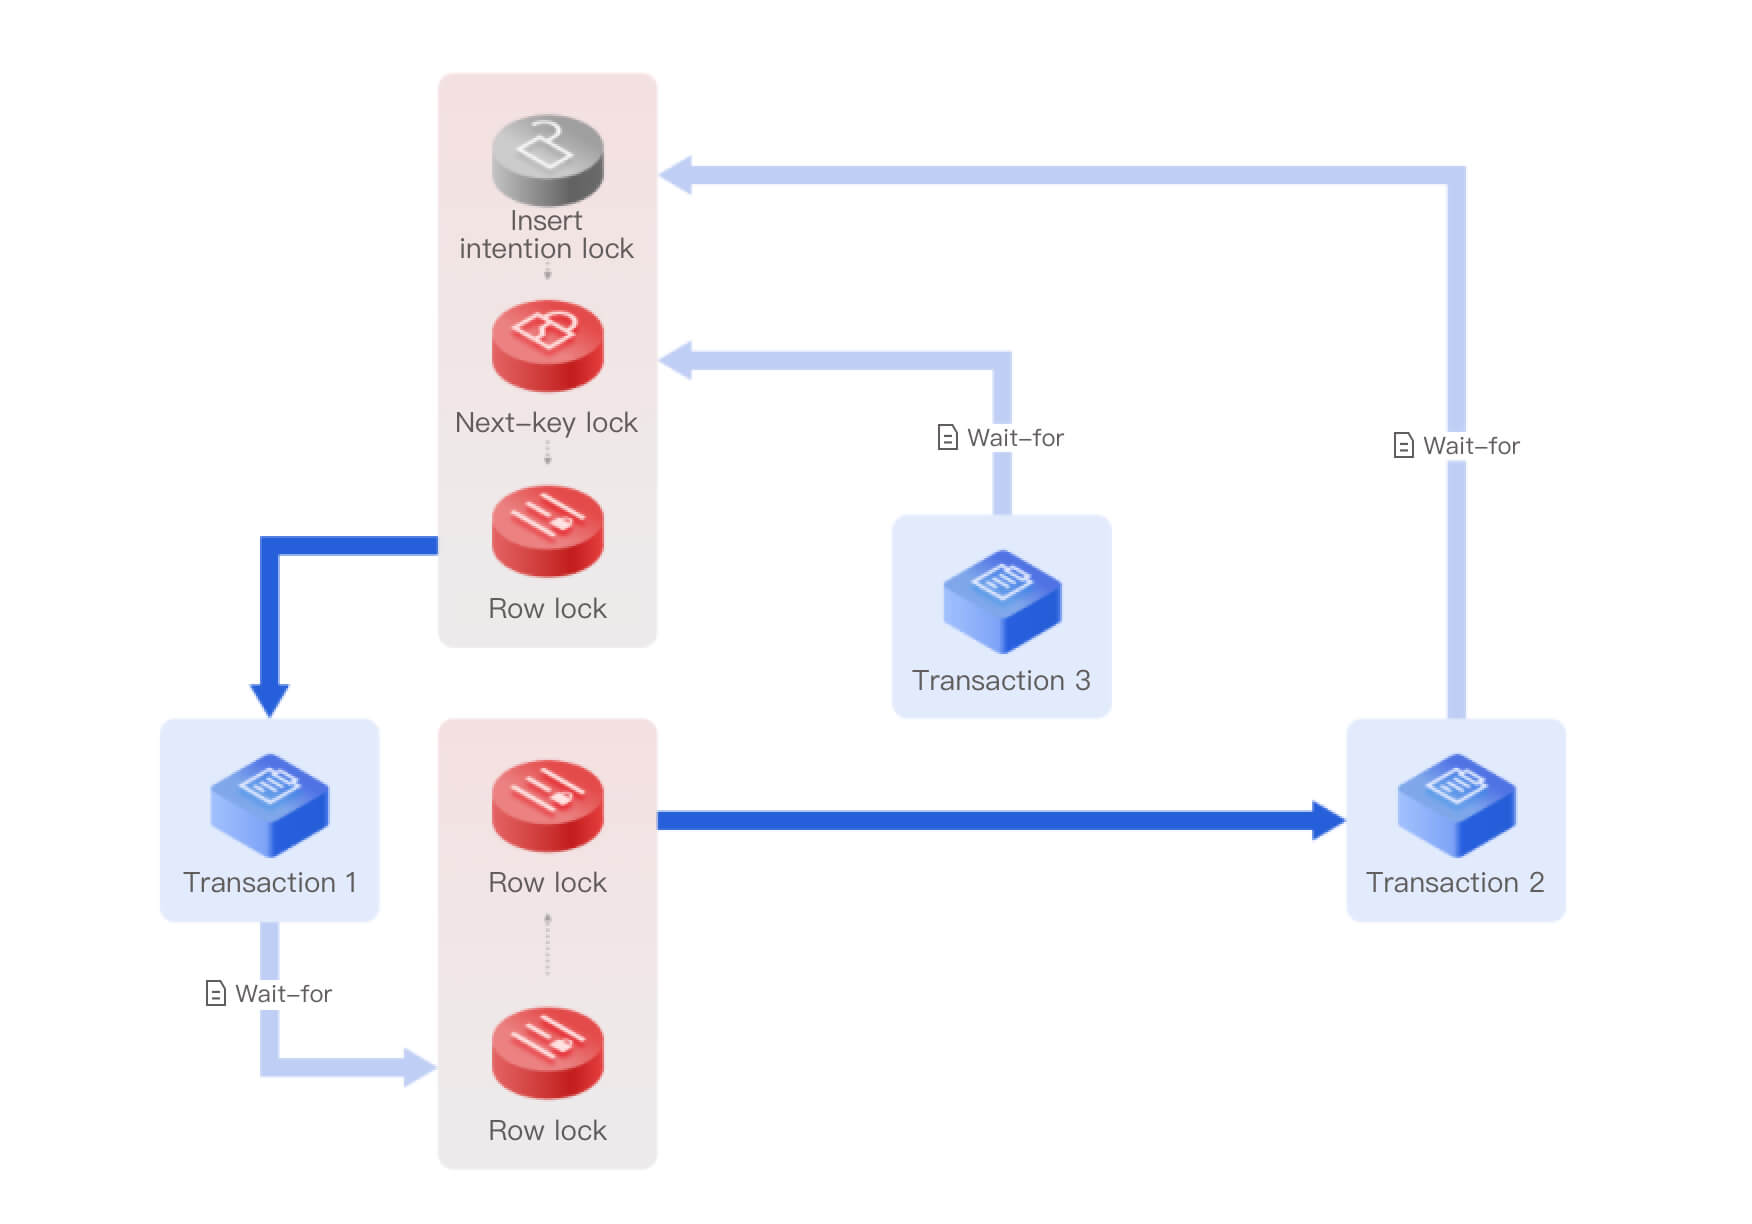
Sample 3. A deadlock among three transactions
The next-key lock requested by transaction 3 is blocked by the row lock held by transaction 1 (represented by a dark blue line), the row lock requested by transaction 1 (represented by a light blue line) is blocked by the row lock held by transaction 2 (represented by a dark blue line), and the insert intention lock requested by transaction 2 (represented by a light blue line) is blocked by the row lock held by transaction 1, causing a deadlock among the three transactions.
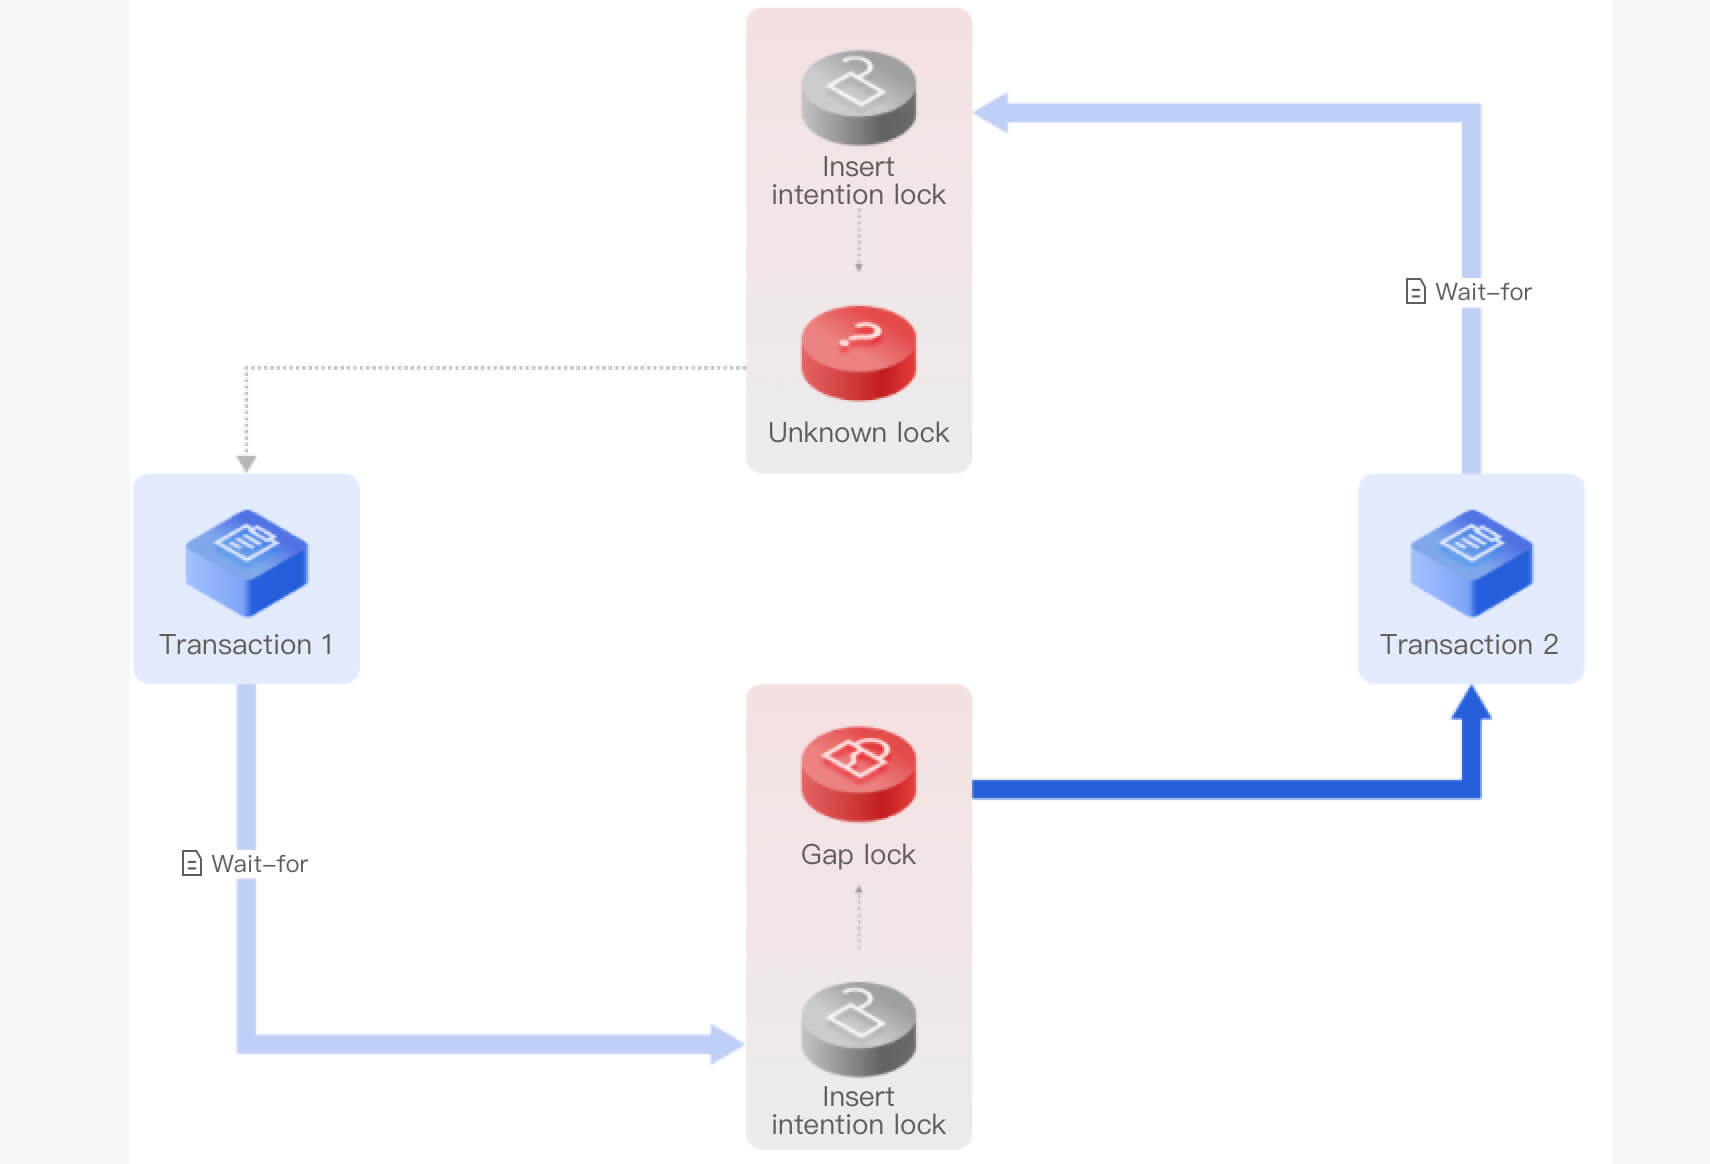
Sample 4. An "unknown lock" (for MySQL 5.6 and 5.7)
Samples 1, 2, and 3 use MySQL 8.0 as an example, which offers complete deadlock logs. If a transaction encounters a conflict when requesting a lock, it will check for a deadlock by looking for a cycle in the wait-for graph.
MySQL 5.6 and 5.7 only use the depth-first search method to search for cycles, but do not record cycles. Therefore, the deadlock logs record only the first and last transactions and are incomplete.
To address this problem, DBbrain introduces the concept of "unknown lock" to make the cycle complete. An unknown lock refers to a lock that should be here as inferred but we don't know what lock it is. There should be a path between the unknown lock and transaction 1, and there may be another transaction along this path, which is therefore represented by a dotted line.
Lock Information Display
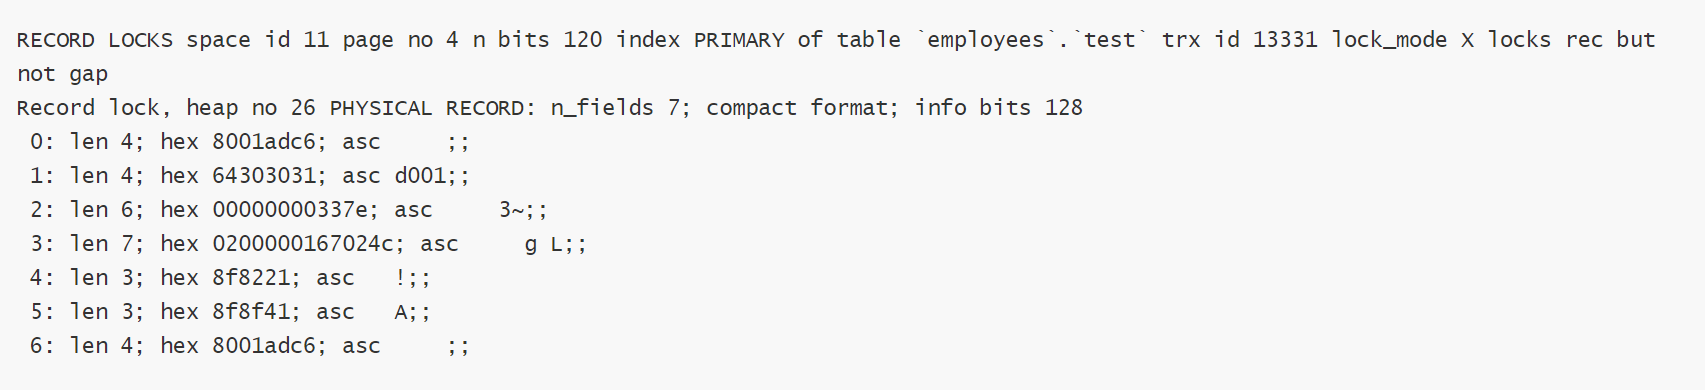
A deadlock log displays the lock information, including the lock mode (exclusive or shared lock), waiting status, and lock type (such as row lock, gap lock, next-key lock, or insert intention lock). A record lock is a lock on one or multiple records, for which the deadlock log records the physical address, including the space, page no, and heap no, schema, index, and other information. The recorded data is displayed by using a list, but only hexadecimal strings are printed, which are unreadable.
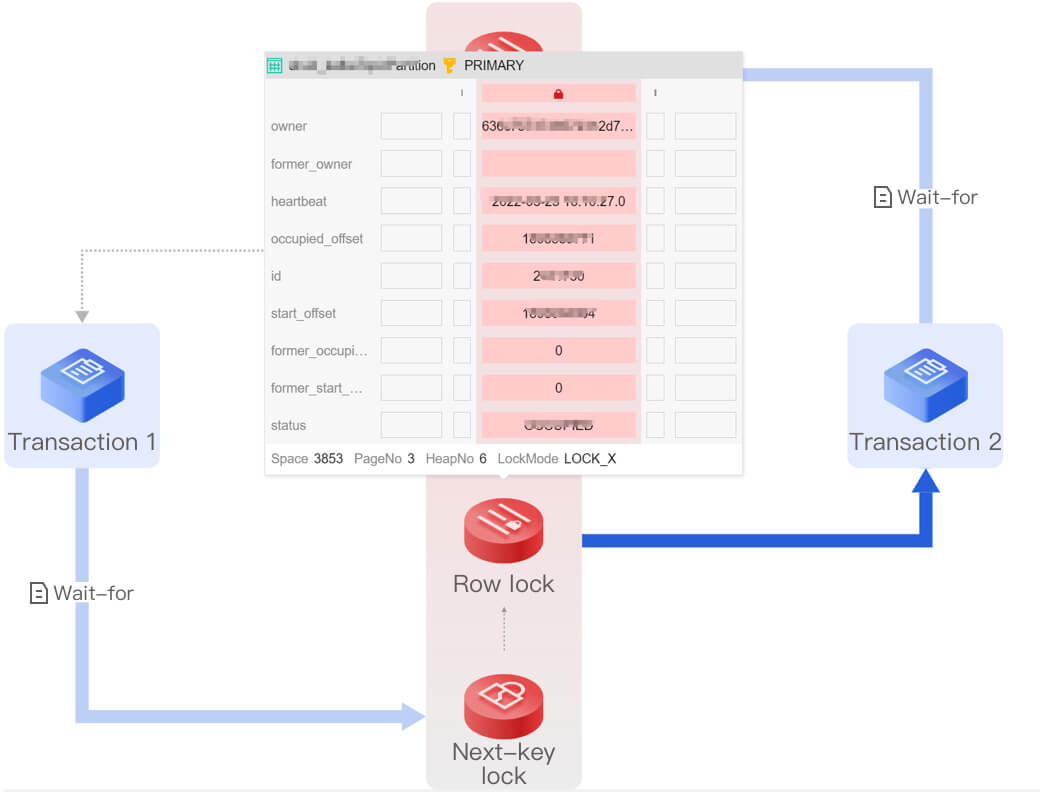
DBbrain displays the lock information, including the scope of locked data, locked row records, and locked gap.
Click a lock in the visual chart to view the scope of data, gap locked by the lock, and other information. Click a transaction to view its details.
SQL Information Display
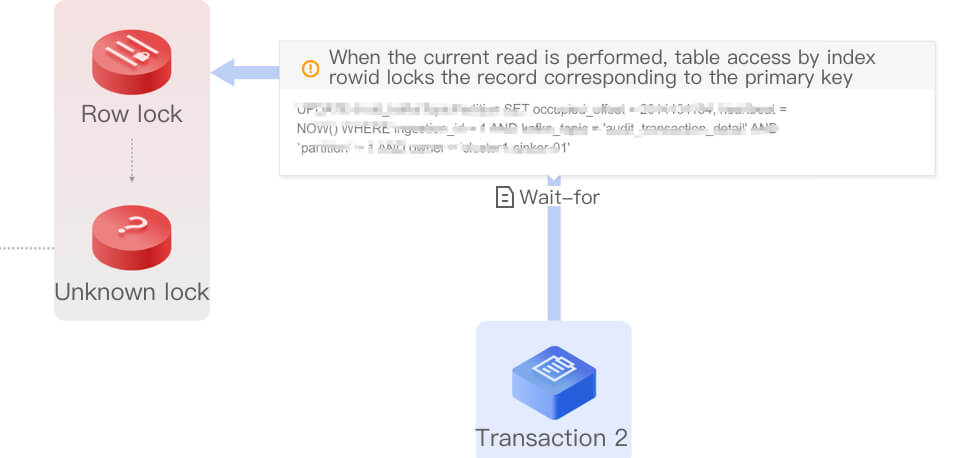
In addition to locating the deadlock situation and relevant information, DBbrain also helps you perform further smart diagnosis. It displays the SQL statement executed when a deadlock occurred in the chart and adds comments to explain what happened when the SQL statement was executed, as well as the rule that MySQL used to place the lock. This helps you optimize your business and SQL statements more quickly and easily.
In the visual chart, click Waits for to view the detailed information of the SQL statement.