DBbrain's performance trends feature not only supports the selection of multiple performance metrics such as key metrics, all metrics, and custom metrics, but also supports multiple ways to view performance trends, such as fine-grained view of one single performance metric trend, as well as link comparison view and time comparison view of multiple performance metric trends.
Supported performance metrics
TencentDB for MySQL
Category
Subcategory
Metric
Resource Monitoring
CPU
CPU
Memory
Memory
Memory Usage
Storage Space
Disk Utilization
Occupied Disk Space
Traffic
Outbound Traffic
Inbound Traffic
MySQL Server
TPS/QPS
TPS/QPS
Connection
Max Connections
Connected Threads
Running Threads
Created Threads
Requests
Select
Update
Delete
Insert
Replace
Total Requests
Slow Query
Slow Queries
Full-Table Scans
InnoDB Engine
InnoDB Buffer Pool Pages
InnoDB Empty Pages
Total InnoDB Pages
InnoDB Logical Reads
InnoDB Physical Reads
Read/Written InnoDB Data
InnoDB Reads
InnoDB Writes
InnoDB Data Reads/Writes
Total InnoDB Reads
Total InnoDB Writes
InnoDB Row Operations
InnoDB Rows Deleted
InnoDB Rows Inserted
InnoDB Rows Updated
InnoDB Rows Read
InnoDB Row Lock
InnoDB Row Lock Waits
Average InnoDB Row Lock Acquiring Time
MySQL Replication
Replication Status
Source-Replica Delay Distance
Source-Replica Delay Time
Replication Delay
IO Thread Status
SQL Thread Status
Self-built MySQL
Monitoring Metric
Agent Access
Direct Access
Resource Monitoring
CPU
CPU
✓
×
Memory
Memory
✓
×
Memory Usage
✓
×
Storage Space
Storage Utilization
✓
×
Used Storage Space
✓
×
Traffic
Outbound Traffic
✓
✓
Inbound Traffic
✓
✓
MySQL Server
TPS/QPS
TPS/QPS
✓
✓
Connection
Max Connections
✓
✓
Connected Threads
✓
✓
Running Threads
✓
✓
Created Threads
✓
✓
Requests
Select
✓
✓
Update
✓
✓
Delete
✓
✓
Insert
✓
✓
Replace
✓
✓
Total Requests
✓
✓
Slow Query
Slow Queries
✓
✓
Full-Table Scans
✓
✓
InnoDB Engine
InnoDB Buffer Pool Pages
InnoDB Empty Pages
✓
✓
Total InnoDB Pages
✓
✓
InnoDB Logical Reads
✓
✓
InnoDB Physical Reads
✓
✓
Read/Written InnoDB Data
InnoDB Reads
✓
✓
InnoDB Writes
✓
✓
InnoDB Data Reads/Writes
Total InnoDB Reads
✓
✓
Total InnoDB Writes
✓
✓
InnoDB Row Operations
InnoDB Rows Deleted
✓
✓
InnoDB Rows Inserted
✓
✓
InnoDB Rows Updated
✓
✓
InnoDB Rows Read
✓
✓
InnoDB Row Lock
InnoDB Row Lock Waits
✓
✓
Average InnoDB Row Lock Acquiring Time
✓
✓
TDSQL-C for MySQL
Category
Subcategory
Metric
Resource Monitoring
CPU
CPU
Memory
Memory
Memory Usage
Storage Space
Storage Utilization
Used Storage Space
Traffic
Outbound Traffic
Inbound Traffic
MySQL Server
TPS/QPS
TPS/QPS
Connection
Max Connections
Connected Threads
Running Threads
Created Threads
Requests
Select
Update
Delete
Insert
Replace
Total Requests
Slow Query
Slow Queries
Full-Table Scans
InnoDB Engine
InnoDB Row Operations
InnoDB Rows Deleted
InnoDB Rows Inserted
InnoDB Rows Updated
InnoDB Rows Read
InnoDB Buffer Pool Pages
InnoDB Logical Reads
InnoDB Logical Writes
MySQL Replication
Replication Status
Replication Status of Replica Instance
Replication Delay
Redo Log LSN Difference between Source and Replica Instances
Replica Instance Delay in Redo Log Based Replication
Viewing performance trend metrics
1. Log in to the DBbrain console and select Performance Optimization on the left sidebar. On the displayed page, select a database type and an instance at the top, and select the Performance Trends tab.
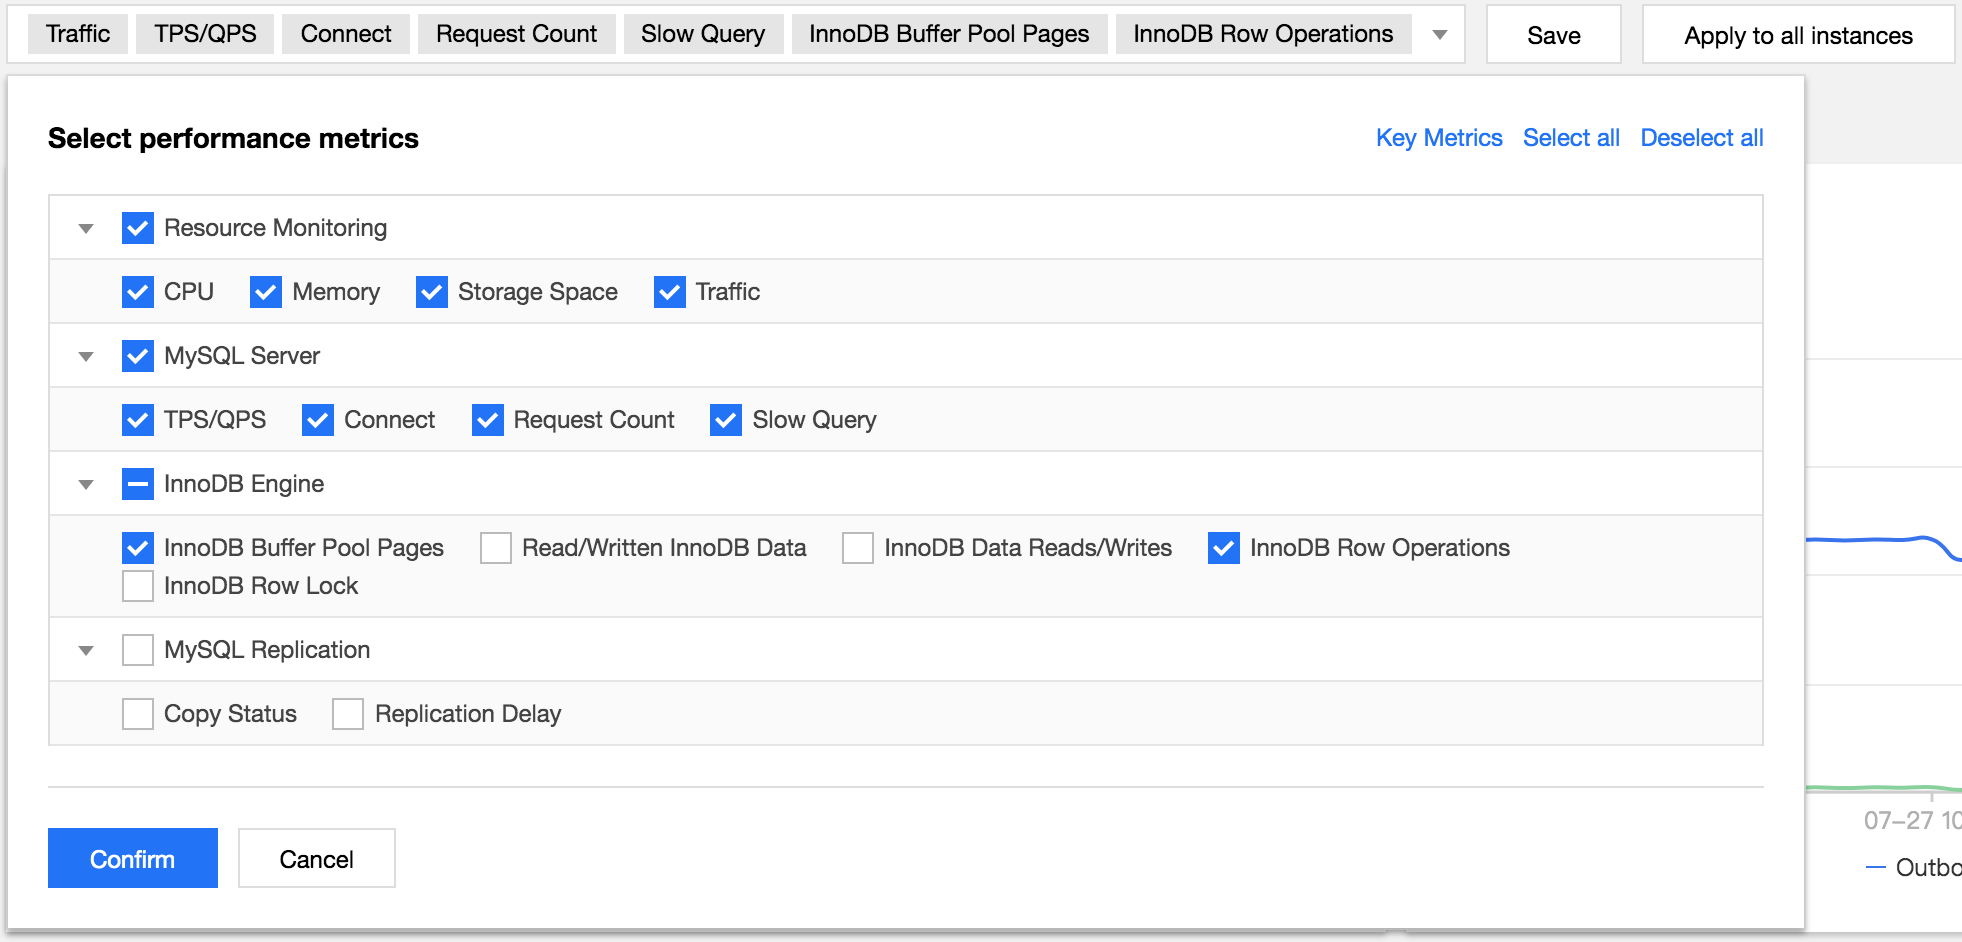
2. On the Performance Trends tab, select specific performance metrics or select Key Metrics, Select All, or Deselect All in the top-right corner, and click Save.
Note:
Click Save to apply the selected metrics to the current database instance, or click Save and Apply to All Instances to apply the selected metrics to all database instances.
3. View metrics.
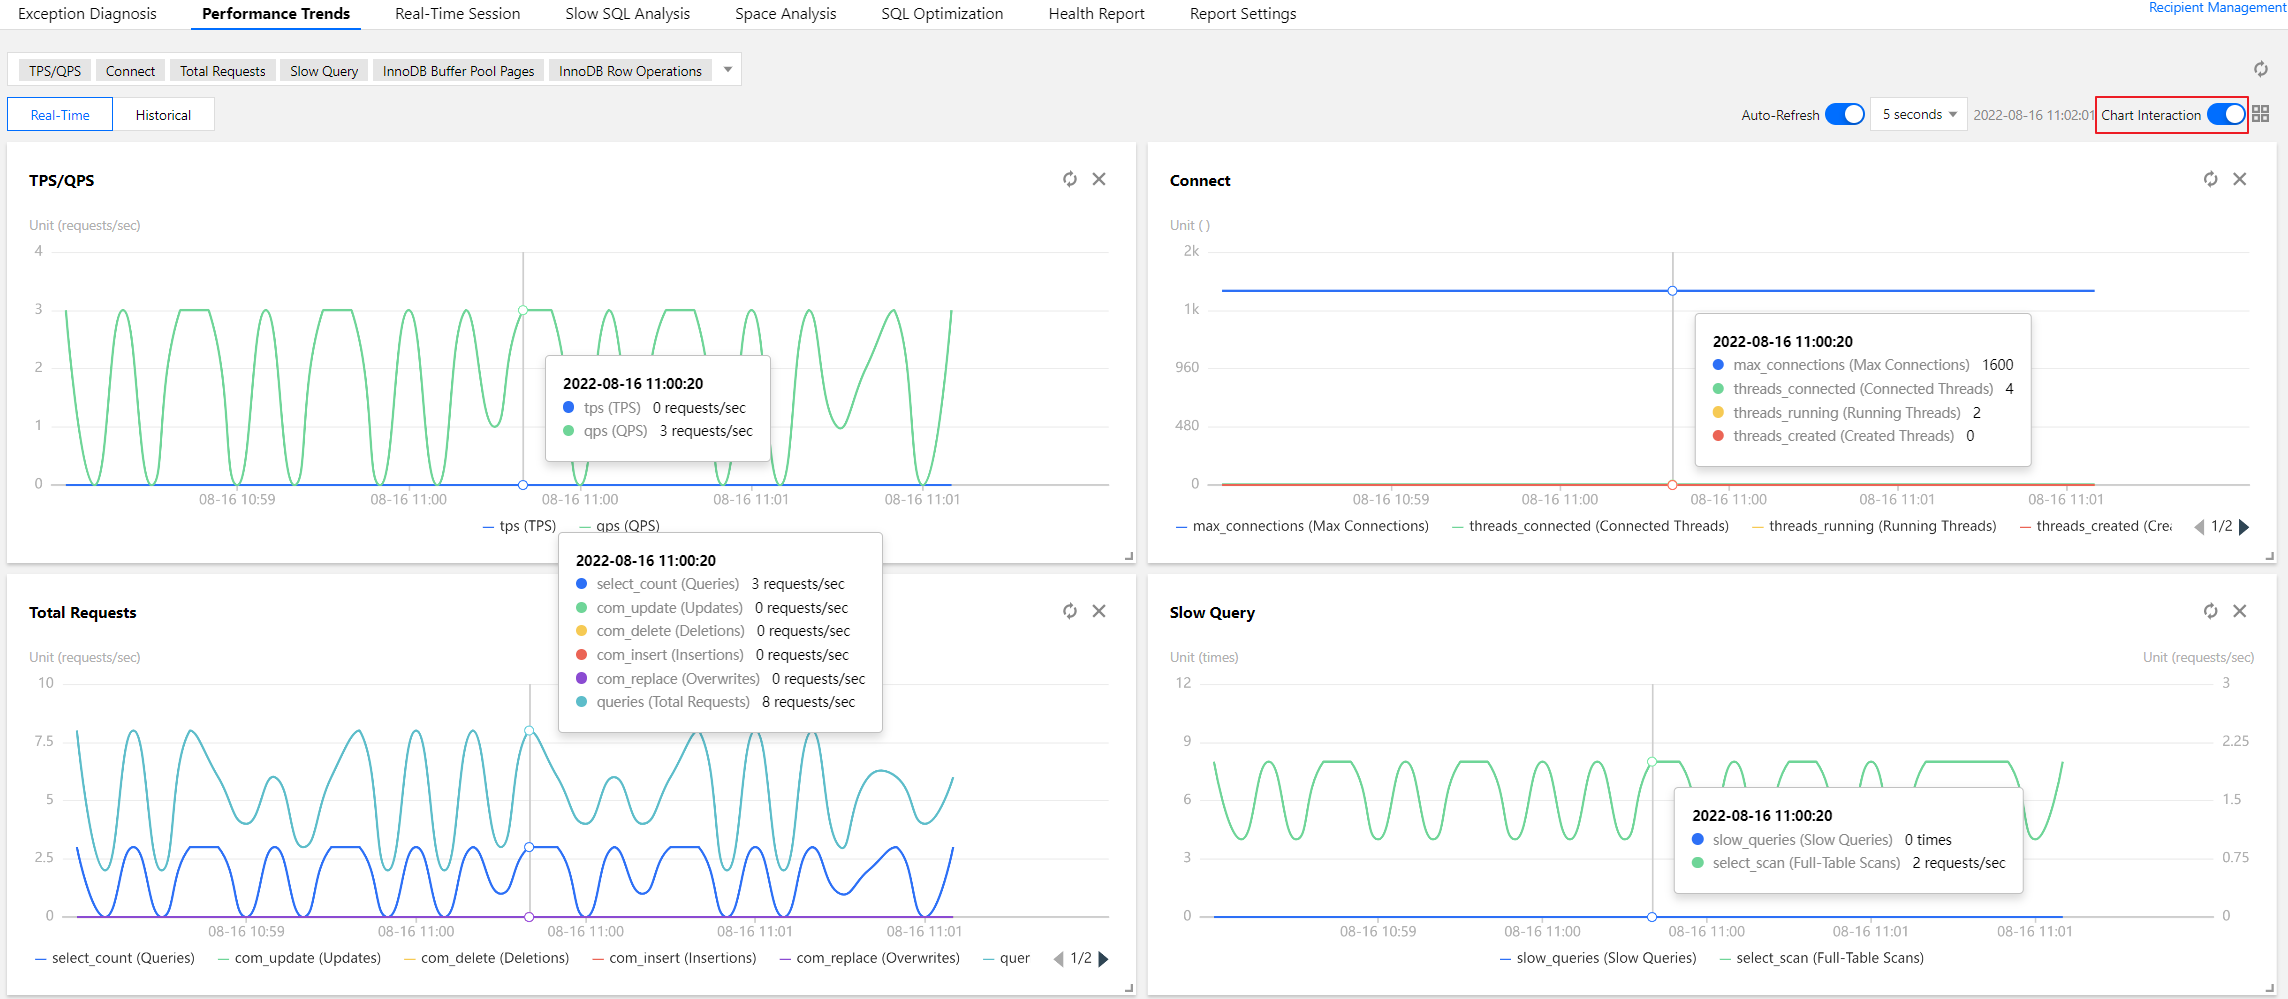
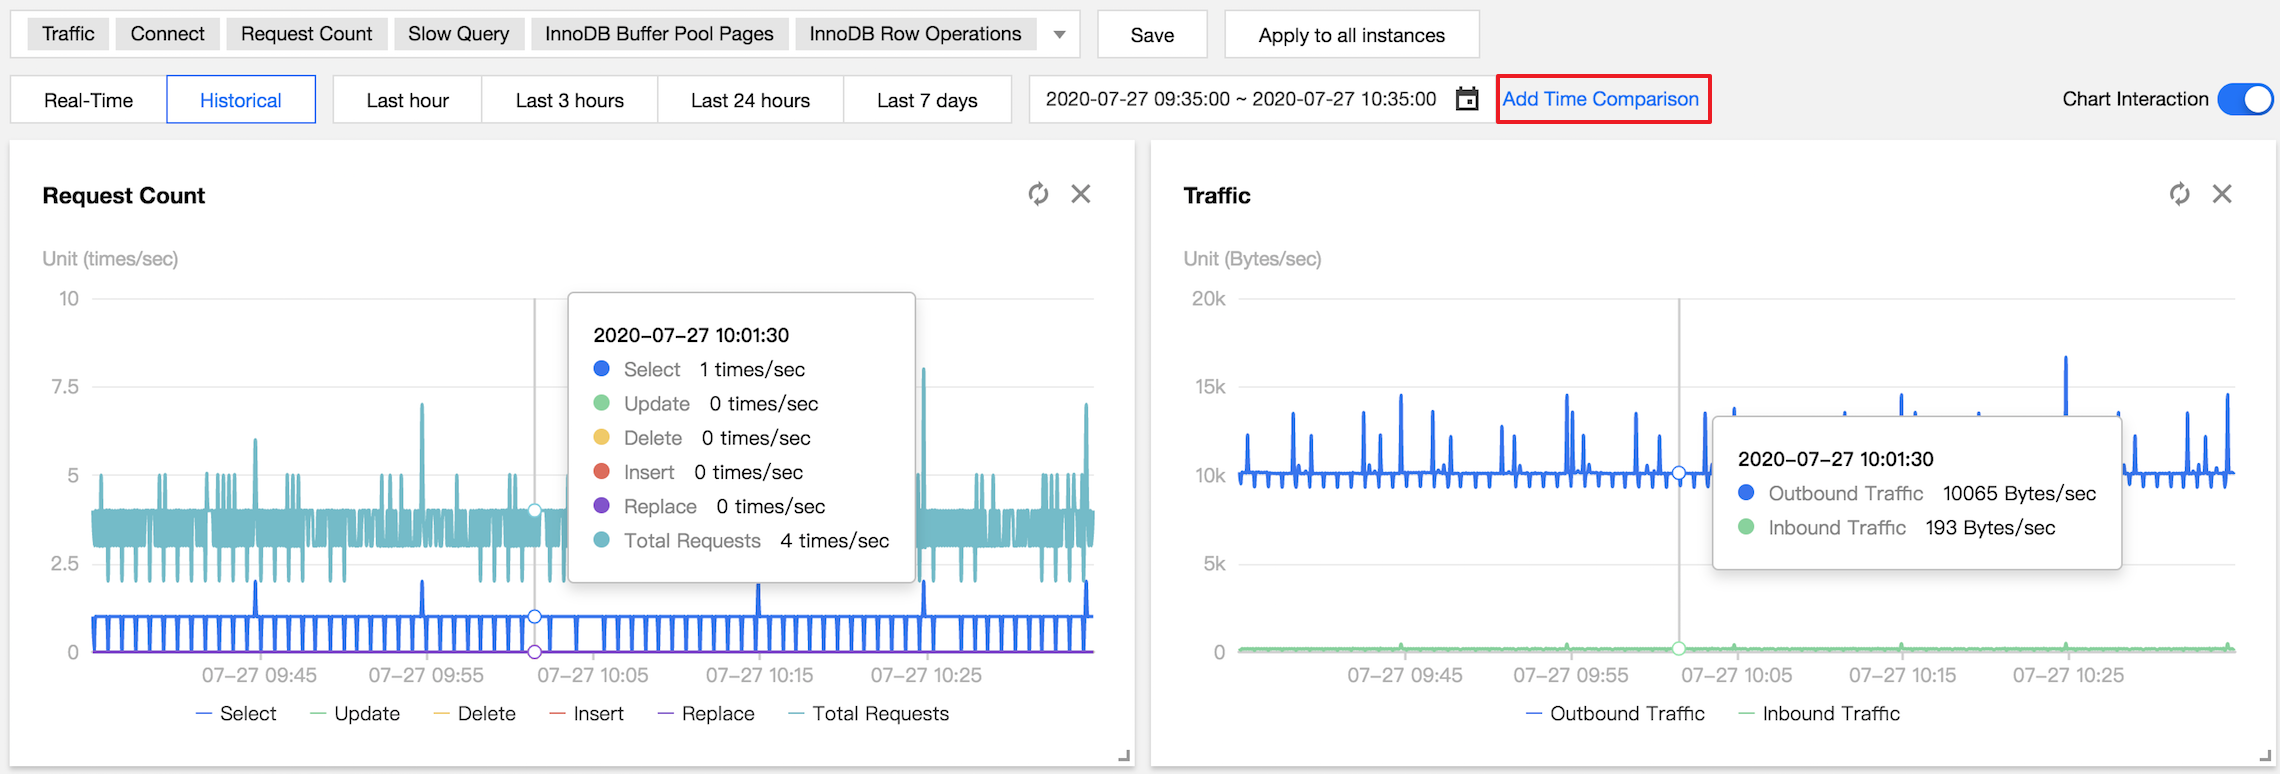
Chart interaction: Click Chart Interaction on the right to link and compare the monitoring views of multiple instances or metrics.
When you hover over a data point in any monitoring view, the data at the same time point will be displayed in other monitoring views. Click the data point to pin it for display. To unpin it, click Deselect the Time Point.
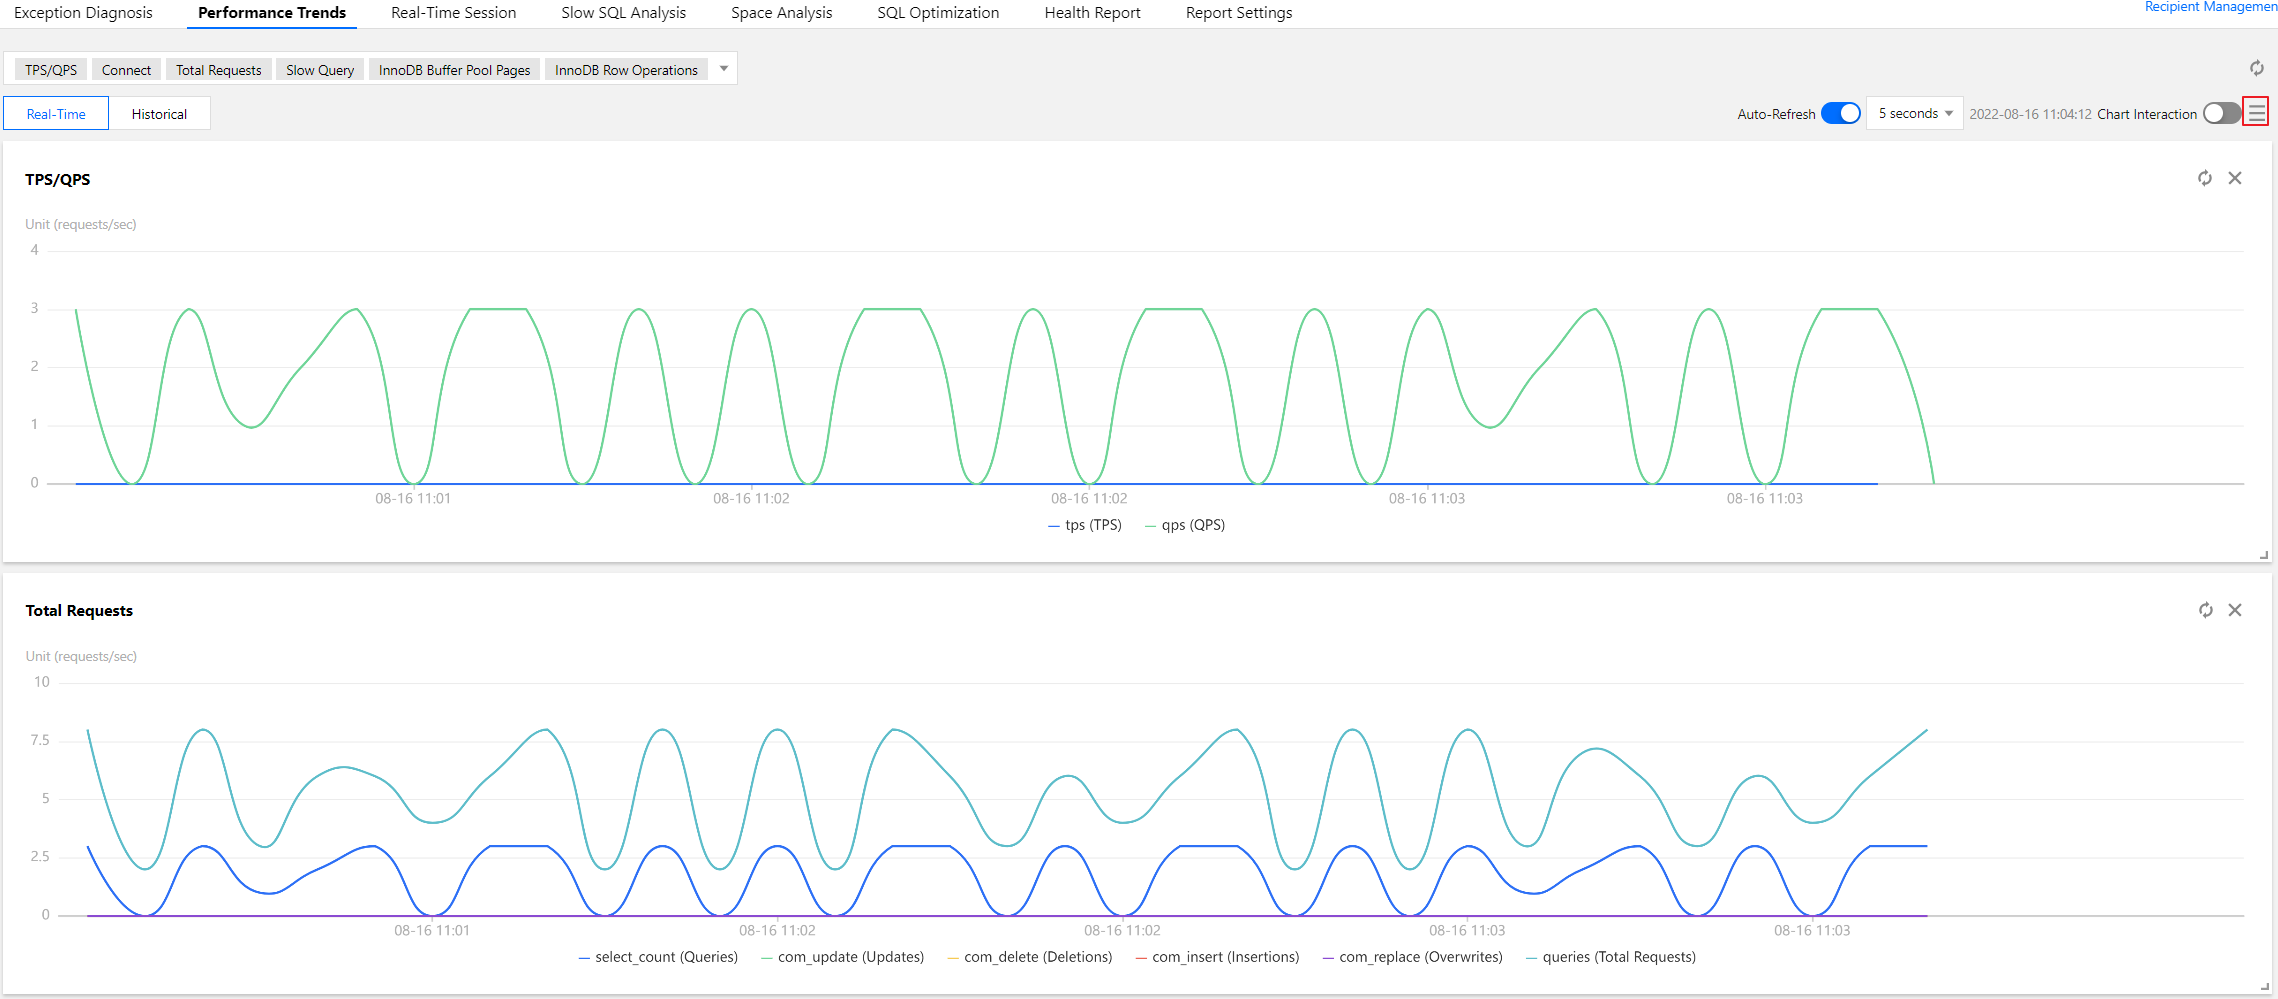
Switching between the one-column and two-column modes: Click the button on the right of Chart Interaction in the top-right corner to switch.
Dragging a monitoring view: Click the border of a monitoring view to drag it to the desired position.
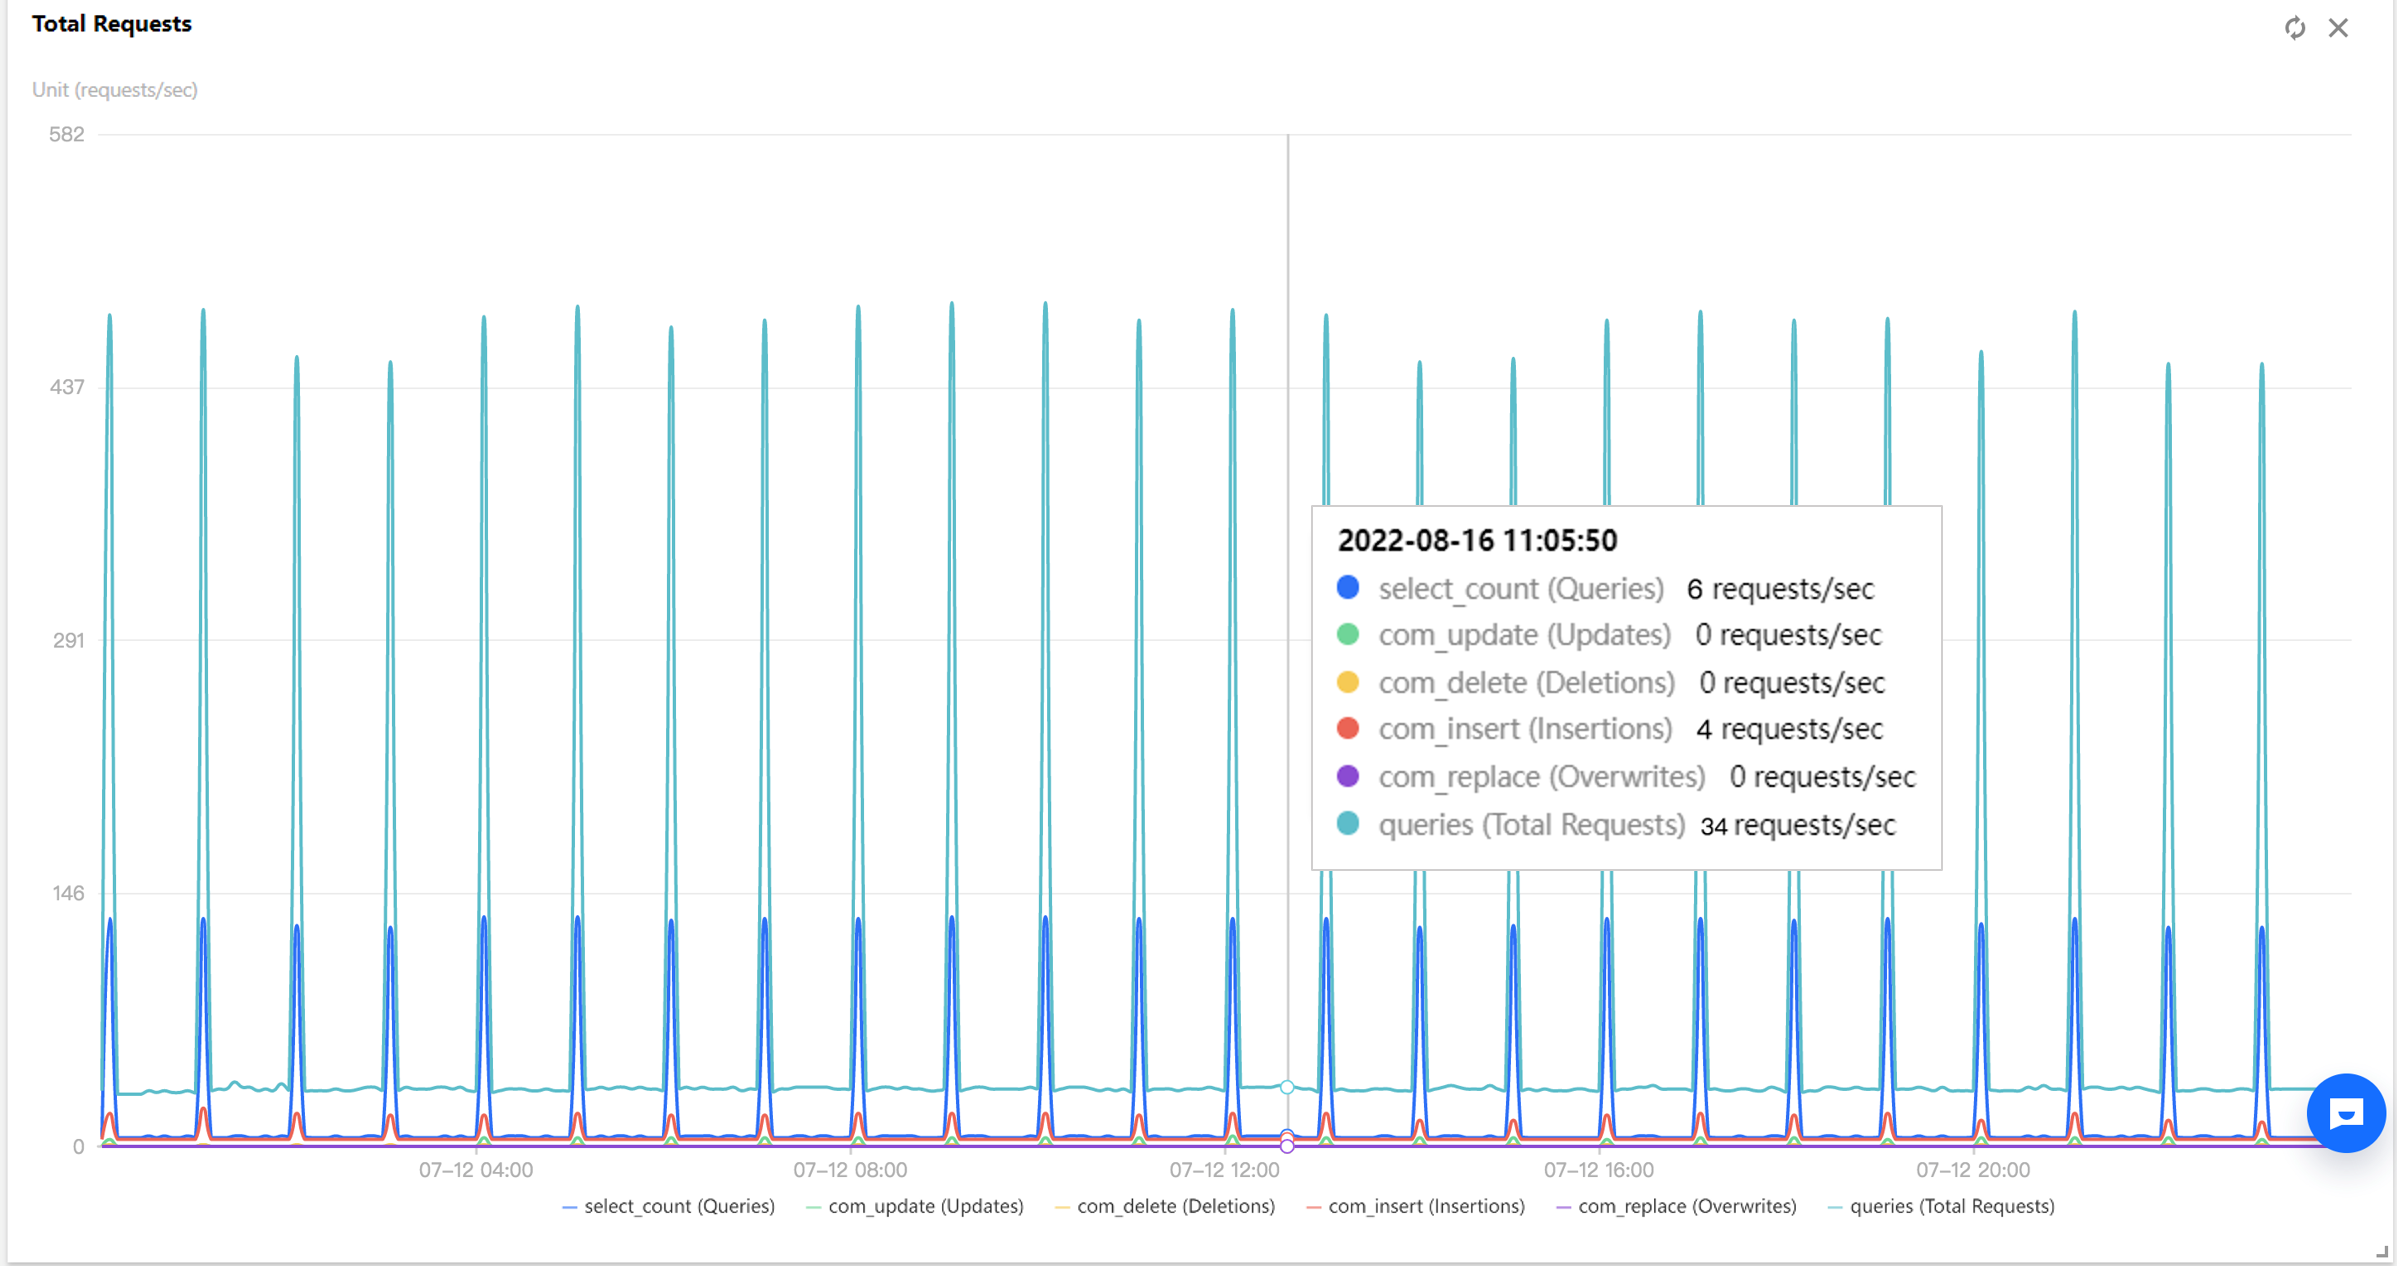
Zooming in a monitoring view: Drag the icon in the bottom-right corner of a monitoring view to zoom it in for fine-grained display of the trend of one single performance metric.
Switching between the real-time and historical modes: Click Real-Time or Historical to view the real-time or historical performance trends.
The real-time performance trends view displays the performance trends of the instance and is automatically refreshed by default. You can click Disable refresh to stop refreshing the trends in real time.
In the historical performance trends view, you can select a time range (Last hour, Last 3 hours, Last 24 hours, Last 7 days, or a custom time range) to display the performance trends over the selected time range.
Click Add Time Comparison and select the desired time range for comparison to view the time comparison of multiple performance metric trends.