tencent cloud

Tencent Cloud TCHouse-P

Release Notes
Product Introduction
Overview
Use Cases
Node Specification
Cluster Architecture
Purchase Guide
Billing Overview
Purchase Methods
Payment Overdue
Getting Started
Operation Guide
Managing Cluster
Accessing Data Warehouse
Monitoring and Alarming
Access Management
Performance Metrics
TPC-B
Tools and Downloads
Data Ingestion
Importing TencentDB Data Offline with DataX
Syncing Incremental Data from MySQL with DataX
Importing and Exporting COS Data at High Speed with External Table
Syncing EMR Data with External Table
Implementing CDWPG UPSERT with Rule
Data Warehouse Development
Creating Airflow in Cloud
API Documentation
History
Introduction
API Category
Making API Requests
Information Query APIs
Instance APIs
Query APIs
Cluster Management APIs
Cluster Operation APIs
Data Types
Error Codes
Practical Tutorial
Data Warehouse Table Development
Table Distribution Key Selection
Table Storage Format Selection
Table Partition Usage
Extension Usage
Cold Data Backup
Statistics and Space Maintenance
FAQs
Tencent Cloud TCHouse-P Policy
Service Level Agreement
Privacy Policy
Data Processing And Security Agreement
Contact Us

Cluster Information

PDF
Mode fokus
Ukuran font
Terakhir diperbarui: 2024-11-27 15:29:17
This document describes how to modify the basic information and billing mode of a Tencent Cloud TCHouse-P cluster in the console, as well as view its performance monitoring data, real-time queries, historical queries, and event monitoring data.

Basic Information

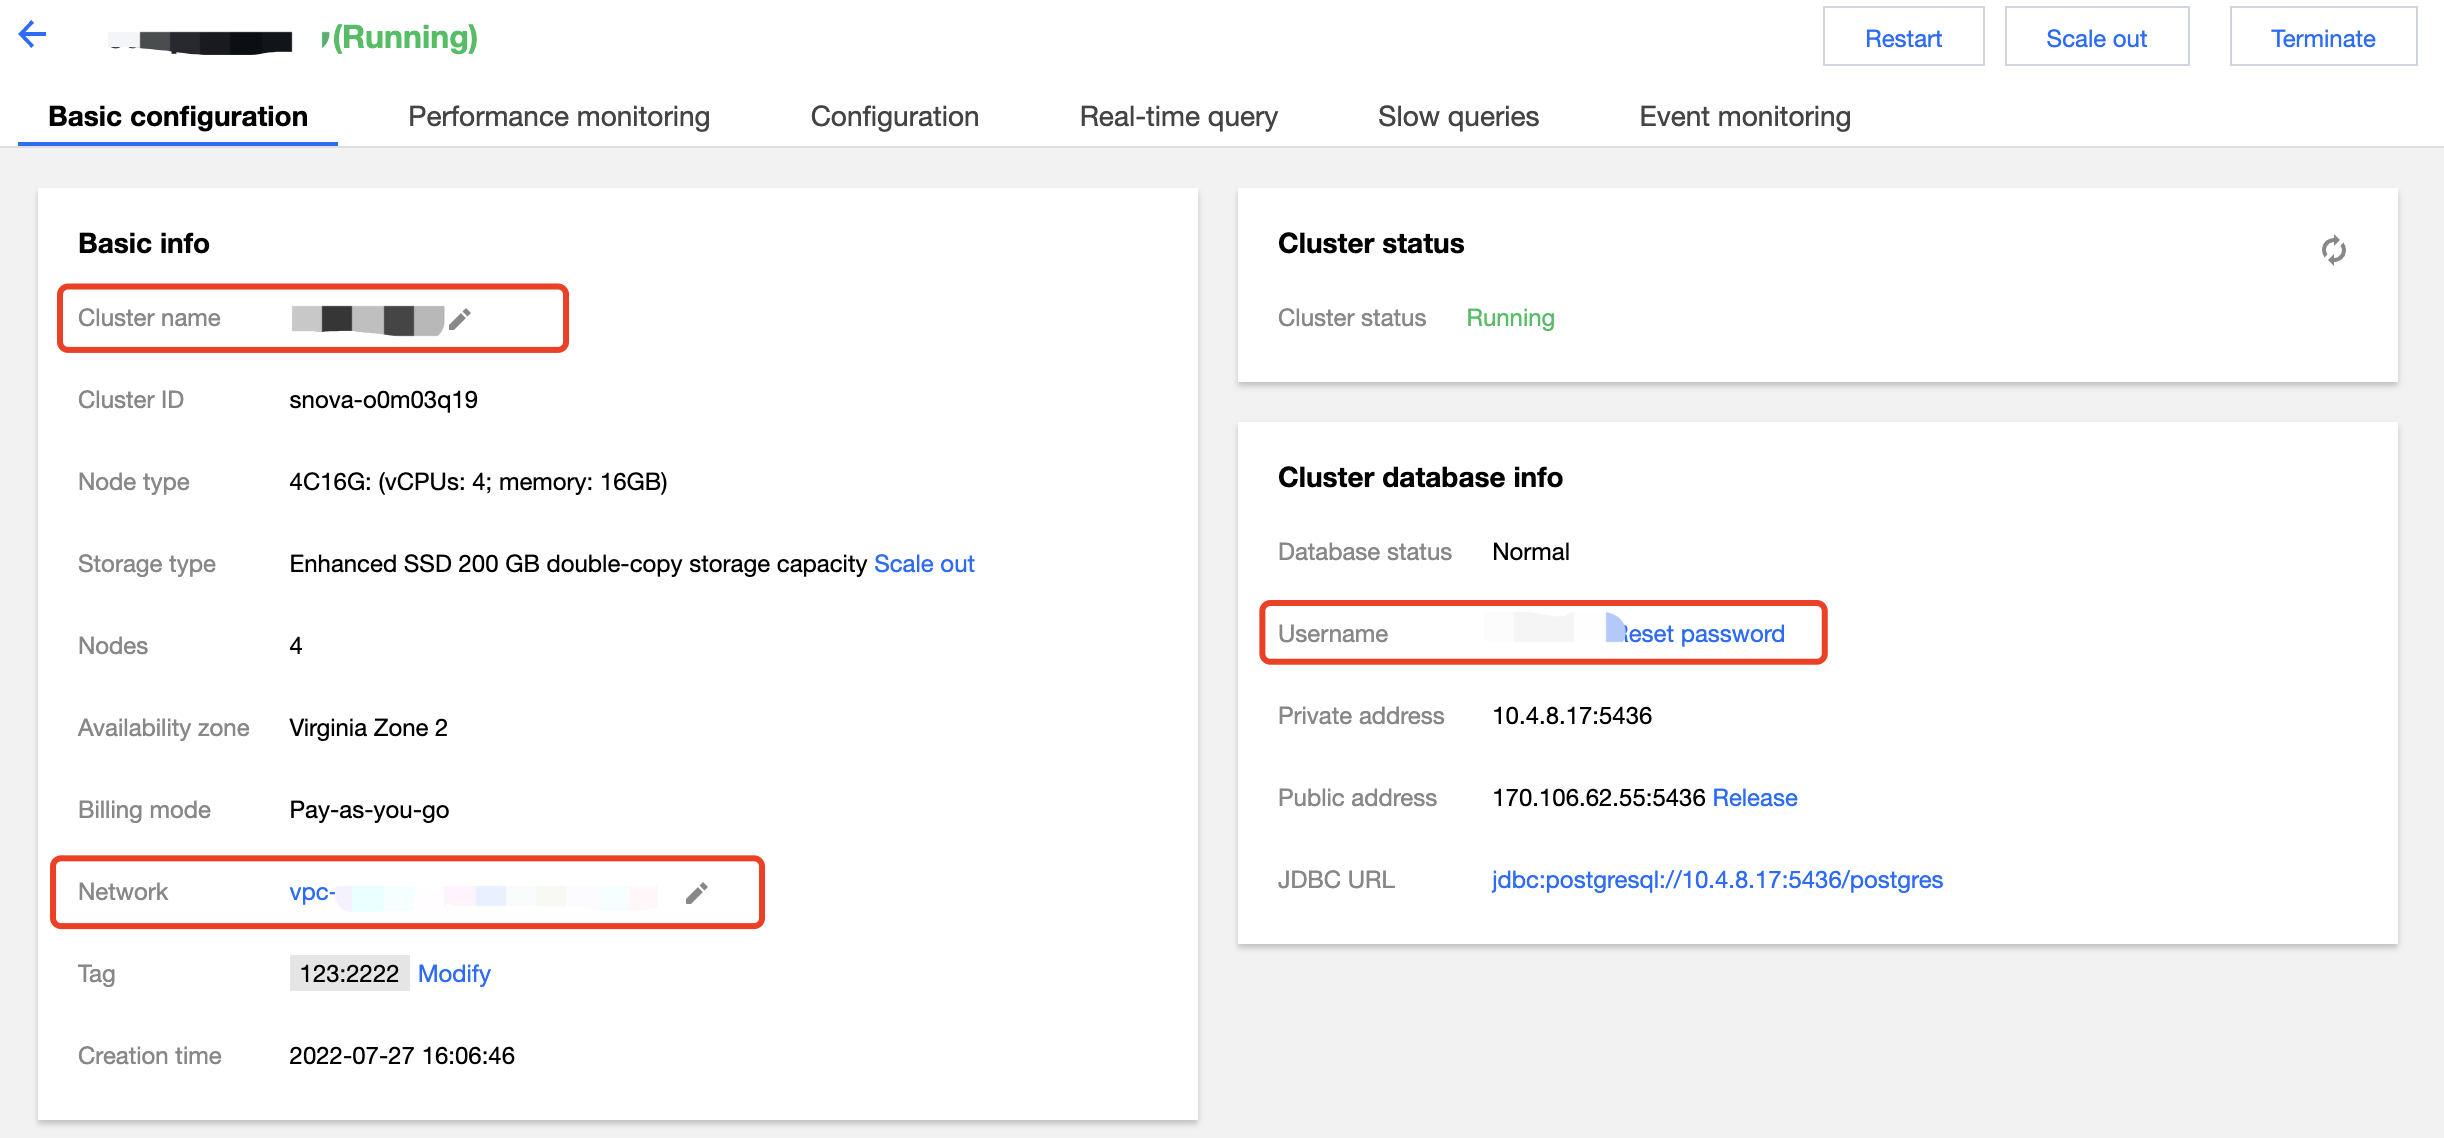
On the cluster list page, enter the Basic Configuration tab of a cluster, where you can set the cluster name, network, and admin user/password.
Note:
Changing the network address will change the cluster access connection, so you need to change the call address simultaneously.


Billing Information

On the Basic Configuration tab, you can switch from pay-as-you-go to monthly subscription billing mode for the cluster and enable Auto-Renewal as needed.

Performance Monitoring

On the Performance Monitoring tab, you can view various the metrics in node and cluster dimensions.

Real-Time Query

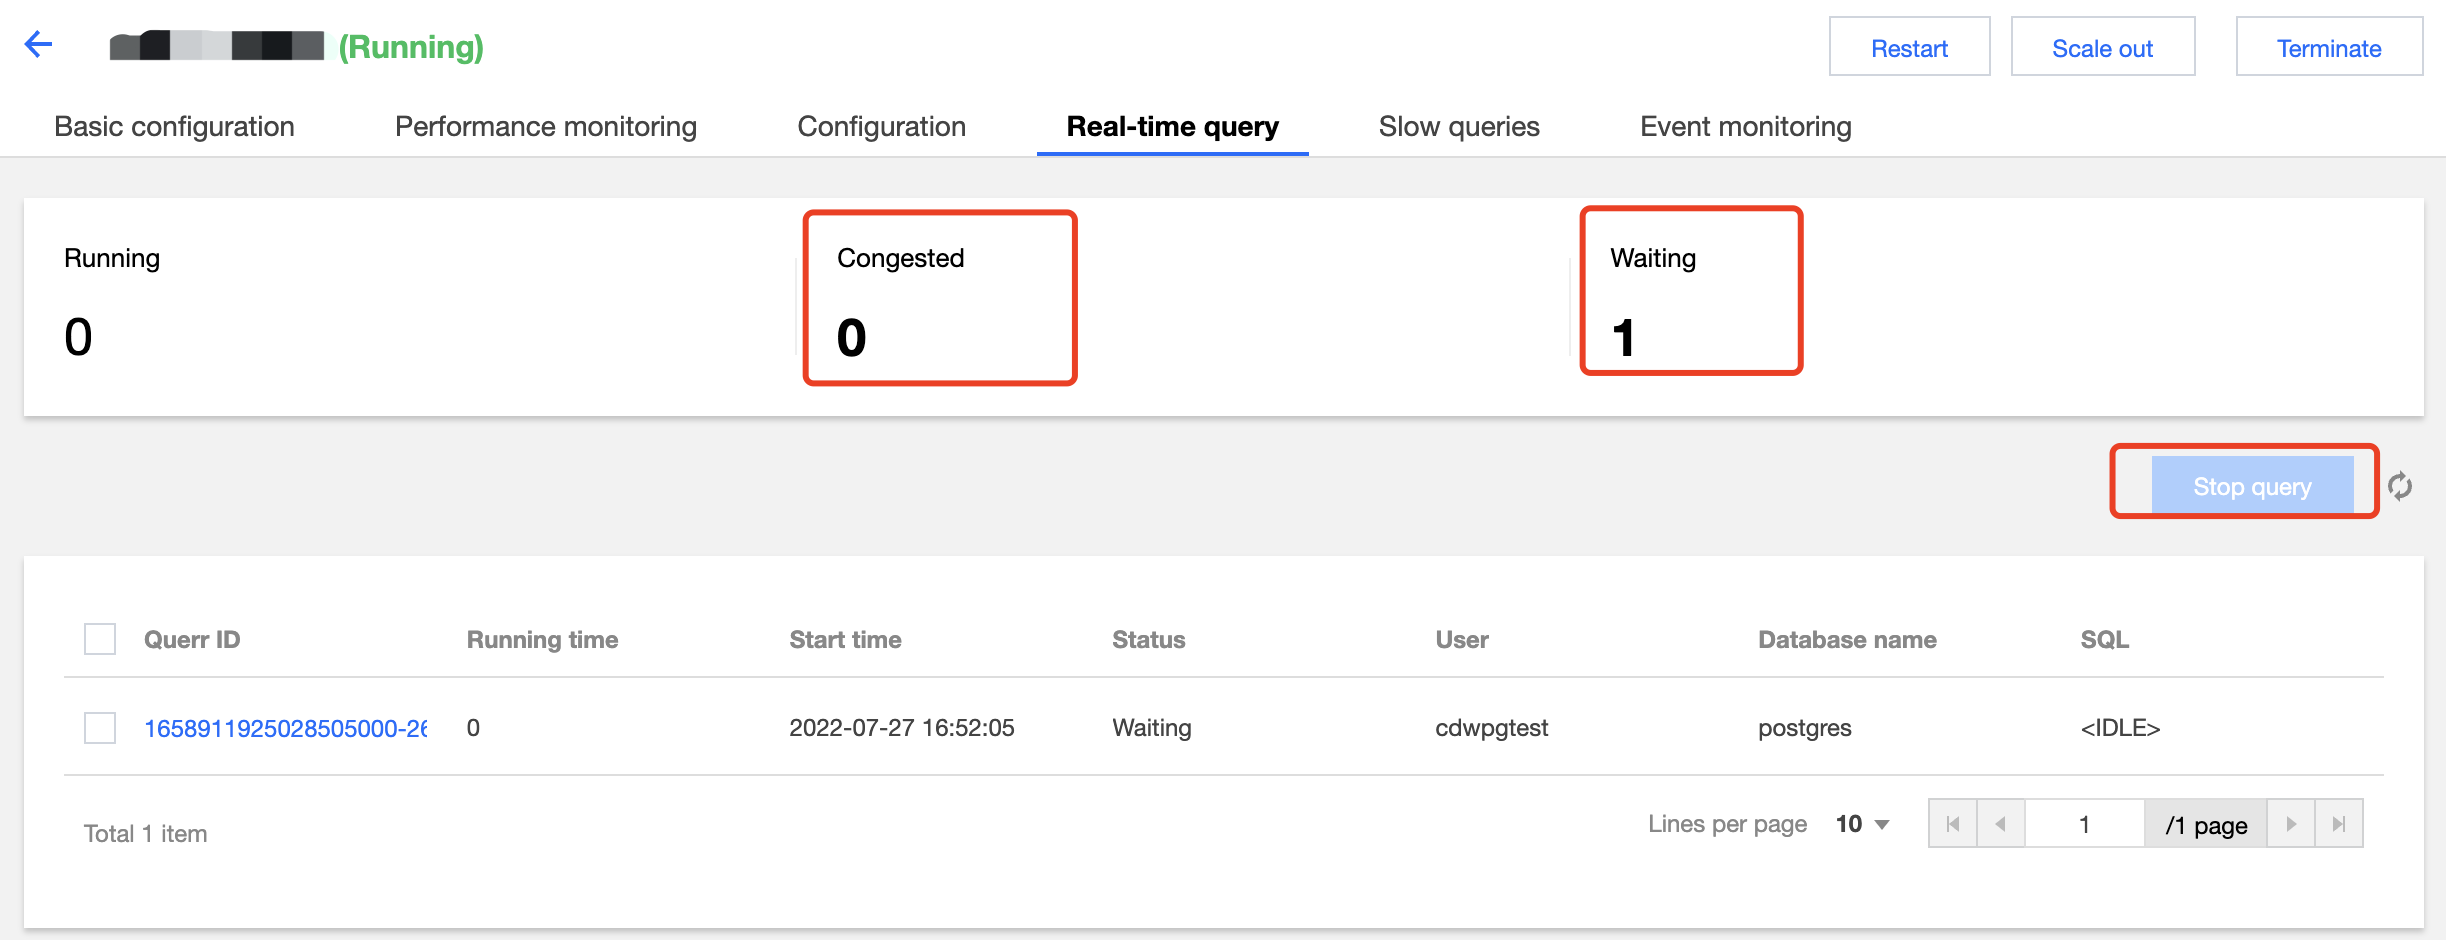
On the Real-Time Query tab, you can view ongoing queries, including running, blocked, and waiting queries.

You can click Terminate Query to terminate a query in the list.
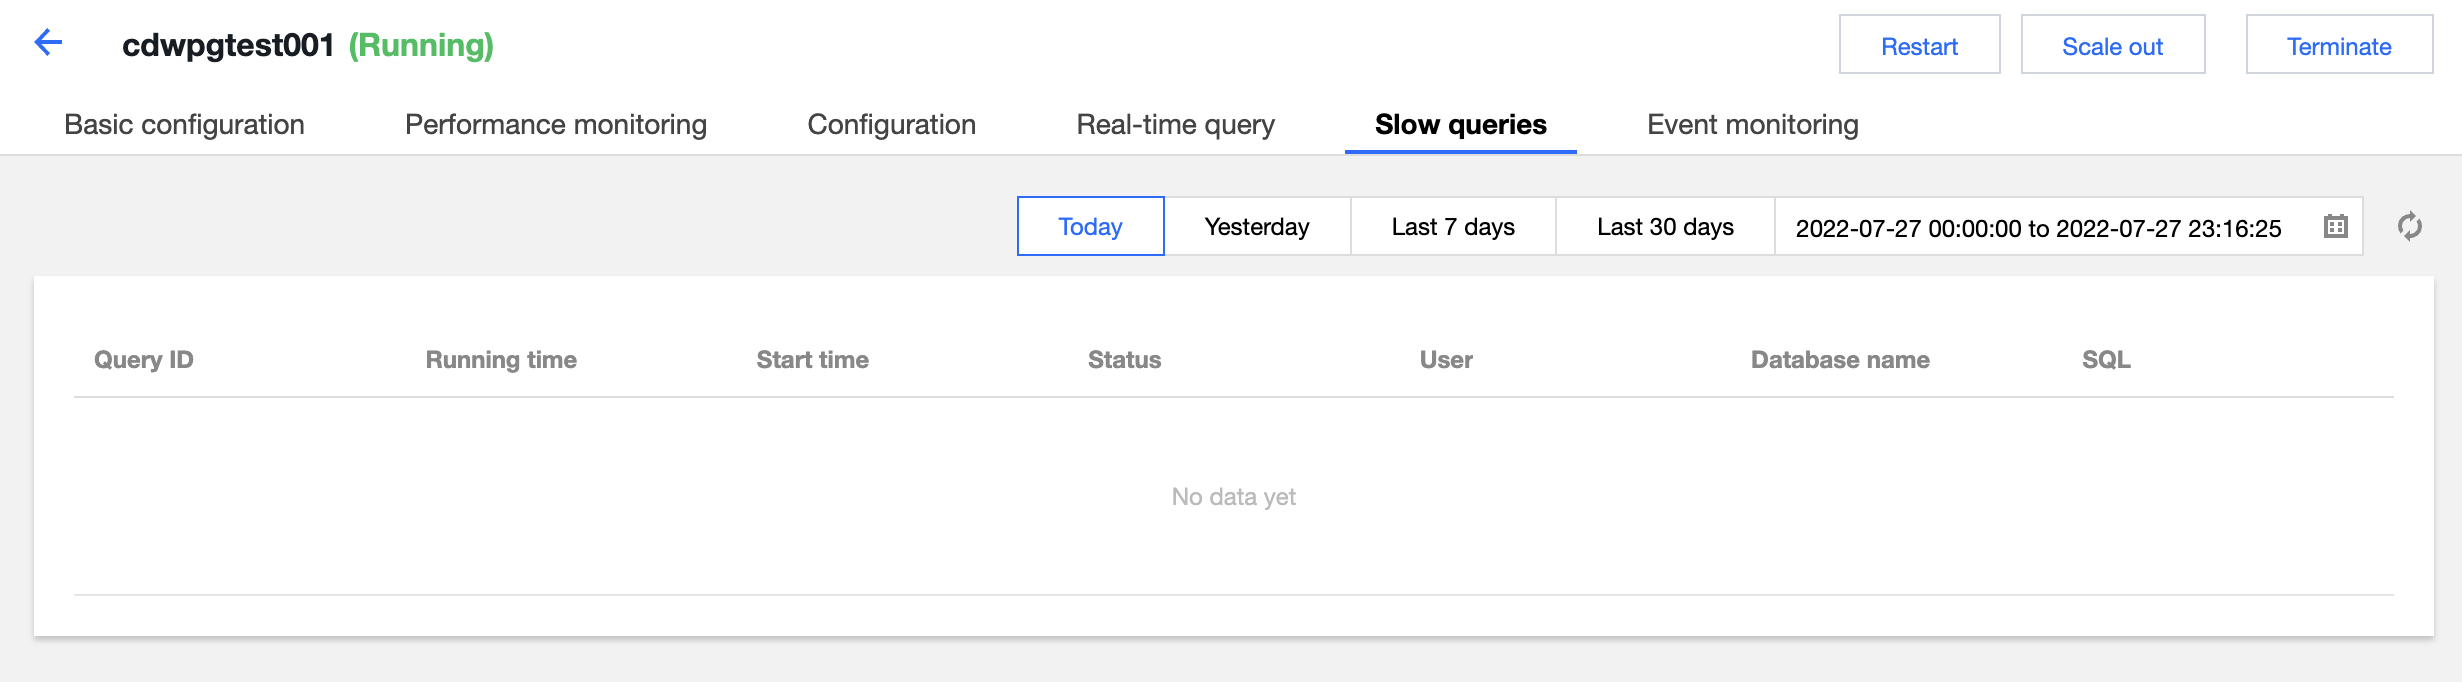
Historical Query

On the Historical Query tab, you can view queries that have been completed or terminated.
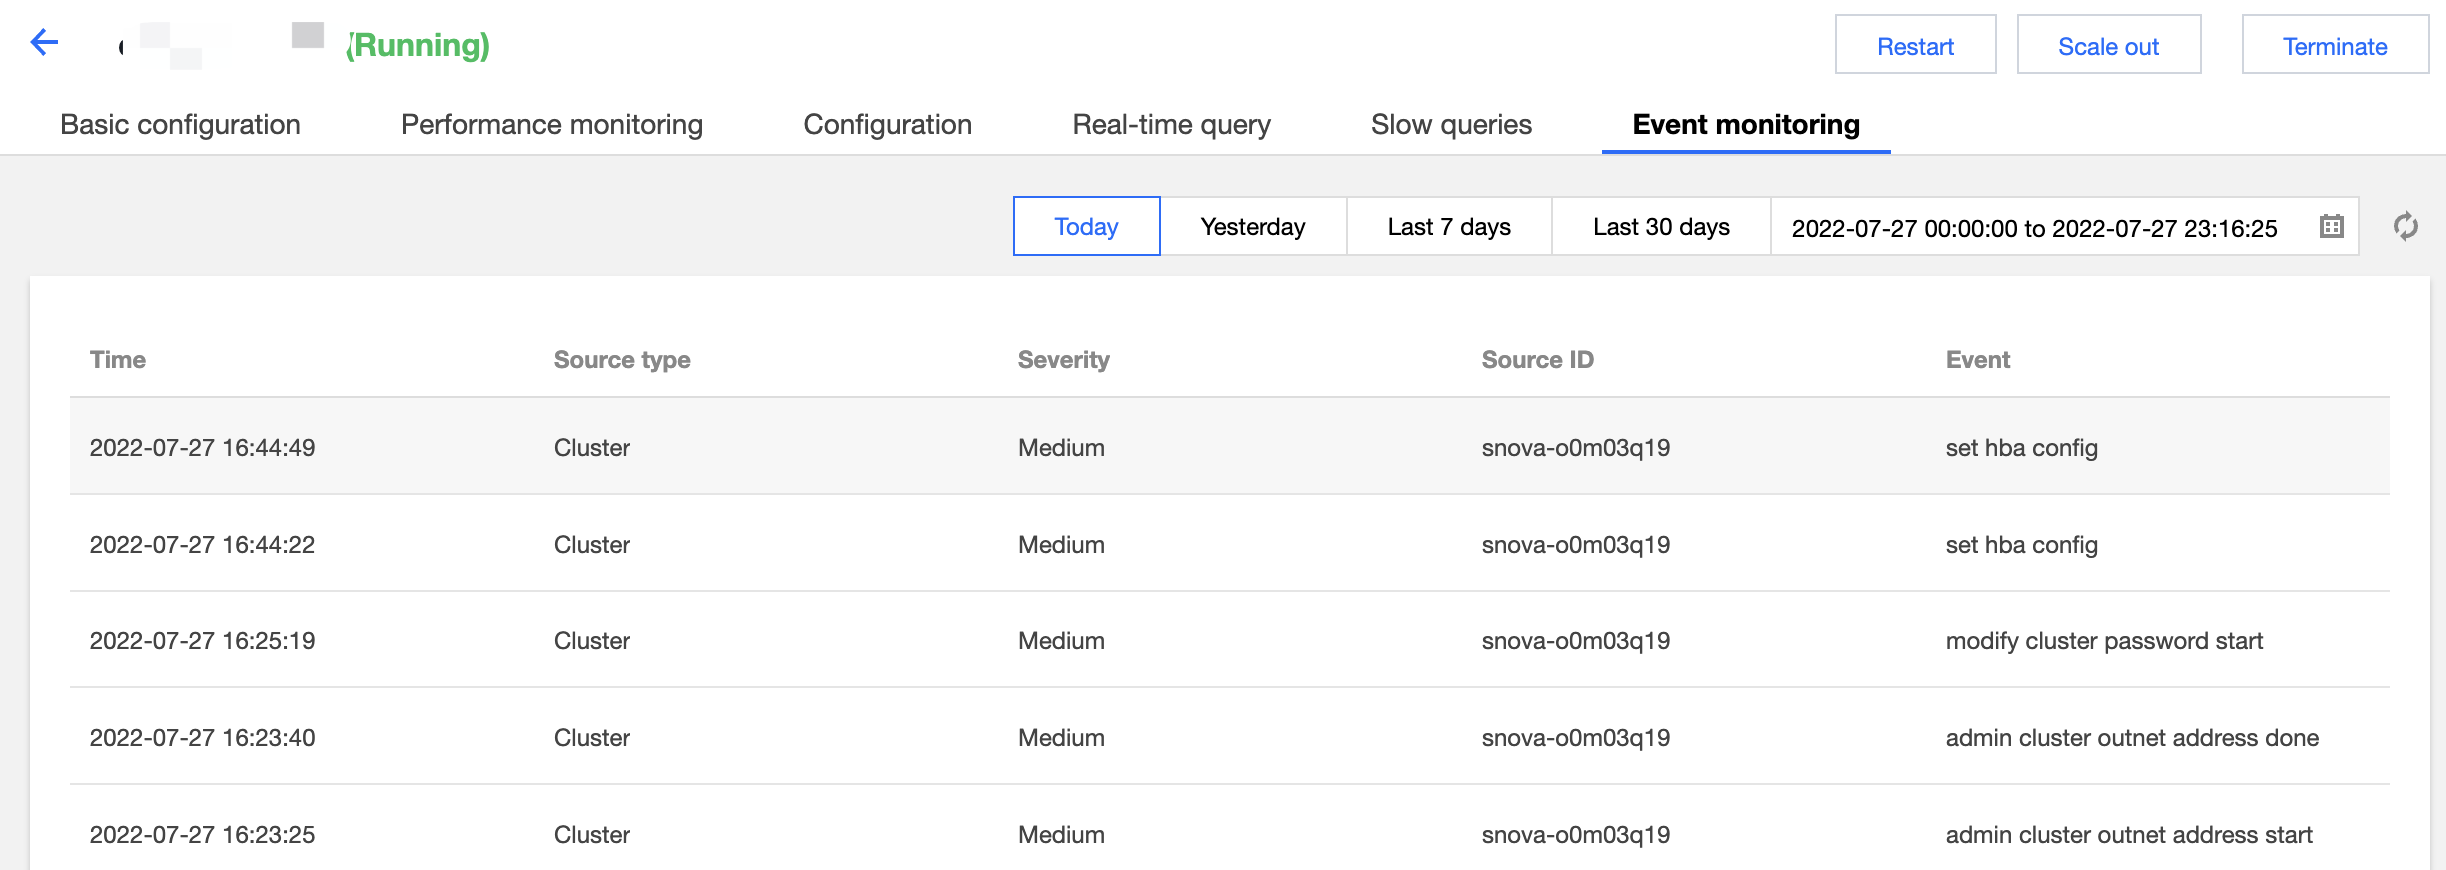


Event Monitoring

On the Event Monitoring tab, you can query sensitive operation events in the cluster.


Bantuan dan Dukungan

Apakah halaman ini membantu?

masukan