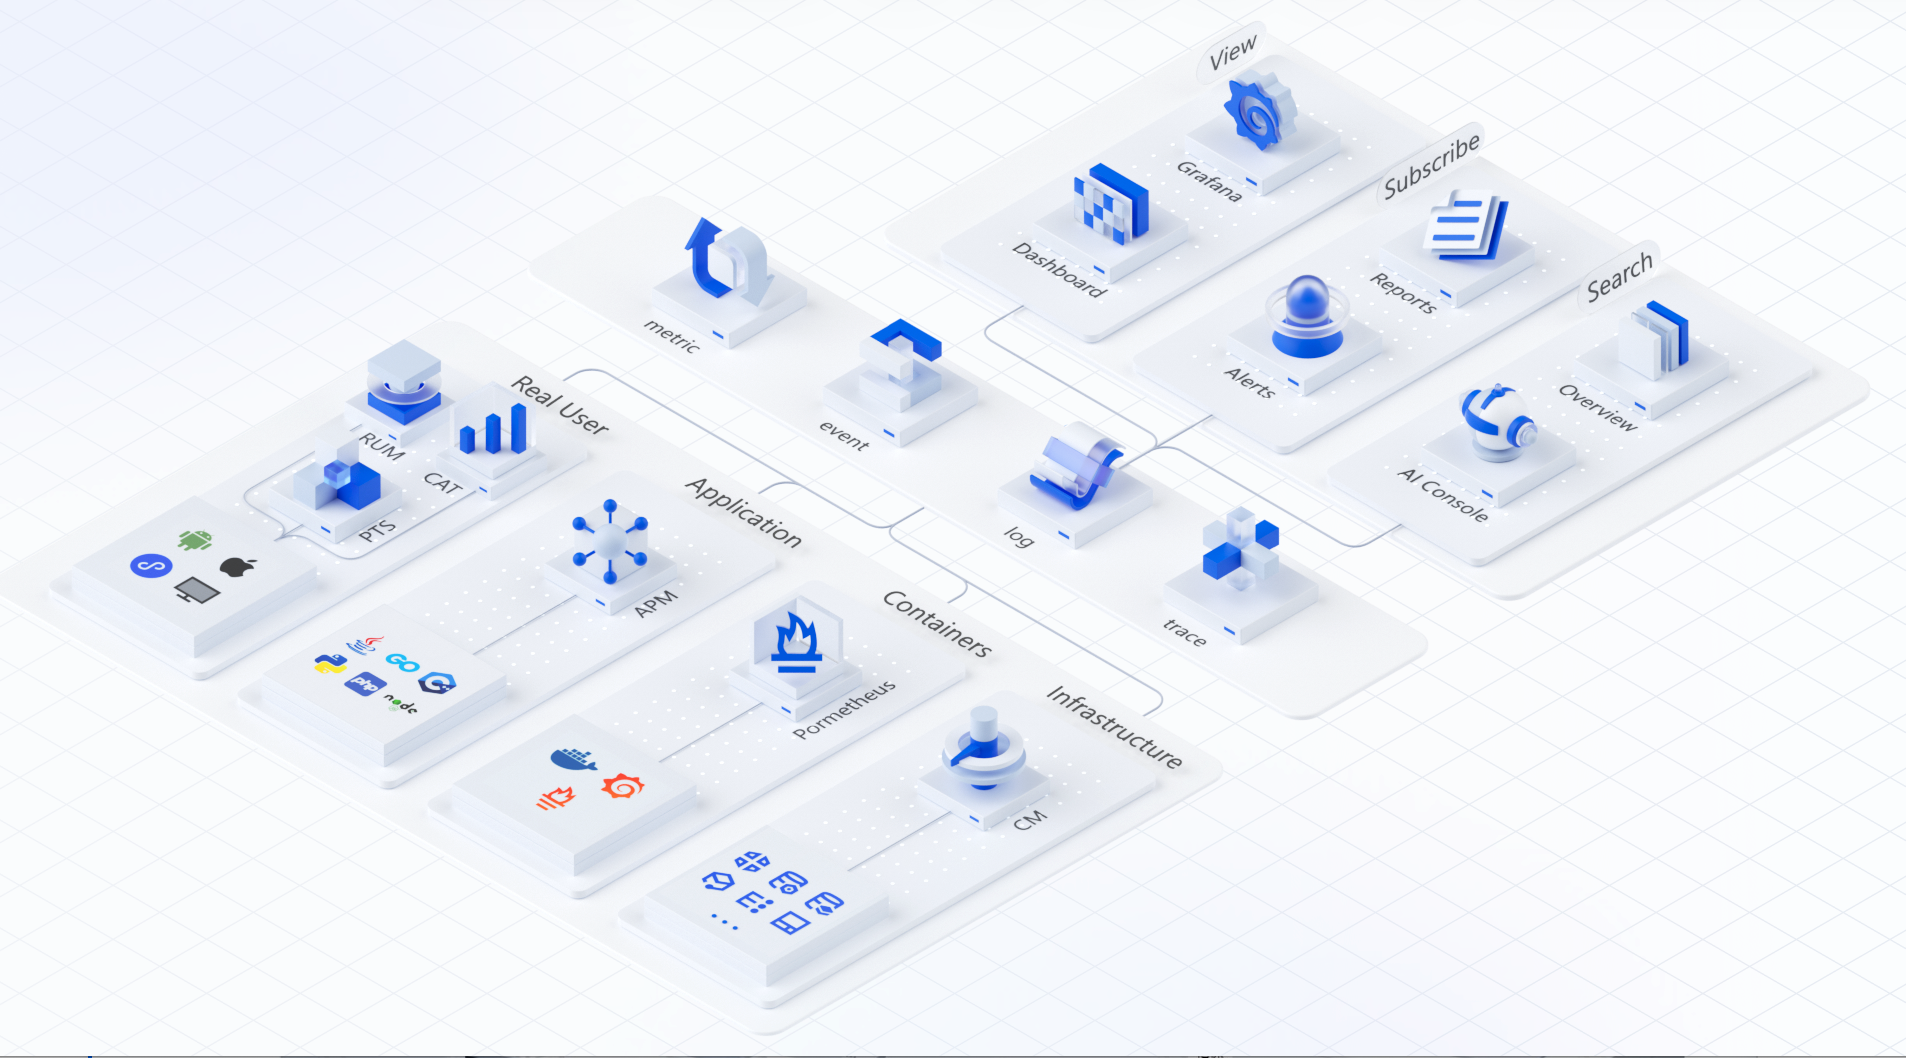
Tencent Cloud Observability Platform (TCOP) offers an integrated monitoring solution based on all types of monitoring data, including metrics, links, logs, and events, combined with powerful visualization and alarm capabilities. TCOP can meet your unified full-link, end-to-end monitoring requirements, improve Ops and troubleshooting efficiency, and ensure healthy and stable business operations.
Introduction to TCOP Subproducts
Subproduct
Product Introduction
Common Use Cases
Application Performance Management (APM)
A one-stop service that covers metrics, links, and logs for application performance monitoring. This service can be easily accessed over open-source protocols to help you effectively accelerate fault troubleshooting and locate architecture bottlenecks.
Locating of application performance bottlenecks
Optimization of application performance to enhance user experience
Terminal Performance Monitoring
A dedicated solution for all-round monitoring of mobile client performance. Starting from real user experience, this solution is designed to help you achieve strong digital business outcomes through crash governance, lag governance, network governance, and other methods.
Mobile app performance optimization
User experience optimization
AI Analysis of the root cause of defects
Real User Monitoring (RUM)
A service for monitoring the real user experience on web and mini program frontends. By leveraging Tencent's many years of experience in internal business operations, this service can monitor page performance and frontend quality in real time by following a non-intrusive connection with just one line of code.
User experience improvement
Fault locating
Frontend performance optimization
Cloud Automated Testing (CAT)
A zero-code availability detection service that simulates the last-mile experience of real users from the perspective of real end users and covers all global regions.
Service quality optimization
Release authentication
Content Delivery Network (CDN) quality assessment
Anti-hijacking and anti-tampering
Performance Testing Service (PTS)
A distributed performance testing service that simulates real business scenarios of a large number of users to comprehensively verify system availability and stability. This service supports over one million concurrent requests and multi-protocol stress testing, and is compatible with the native JMeter engine.
Application performance assessment
Multi-region stress testing
Simulation of complex scenarios
TencentCloud Managed Service for Prometheus (TMP)
A highly available, fully managed, and efficient Ops platform without the need for deployment. This platform is highly integrated with Tencent Kubernetes Engine (TKE) and is compatible with various application components in the open-source ecosystem, reducing development and Ops costs.
TKE monitoring
Cloud Virtual Machine (CVM) monitoring
Custom monitoring
TencentCloud Managed Service for Grafana (TCMG)
A service that provides secure, Ops-free Grafana capabilities, as well as built-in Tencent Cloud plugins for multiple data sources such as TMP, Cloud Log Service (CLS), and TKE, achieving unified data visualization.
Cloud service data visualization
Full-stack monitoring visualization
Log data visualization
Cloud Monitor
A service that supports viewing and pulling the monitoring data for cloud product metrics.
-
Alert Management
A service that provides the alarm feature for monitoring metrics related to Cloud Monitor, CAT, APM, and RUM.
You can set alarm rules for monitoring metrics that affect system performance, enabling the alarm system to automatically check monitoring data and send you alarm notifications when an exception occurs.
Dashboard
An intelligent dashboard that provides visualization and analysis capabilities for monitoring data of cloud product metrics.
Analysis of metric exception causes via Dashboard
EventBridge
A secure, stable, and efficient cloud event connector that serves as a pipeline for automatic collection, processing, and distribution of streaming data and events.