tencent cloud

Tencent Cloud Observability Platform

Release Notes and Announcements
Release Notes
Product Introduction
Overview
Strengths
Basic Features
Basic Concepts
Use Cases
Use Limits
Purchase Guide
Tencent Cloud Product Monitoring
Application Performance Management
Mobile App Performance Monitoring
Real User Monitoring
Cloud Automated Testing
Prometheus Monitoring
Grafana
EventBridge
PTS
Quick Start
Monitoring Overview
Instance Group
Tencent Cloud Product Monitoring
Application Performance Management
Real User Monitoring
Cloud Automated Testing
Performance Testing Service
Prometheus Getting Started
Grafana
Dashboard Creation
EventBridge
Alarm Service
Cloud Product Monitoring
Tencent Cloud Service Metrics
Operation Guide
CVM Agents
Cloud Product Monitoring Integration with Grafana
Troubleshooting
Practical Tutorial
Application Performance Management
Product Introduction
Access Guide
Operation Guide
Practical Tutorial
Parameter Information
FAQs
Mobile App Performance Monitoring
Overview
Operation Guide
Access Guide
Practical Tutorial
Tencent Cloud Real User Monitoring
Product Introduction
Operation Guide
Connection Guide
FAQs
Cloud Automated Testing
Product Introduction
Operation Guide
FAQs
Performance Testing Service
Overview
Operation Guide
Practice Tutorial
JavaScript API List
FAQs
Prometheus Monitoring
Product Introduction
Access Guide
Operation Guide
Practical Tutorial
Terraform
FAQs
Grafana
Product Introduction
Operation Guide
Guide on Grafana Common Features
FAQs
Dashboard
Overview
Operation Guide
Alarm Management
Console Operation Guide
Troubleshooting
FAQs
EventBridge
Product Introduction
Operation Guide
Practical Tutorial
FAQs
Report Management
FAQs
General
Alarm Service
Concepts
Monitoring Charts
CVM Agents
Dynamic Alarm Threshold
CM Connection to Grafana
Documentation Guide
Related Agreements
Application Performance Management Service Level Agreement
APM Privacy Policy
APM Data Processing And Security Agreement
RUM Service Level Agreement
Mobile Performance Monitoring Service Level Agreement
Cloud Automated Testing Service Level Agreement
Prometheus Service Level Agreement
TCMG Service Level Agreements
PTS Service Level Agreement
PTS Use Limits
Cloud Monitor Service Level Agreement
API Documentation
History
Introduction
API Category
Making API Requests
Monitoring Data Query APIs
Alarm APIs
Legacy Alert APIs
Notification Template APIs
TMP APIs
Grafana Service APIs
Event Center APIs
TencentCloud Managed Service for Prometheus APIs
Monitoring APIs
Data Types
Error Codes
Glossary

Custom Monitoring

PDF
Mode fokus
Ukuran font
Terakhir diperbarui: 2024-08-07 21:53:55

Overview

You can use TMP to customize the reported metric monitoring data so as to monitor internal status of applications or services, such as the number of processed requests and the number of orders. You can also monitor the processing duration of some core logic, such as requesting external services.
This document uses Go as an example to describe how to use TMP to customize reported metrics, visualization, and alerting.

Supported Programming Languages

Official SDKs from the native Prometheus community:
Third-Party SDKs for other programming languages:
Lua for NGINX
Lua for Tarantool
For more information, please see CLIENT LIBRARIES.

Data Model

Prometheus has multidimensional analysis capabilities. A data model consists of the following parts:
Metric Name + Labels + Timestamp + Value/Sample
Metric Name: monitoring object (for example, http_request_total indicates the current total number of HTTP requests received by the system).
Labels: characteristics dimensions of the current sample, which are in K/V structure. Through such dimensions, Prometheus can filter, aggregate, and perform other operations on the sample data.
Timestamp: a timestamp accurate down to the millisecond
Value: a float64 value, which indicates the current sample value.
Metric Name/Labels can contain only ASCII characters, digits, underscores, and colons and must comply with the regular expression [a-zA-Z_:][a-zA-Z0-9_:]*.
For more information on a data model, please see DATA MODEL.
For the best practice of metric and label naming, please see METRIC AND LABEL NAMING.

Metric Tracking Method

Prometheus provides four metric types for different monitoring scenarios: Counter, Gauge, Histogram, and Summary, as described below. For more information, please see METRIC TYPES.
The Prometheus community provides SDKs for multiple programing languages, all of which are basically similar in usage but differ mostly in syntax. This document uses Go as an example to describe how to report custom monitoring metrics.

Counter

A metric in Counter type increases monotonically and will be reset after service restart. You can use counters to monitor the numbers of requests, exceptions, user logins, orders, etc.
You can use a counter to monitor the number of orders as follows:
package order

import (
"github.com/prometheus/client_golang/prometheus"
"github.com/prometheus/client_golang/prometheus/promauto"
)

// Define the counter object to be monitored
var (
opsProcessed = promauto.NewCounterVec(prometheus.CounterOpts{
Name: "order_service_processed_orders_total",
Help: "The total number of processed orders",
}, []string{"status"}) // Processing status
)

// Process the order
func makeOrder() {
opsProcessed.WithLabelValues("success").Inc() // Success
// opsProcessed.WithLabelValues("fail").Inc() // Failure

// Order placement business logic
}
For example, you can use the rate() function to get the order increase rate:
rate(order_service_processed_orders_total[5m])

Gauge

A gauge is a current value, which can be increased or reduced during metric timestamping. You can use gauges to monitor the current memory utilization, CPU utilization, current number of threads, queue size, etc.
You can use a gauge to monitor the size of an order queue as follows:
package order

import (
"github.com/prometheus/client_golang/prometheus"
"github.com/prometheus/client_golang/prometheus/promauto"
)

// Define the gauge object to be monitored
var (
queueSize = promauto.NewGaugeVec(prometheus.GaugeOpts{
Name: "order_service_order_queue_size",
Help: "The size of order queue",
}, []string{"type"})
)

type OrderQueue struct {
queue chan string
}

func newOrderQueue() *OrderQueue {
return &OrderQueue{
queue: make(chan string,100),
}
}

// Produce an order message
func (q *OrderQueue)produceOrder() {
// Produce an order message

// Increase the queue size by 1
queueSize.WithLabelValues("make_order").Inc() // Order placement queue
// queueSize.WithLabelValues("cancel_order").Inc() // Order cancellation queue
}

// Consume an order message
func (q *OrderQueue)consumeOrder() {
// Consume an order message

// Reduce the queue size by 1
queueSize.WithLabelValues("make_order").Dec()
}
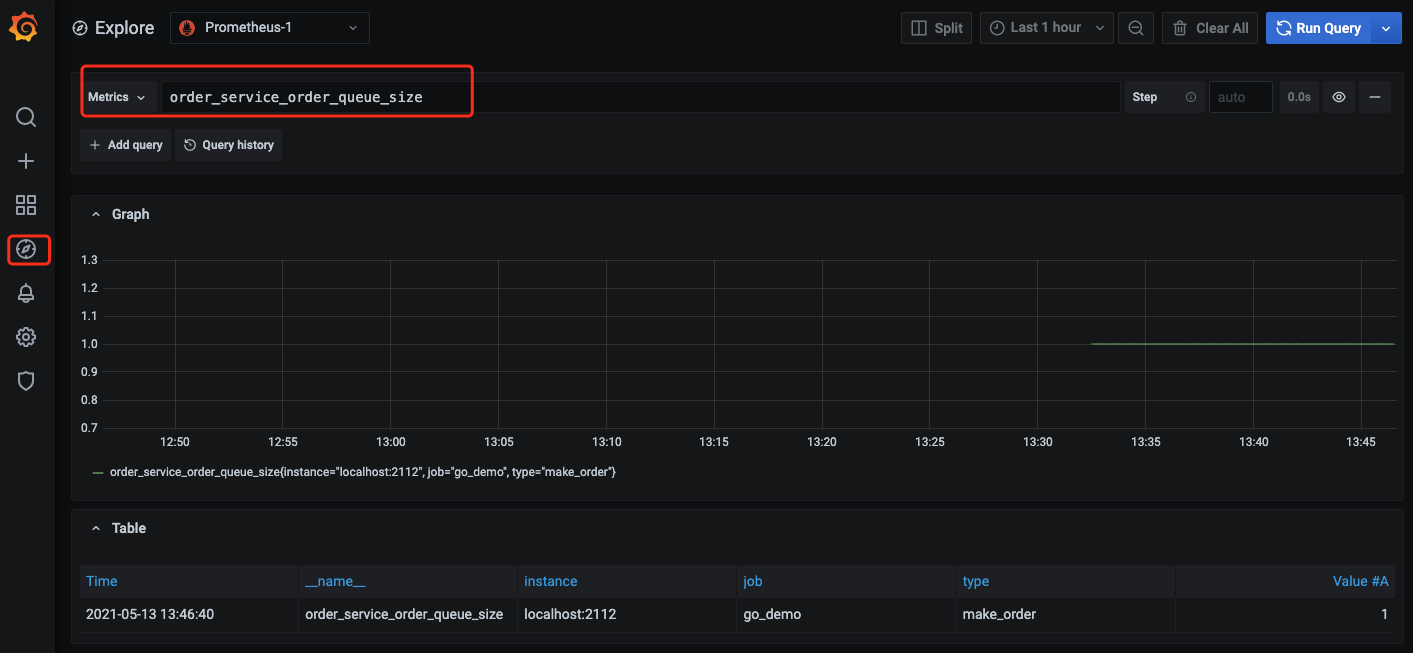
You can use the gauge metric to directly view the current size of each type of queue of an order:
order_service_order_queue_size

Histogram

Prometheus calculates the sample distribution based on the configured Bucket to generate a histogram, which can be processed subsequently and is generally used for duration monitoring. For example, you can use a histogram to calculate the latencies of P99, P95, and P50 and monitor the numbers of processed items. With histograms, you don't need to use counters to count items. In addition, you can use histograms to monitor metrics such as API response time and database access time.
A histogram can be used in a similar way to a summary, so you can directly refer to the summary usage.

Summary

A summary is similar to a histogram, as it also calculates the sample distribution, but their differences lie in that a summary calculates the distribution (P99/P95/Sum/Count) on the client and therefore uses more client resources, and the data cannot be calculated and processed in an aggregated manner subsequently. You can use summaries to monitor metrics such as API response time and database access duration.
You can use a summary to monitor the order processing duration as follows:
package order

import (
"net/http"
"time"

"github.com/prometheus/client_golang/prometheus"
"github.com/prometheus/client_golang/prometheus/promauto"
"github.com/prometheus/client_golang/prometheus/promhttp"
)

// Define the summary object to be monitored
var (
opsProcessCost = promauto.NewSummaryVec(prometheus.SummaryOpts{
Name: "order_service_process_order_duration",
Help: "The order process duration",
}, []string{"status"})
)

func makeOrder() {
start := time.Now().UnixNano()
// The order placement logic processing is completed, and the processing duration is recorded
defer opsProcessCost.WithLabelValues("success").Observe((float64)(time.Now().UnixNano() - start))

// Order placement business logic
time.Sleep(time.Second) // Simulate the processing duration
}
You can use a summary metric to directly view the average order placement processing duration:
order_service_processed_order_duration_sum / order_service_processed_order_duration_count

Exposing Prometheus metrics

Use promhttp.Handler() to expose the metric tracking data to the HTTP service.
package main

import (
"net/http"

"github.com/prometheus/client_golang/prometheus/promhttp"
)

func main() {
// Business code

// Expose Prometheus metrics in the HTTP service
http.Handle("/metrics", promhttp.Handler())

// Business code
}


Collecting Data

After the tracking of custom metrics for your business is completed and the application is released, you can use Prometheus to collect the monitoring metric data. For more information, please see Go Integration.

Viewing Monitoring Data and Alerts

Open the Grafana service that comes with TMP and use Explore to view the monitoring metric data as shown below. You can also customize Grafana monitoring dashboards.


You can use Prometheus together with the alarming capabilities of Cloud Monitor to trigger alerts for custom monitoring metrics in real time. For more information, please see Alert Overview and Usage.

Bantuan dan Dukungan

Apakah halaman ini membantu?

masukan