tencent cloud

Tencent Cloud Observability Platform

Release Notes and Announcements
Release Notes
Product Introduction
Overview
Strengths
Basic Features
Basic Concepts
Use Cases
Use Limits
Purchase Guide
Tencent Cloud Product Monitoring
Application Performance Management
Mobile App Performance Monitoring
Real User Monitoring
Cloud Automated Testing
Prometheus Monitoring
Grafana
EventBridge
PTS
Quick Start
Monitoring Overview
Instance Group
Tencent Cloud Product Monitoring
Application Performance Management
Real User Monitoring
Cloud Automated Testing
Performance Testing Service
Prometheus Getting Started
Grafana
Dashboard Creation
EventBridge
Alarm Service
Cloud Product Monitoring
Tencent Cloud Service Metrics
Operation Guide
CVM Agents
Cloud Product Monitoring Integration with Grafana
Troubleshooting
Practical Tutorial
Application Performance Management
Product Introduction
Access Guide
Operation Guide
Practical Tutorial
Parameter Information
FAQs
Mobile App Performance Monitoring
Overview
Operation Guide
Access Guide
Practical Tutorial
Tencent Cloud Real User Monitoring
Product Introduction
Operation Guide
Connection Guide
FAQs
Cloud Automated Testing
Product Introduction
Operation Guide
FAQs
Performance Testing Service
Overview
Operation Guide
Practice Tutorial
JavaScript API List
FAQs
Prometheus Monitoring
Product Introduction
Access Guide
Operation Guide
Practical Tutorial
Terraform
FAQs
Grafana
Product Introduction
Operation Guide
Guide on Grafana Common Features
FAQs
Dashboard
Overview
Operation Guide
Alarm Management
Console Operation Guide
Troubleshooting
FAQs
EventBridge
Product Introduction
Operation Guide
Practical Tutorial
FAQs
Report Management
FAQs
General
Alarm Service
Concepts
Monitoring Charts
CVM Agents
Dynamic Alarm Threshold
CM Connection to Grafana
Documentation Guide
Related Agreements
Application Performance Management Service Level Agreement
APM Privacy Policy
APM Data Processing And Security Agreement
RUM Service Level Agreement
Mobile Performance Monitoring Service Level Agreement
Cloud Automated Testing Service Level Agreement
Prometheus Service Level Agreement
TCMG Service Level Agreements
PTS Service Level Agreement
PTS Use Limits
Cloud Monitor Service Level Agreement
API Documentation
History
Introduction
API Category
Making API Requests
Monitoring Data Query APIs
Alarm APIs
Legacy Alert APIs
Notification Template APIs
TMP APIs
Grafana Service APIs
Event Center APIs
TencentCloud Managed Service for Prometheus APIs
Monitoring APIs
Data Types
Error Codes
Glossary

Adjusting Collection Interval

PDF
Mode fokus
Ukuran font
Terakhir diperbarui: 2024-08-08 10:02:32
This document describes how to adjust the sampling interval of TMP to avoid unnecessary expenses.

Prerequisites

Before configuring monitoring collection items, you need to perform the following operations:

Adjusting Collection Interval via TCOP Console

1. Log in to the TCOP console, and click Prometheus Monitoring in the left sidebar.
2. On the instance list page, select the name of the instance that requires configuring data collection rules and enter its details page.
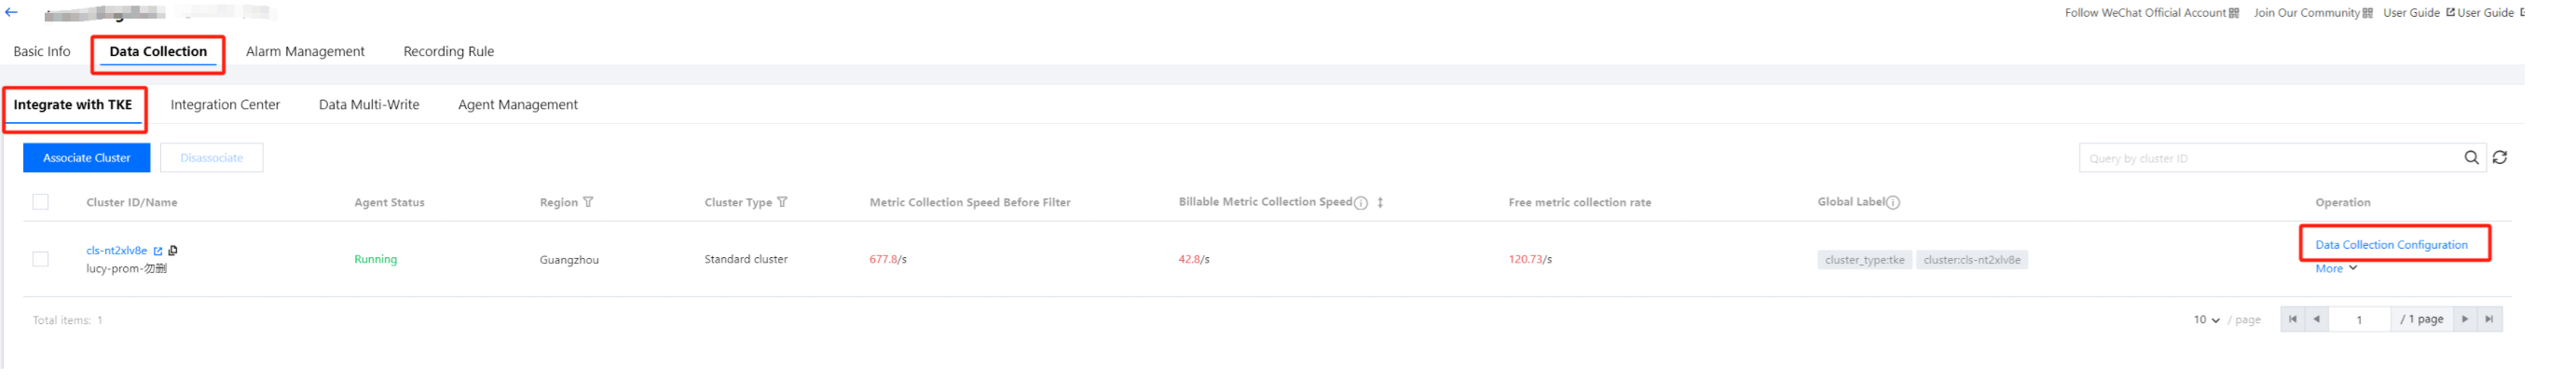
3. On the Data Collection page, select Integrate with TKE , click Data Collection Configuration on the right side of the cluster, as shown in the following figure:


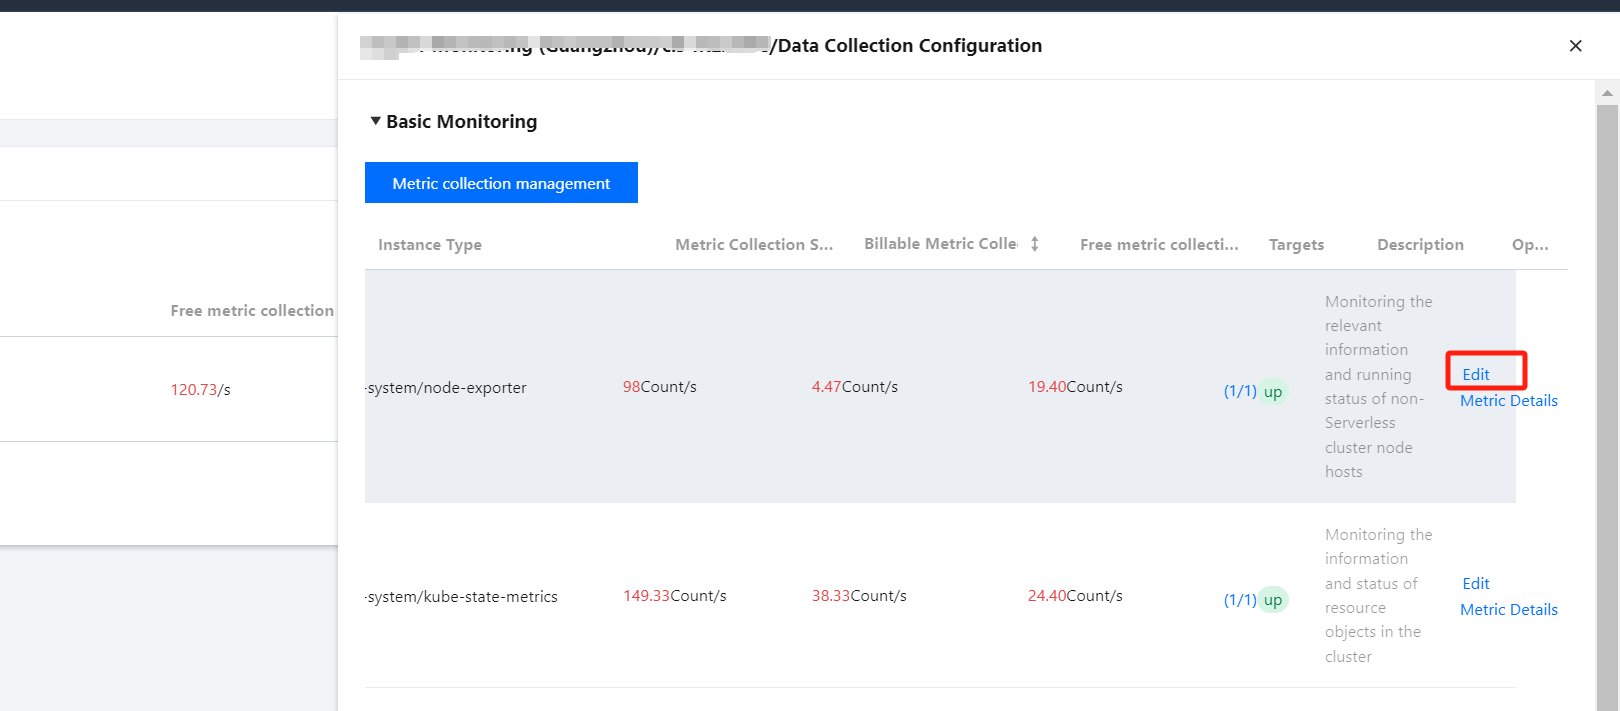
4. In the data collection configuration window, click Edit in the operation bar, as shown below:


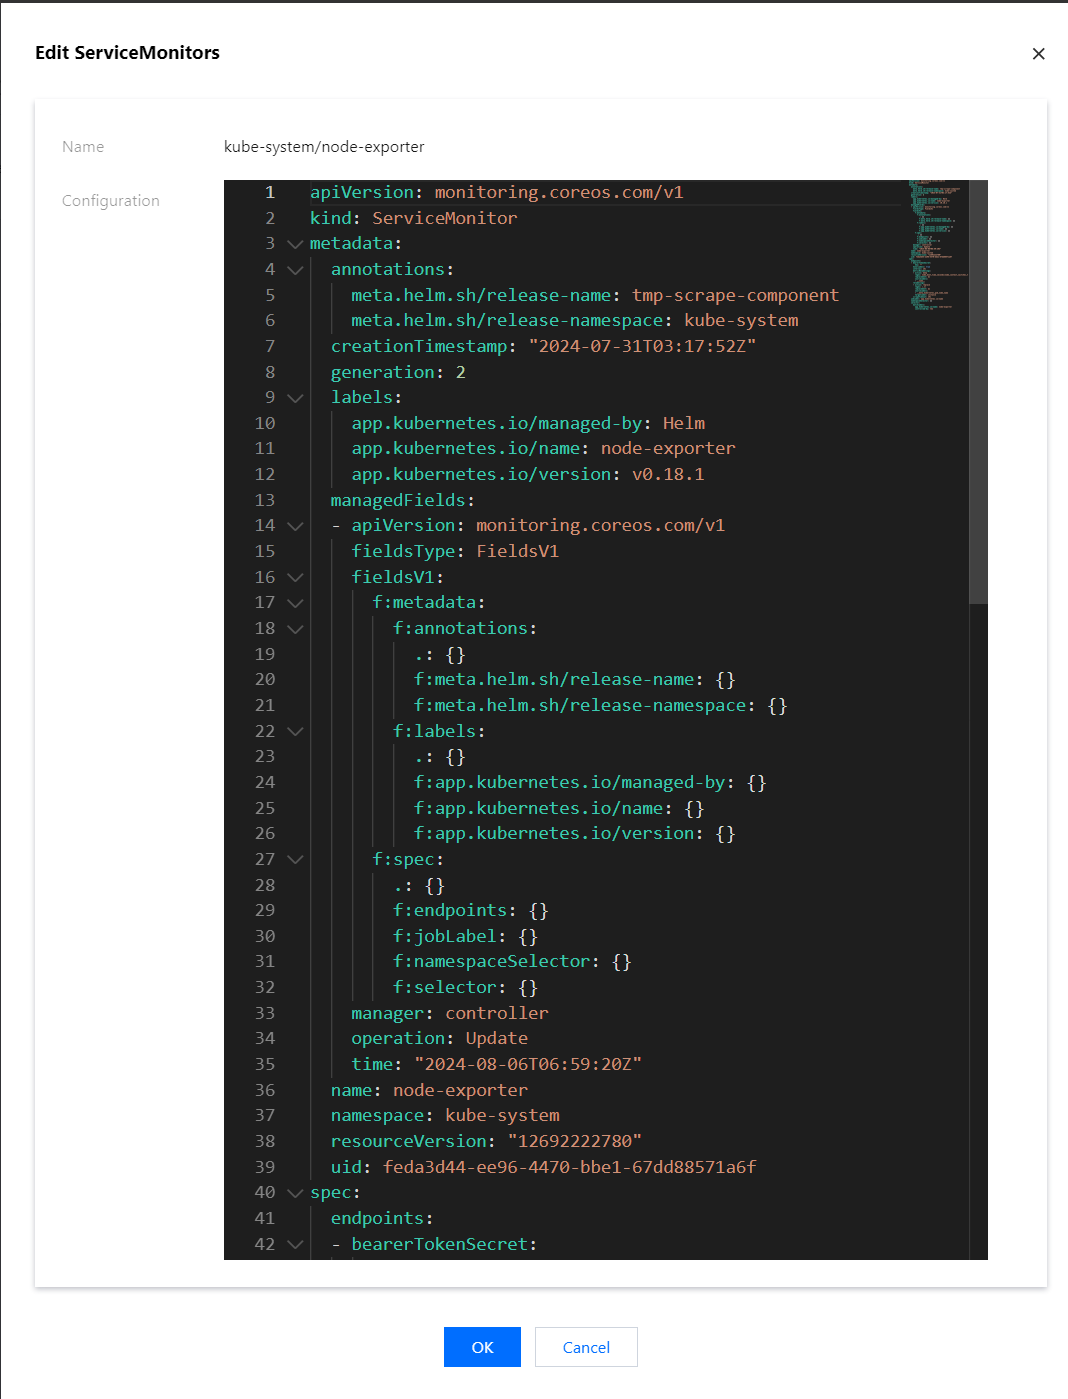
5. Find the interval field, which represents the collection interval. You can increase its value to reduce data storage costs, as shown below:


6. Click Confirm after completing the configuration.

Adjusting Collection Interval via Integration Center

Note:
The Scraping Task application should have been installed and integrated. If it is not installed, click One-click installation on the right before you proceed with the following steps.
1. Log in to the TCOP console, and click Prometheus Monitoring in the left sidebar.
2. On the instance list page, select the name of the instance that requires configuring data collection rules and enter its details page.
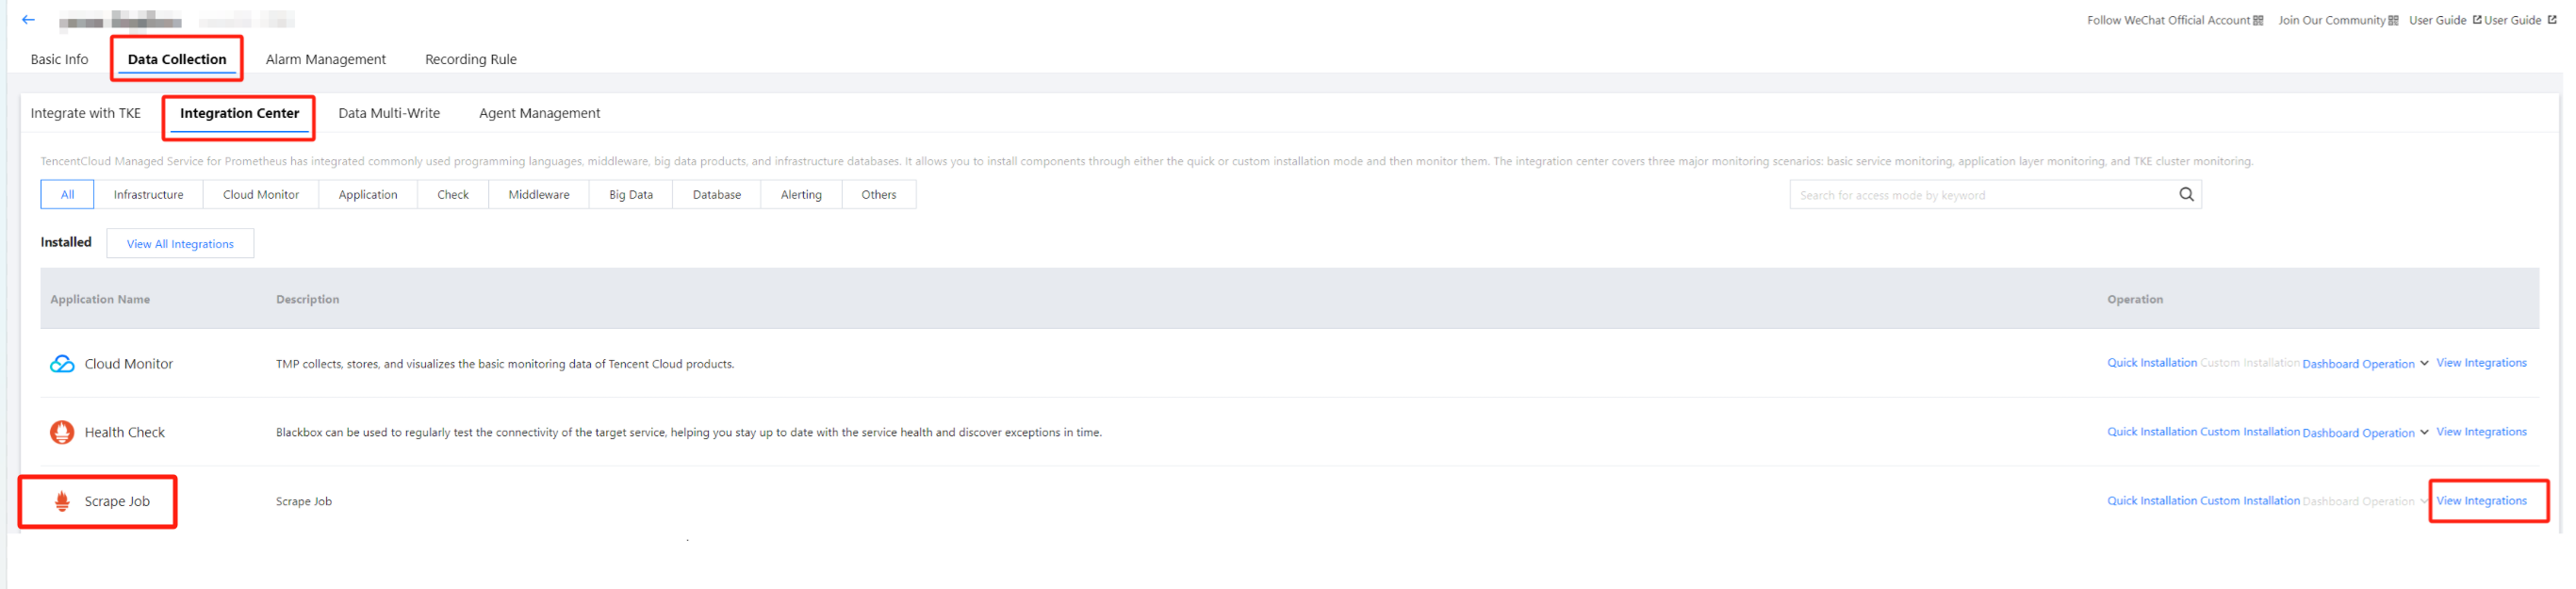
3. On the Data Collection page, click Integration Center, find Scrape Job, and click View Integrations on the right, as shown below:


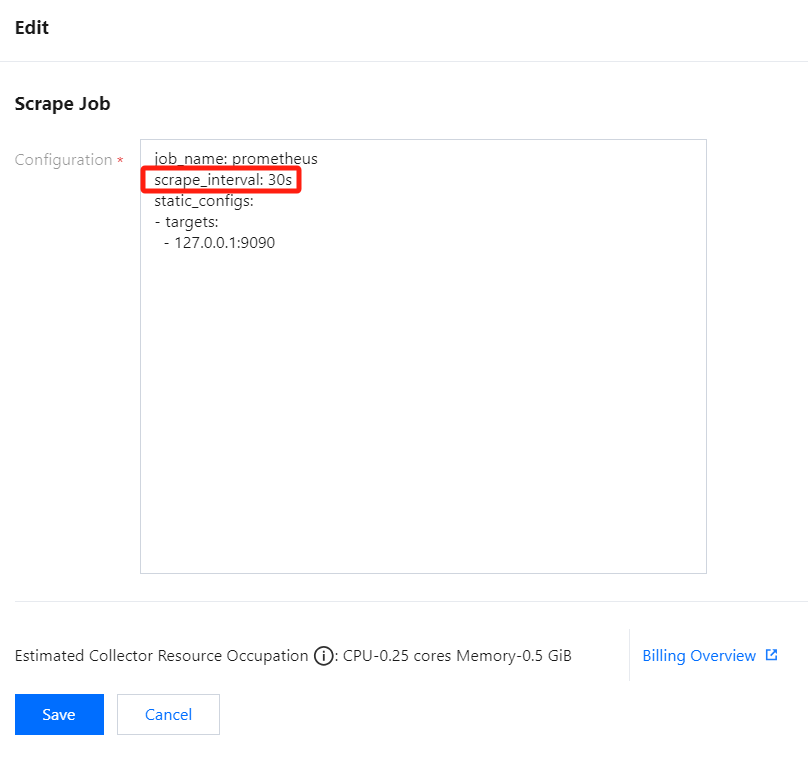
4. On the page that appears, click any name to enter the collection tasks configuration page. Then, find the scrape_interval field, which represents the collection interval. You can increase its value to reduce data storage costs, as shown below:


5. Click Save after completing the configuration.

Bantuan dan Dukungan

Apakah halaman ini membantu?

masukan