tencent cloud

Tencent Cloud Observability Platform

Release Notes and Announcements
Release Notes
Product Introduction
Overview
Strengths
Basic Features
Basic Concepts
Use Cases
Use Limits
Purchase Guide
Tencent Cloud Product Monitoring
Application Performance Management
Mobile App Performance Monitoring
Real User Monitoring
Cloud Automated Testing
Prometheus Monitoring
Grafana
EventBridge
PTS
Quick Start
Monitoring Overview
Instance Group
Tencent Cloud Product Monitoring
Application Performance Management
Real User Monitoring
Cloud Automated Testing
Performance Testing Service
Prometheus Getting Started
Grafana
Dashboard Creation
EventBridge
Alarm Service
Cloud Product Monitoring
Tencent Cloud Service Metrics
Operation Guide
CVM Agents
Cloud Product Monitoring Integration with Grafana
Troubleshooting
Practical Tutorial
Application Performance Management
Product Introduction
Access Guide
Operation Guide
Practical Tutorial
Parameter Information
FAQs
Mobile App Performance Monitoring
Overview
Operation Guide
Access Guide
Practical Tutorial
Tencent Cloud Real User Monitoring
Product Introduction
Operation Guide
Connection Guide
FAQs
Cloud Automated Testing
Product Introduction
Operation Guide
FAQs
Performance Testing Service
Overview
Operation Guide
Practice Tutorial
JavaScript API List
FAQs
Prometheus Monitoring
Product Introduction
Access Guide
Operation Guide
Practical Tutorial
Terraform
FAQs
Grafana
Product Introduction
Operation Guide
Guide on Grafana Common Features
FAQs
Dashboard
Overview
Operation Guide
Alarm Management
Console Operation Guide
Troubleshooting
FAQs
EventBridge
Product Introduction
Operation Guide
Practical Tutorial
FAQs
Report Management
FAQs
General
Alarm Service
Concepts
Monitoring Charts
CVM Agents
Dynamic Alarm Threshold
CM Connection to Grafana
Documentation Guide
Related Agreements
Application Performance Management Service Level Agreement
APM Privacy Policy
APM Data Processing And Security Agreement
RUM Service Level Agreement
Mobile Performance Monitoring Service Level Agreement
Cloud Automated Testing Service Level Agreement
Prometheus Service Level Agreement
TCMG Service Level Agreements
PTS Service Level Agreement
PTS Use Limits
Cloud Monitor Service Level Agreement
API Documentation
History
Introduction
API Category
Making API Requests
Monitoring Data Query APIs
Alarm APIs
Legacy Alert APIs
Notification Template APIs
TMP APIs
Grafana Service APIs
Event Center APIs
TencentCloud Managed Service for Prometheus APIs
Monitoring APIs
Data Types
Error Codes
Glossary

Database Overview

PDF
Mode fokus
Ukuran font
Terakhir diperbarui: 2024-11-01 17:47:24
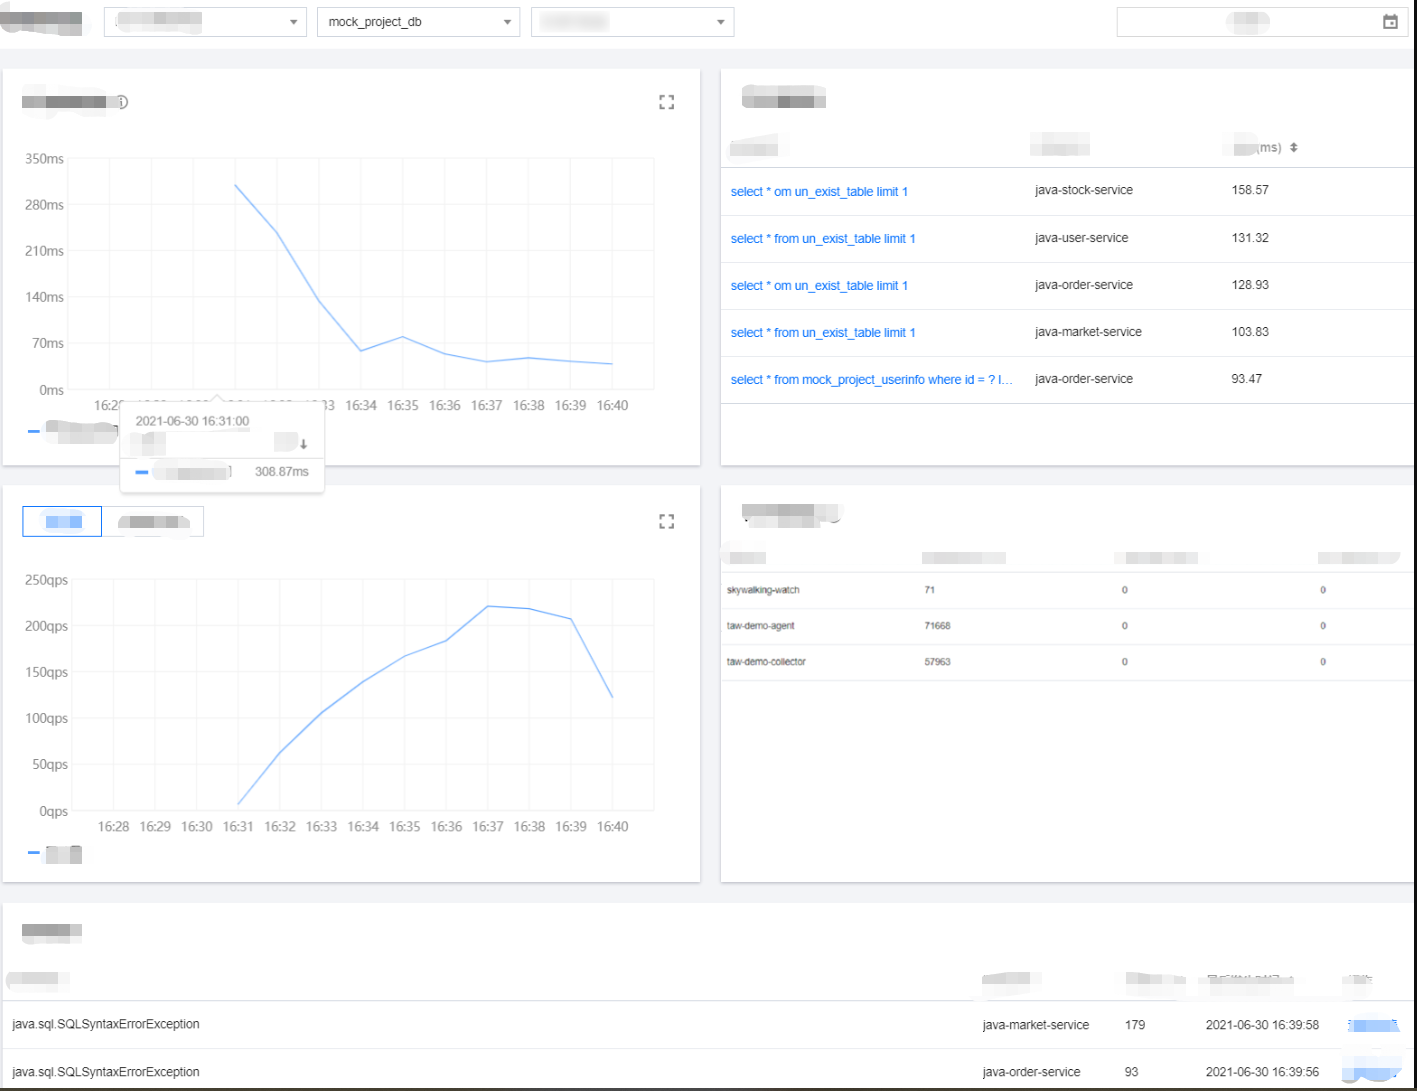
The database overview page displays the overall call conditions of the current database, including call topology, database response time, throughput, top 5 slow calls, top 5 callers, and exception list.

Prerequisites

Go to the Database query > Database overview page in the APM console.


Database call topology

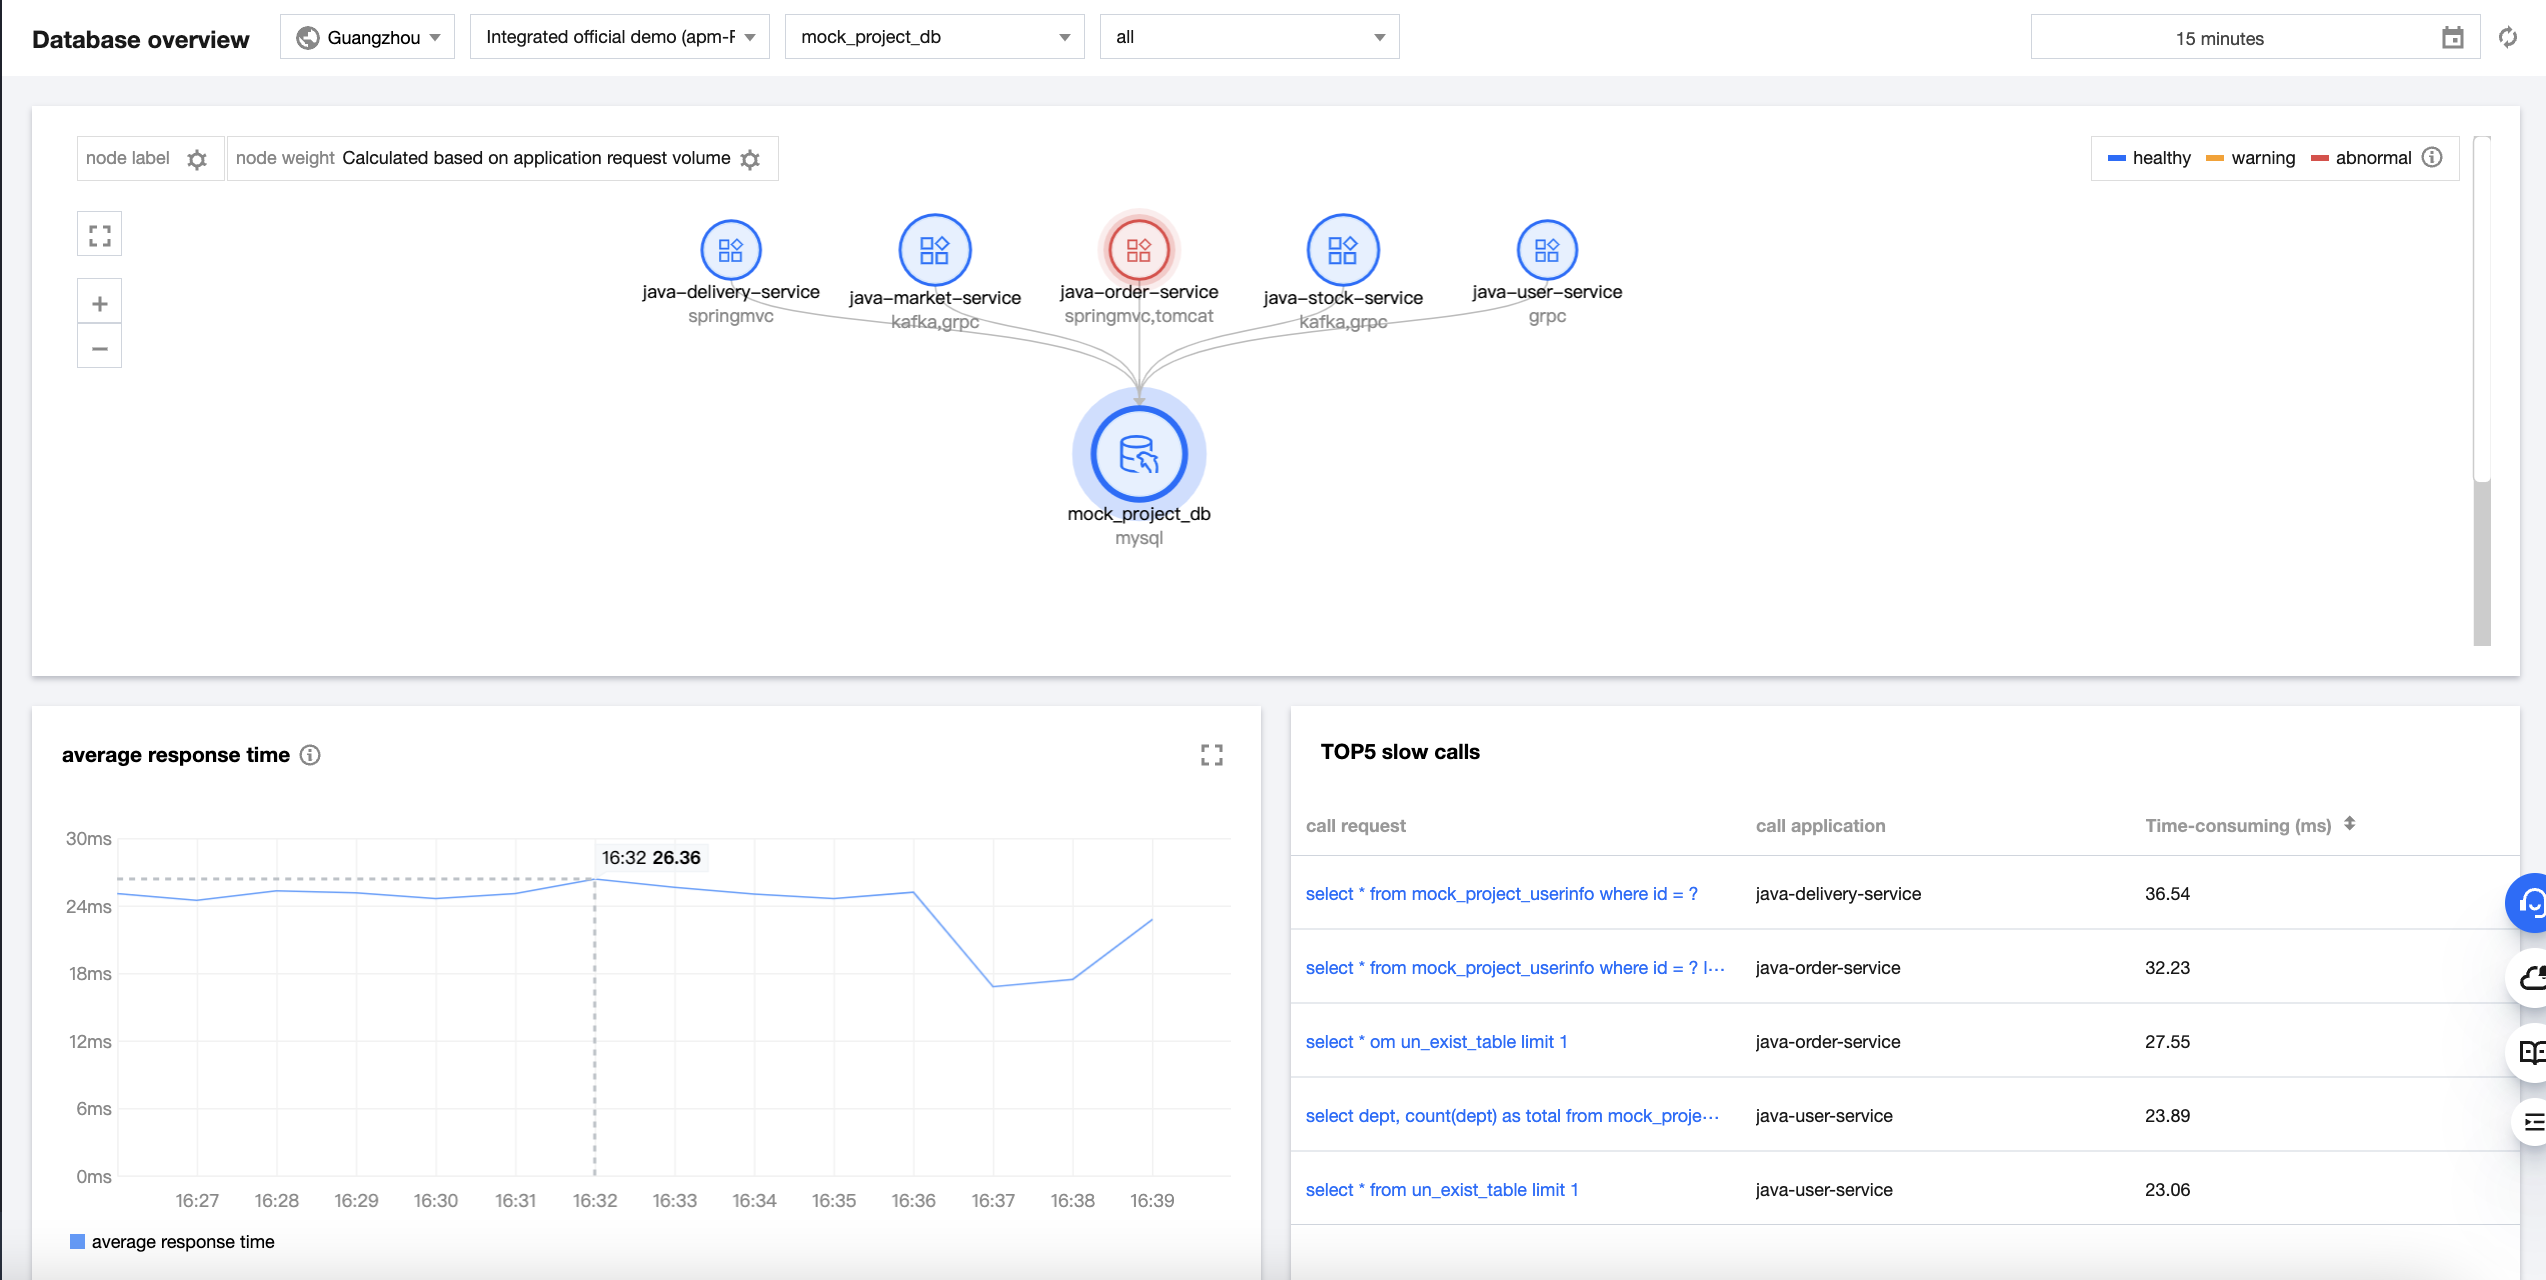
Database call relationships can be displayed in a topology, making it easier for you to view the details of calls between the application and database.


Health:
Healthy: Your application is assessed as healthy based on the response time and error rate. Warning: The current average response time of your application exceeds the satisfaction threshold, but the average error rate does not exceed the alarm threshold. Abnormal: The average error rate of your application exceeds the alarm threshold.
The satisfaction threshold for the average response time is 500 ms by default.
The alarm threshold for the average error rate is 5% by default.

Exception statistics

The list of database exceptions displays the exception type, caller, number of exceptions, first occurrence time, and last occurrence time. You can click View details to view specific database exceptions or click Trace to view trace details.

Metric description

Metric
Description
Throughput
The average throughput of the current database
Avg response time
The average response time of all calls of the selected database and instance at the 1-minute granularity
Top 5 callers
The top 5 upstream applications calling the selected database most frequently

Bantuan dan Dukungan

Apakah halaman ini membantu?

masukan