This document describes how to use the page performance feature. It allows you to use performance change trend chart, page loading waterfall plot, region view, and other dimensions to analyze key page performance metrics, such as firstScreenTime and request response.
3. On the page performance page, you can view the page performance metrics.
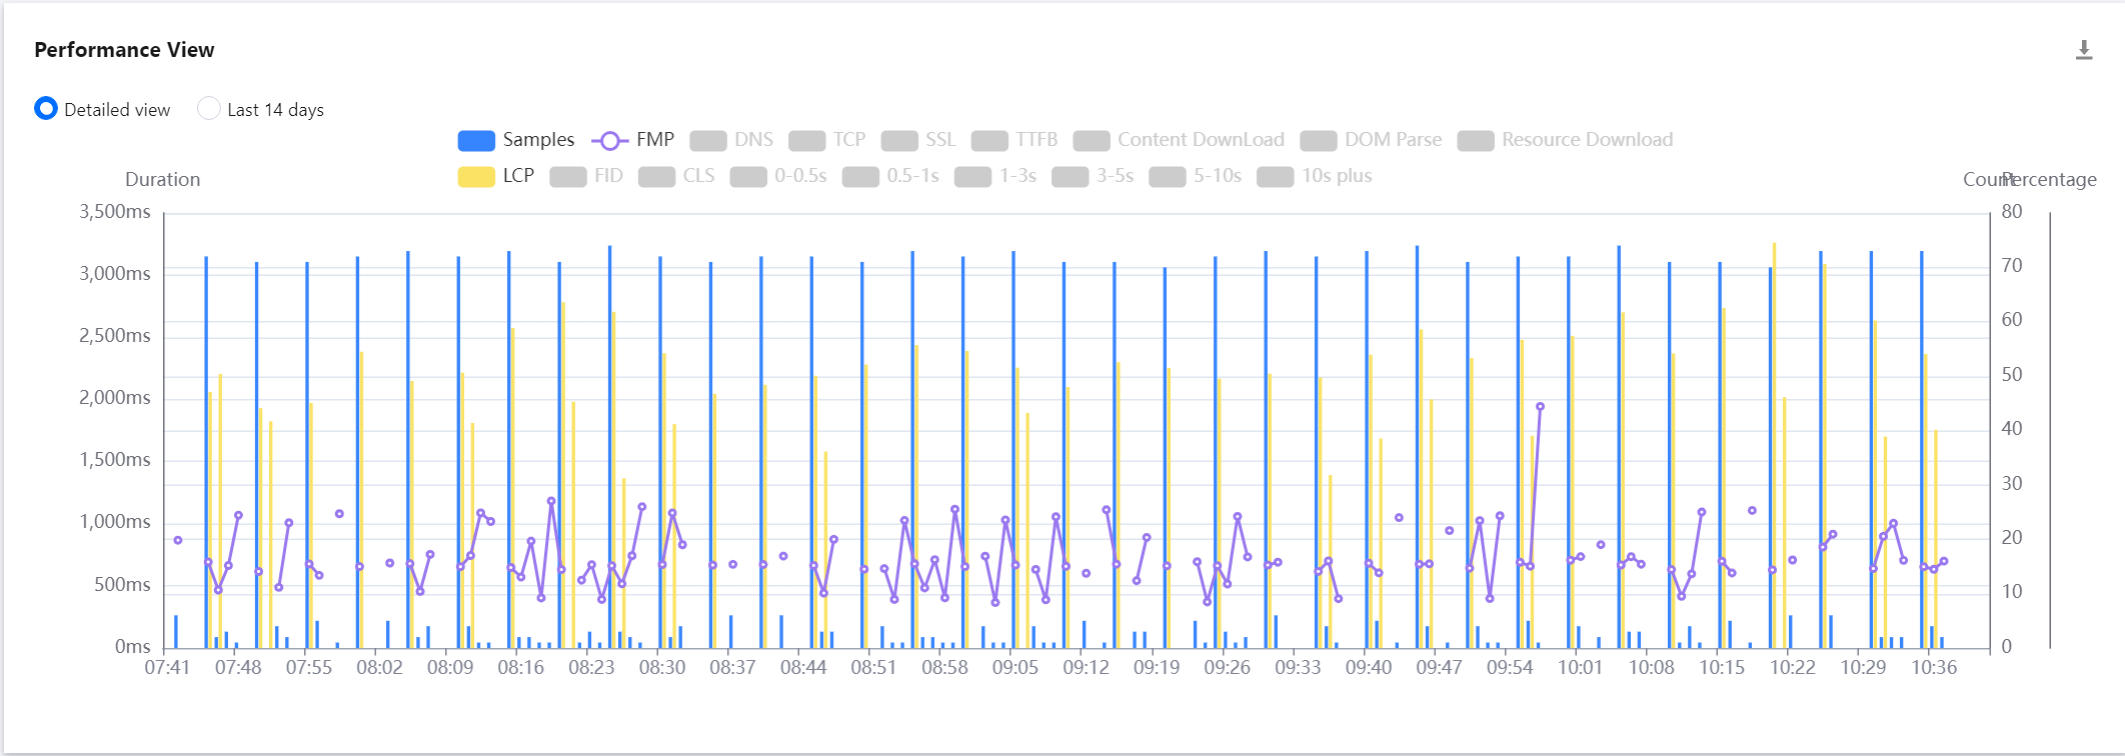
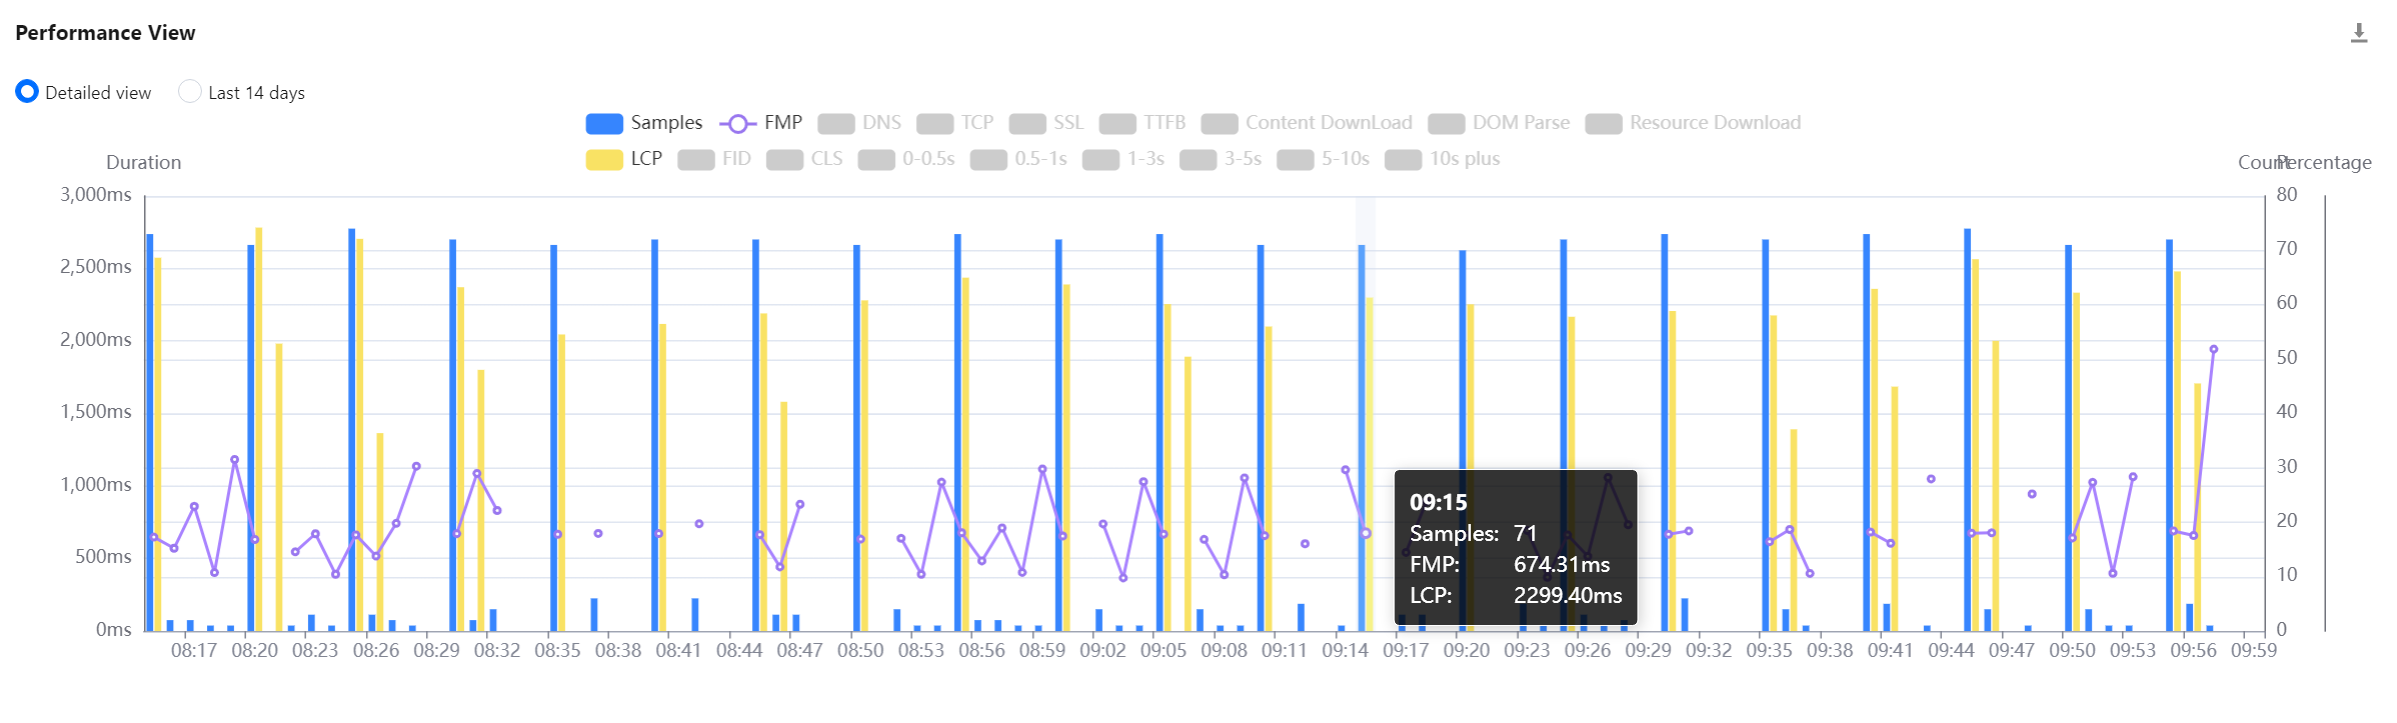
Performance view
It displays the change trends of key page performance metrics.
You can click a legend above the chart to hide or show the corresponding data.
You can display the trend for the specified time period or the past 14 days.
You can drag the curve to display the FMP at a specific time point.
You can mouse over the chart and scroll up and down to adjust its time span.
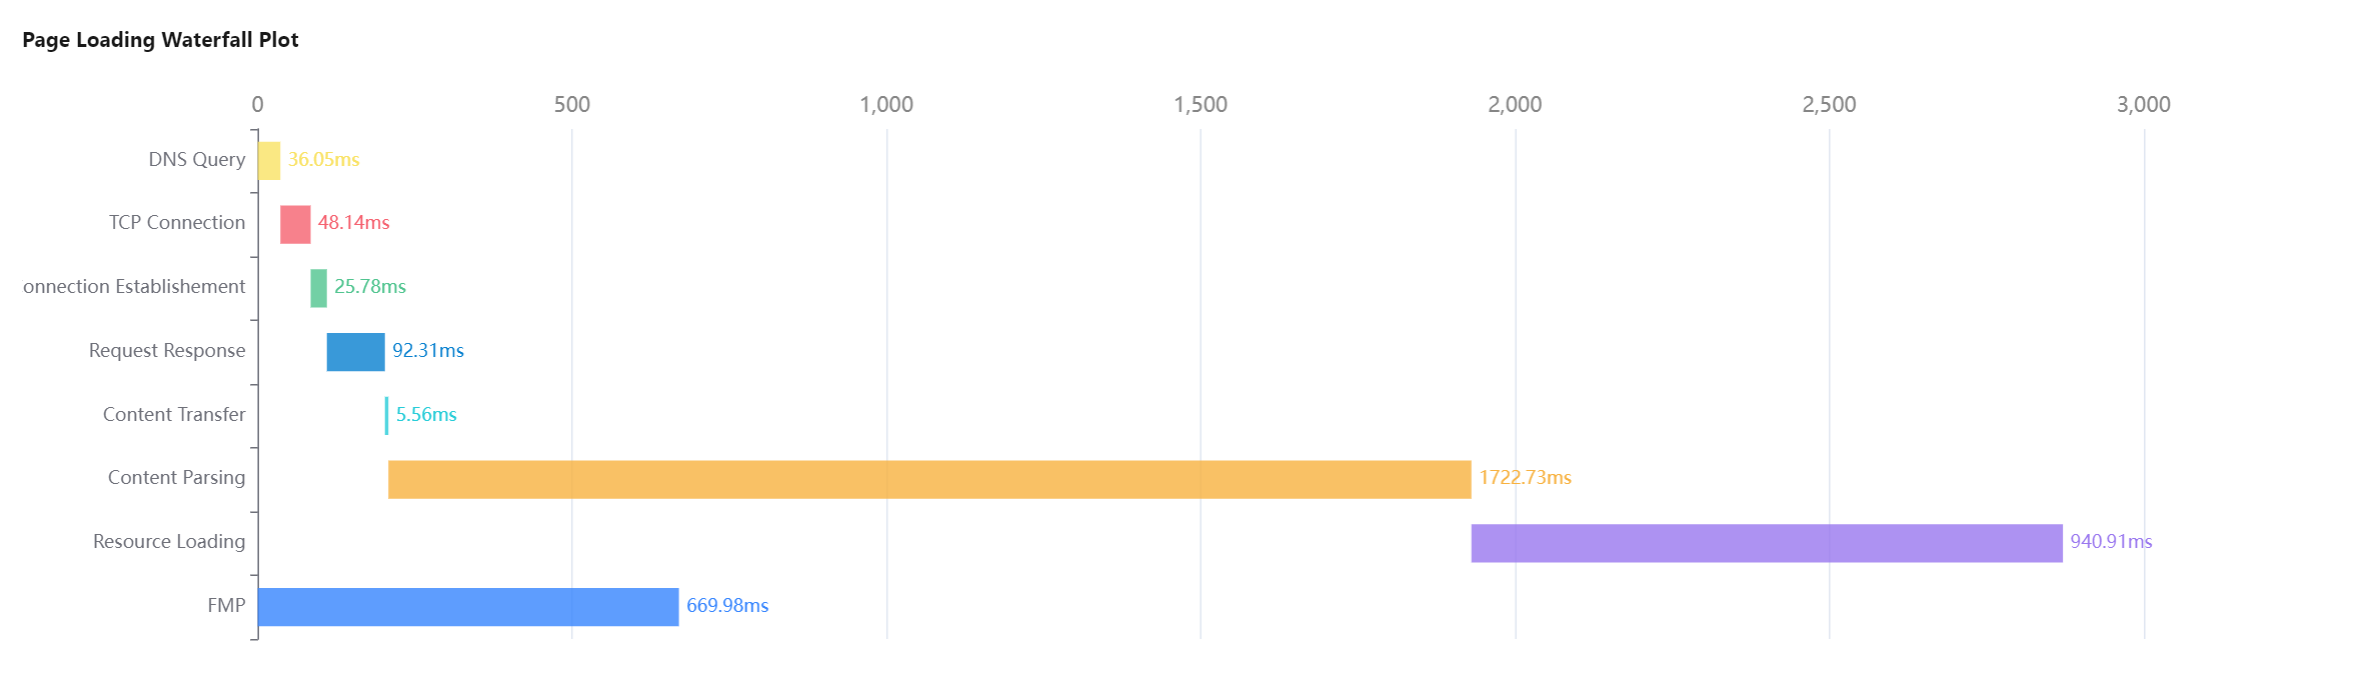
Page loading waterfall plot
You can use the page loading waterfall plot to view the duration of each phase and optimize the page performance accordingly.
The complete page loading duration is the sum of the TCP connection, DNS query, SSL connection, TTFB, DOM parsing, and resource loading durations.
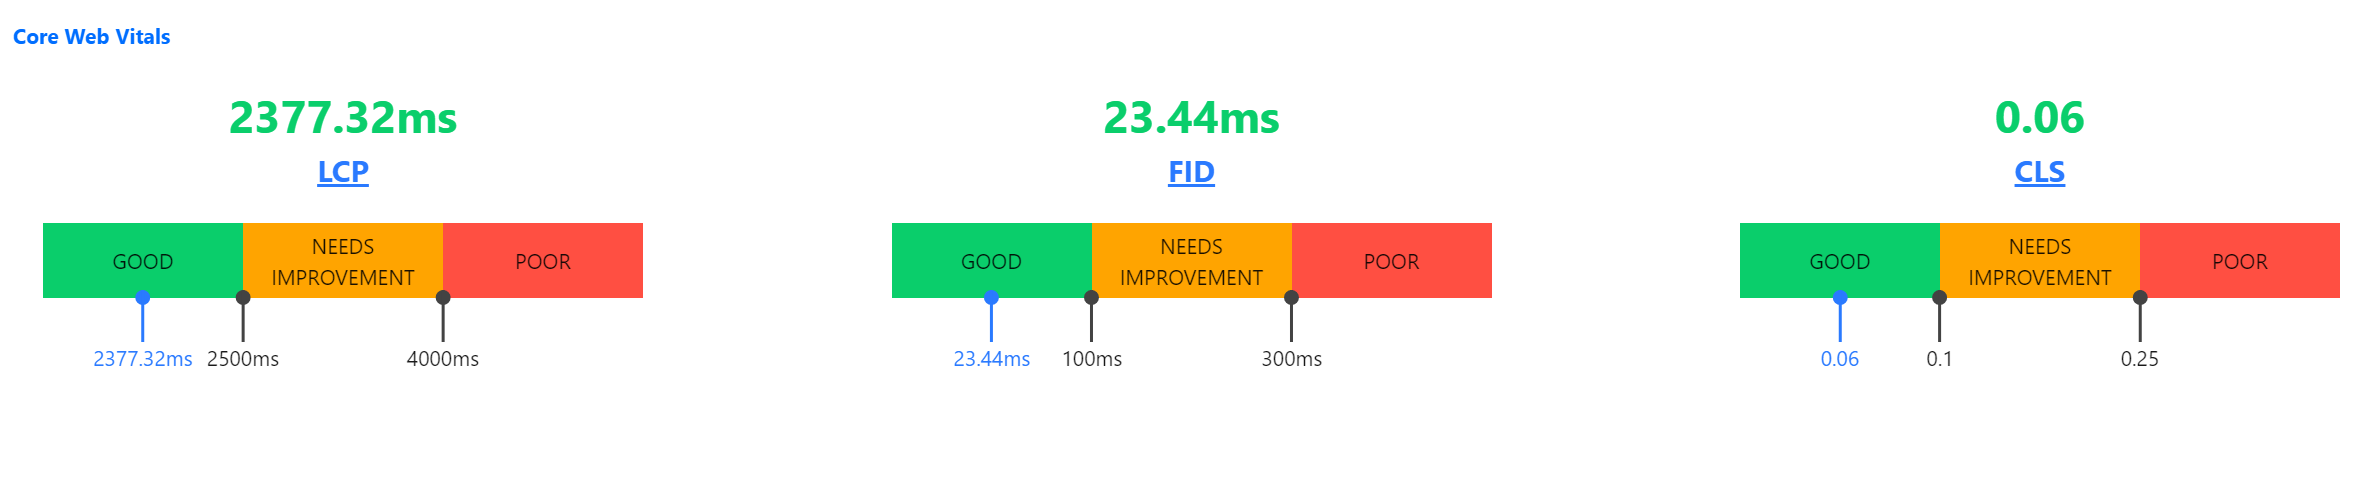
Core Web Vitals
Core Web Vitals reflect user experience from perspectives of loading speed, interactivity, and visual stability, and grade pages into three levels of "Good", "Needs Improvement", and "Poor", helping you comprehensively optimize the user experience.
Core Web Vitals include three core basic metrics: LCP, FID, and CLS.
Metric Acronym
Metric Name
Description
LCP
Largest Contentful Paint
It is the duration between when the user requests the website address and when the largest visible content element is rendered in the visible window. The element is usually an image, video, or a large block-level text element.
FID
First Input Delay
It is the duration between when the user interacts with (clicks a link or button on) the page for the first time and when the browser responds to the interaction. The object of this metric is any interactive element that is clicked by the user for the first time.
CLS
Cumulative Layout Shift
It is the total score of all accidental layout shifts throughout the entire lifecycle of the page, which is between 0 and any positive number. 0 indicates that there are no shifts, and the higher the value, the greater the website layout shift.
Metric level
Metric Level
Description
Good
The performance is good.
Needs Improvement
The performance needs to be optimized.
Poor
The performance is poor.
The following figure shows that your LCP is at the "Needs Improvement" level, and you can optimize the performance by improving the rendering of the largest visible content element such as image or video.
Other views
View Name
Description
Top underperformed pages view
It displays the top five pages with the poorest performance, including firstScreenTime, page loading duration, and day-over-day comparison, in order to help you understand the conditions of poorly performing pages and quickly find performance bottlenecks.
Network/Platform view
It uses a pie chart to display the number of exceptions, percentage, and firstScreenTime of pages from each network type/platform, such as 3G, 4G, and Wi-Fi networks as well as macOS, Windows, and iOS platforms.
ISP view
It uses a pie chart to display the number of exceptions, percentage, and firstScreenTime of pages from each ISP such as China Mobile, China Telecom, and China Unicom.
Region view
It uses a pie chart to display the number of exceptions, percentage, and firstScreenTime of pages from each region.
Brand/Model view
It uses a pie chart to display the number of exceptions, percentage, and firstScreenTime of pages from each mobile phone brand/model.
Browser view
It uses a pie chart to display the number of exceptions, percentage, and firstScreenTime of pages from each browser.
Version view
It uses a pie chart to display the number of exceptions, percentage, and firstScreenTime of pages from each application version. You can use new Aegis to pass in version during application connection to customize the version information related to development. The SDK version is used by default.
ext1/ext2/ext3 views
They are custom views. You can customize their parameters passed in during reporting. For details, see Connection Guide.
Metric description
Metric Name
Unit
Description
First Meaningful Paint (FMP)
ms
It is the duration between when the user requests to open a new page and when the browser renders the first meaningful paint.
Complete page loading duration
ms
It is the duration between when the user requests to open a new page and when the browser completely renders the corresponding page.