tencent cloud

Tencent Cloud Observability Platform

Release Notes and Announcements
Release Notes
Product Introduction
Overview
Strengths
Basic Features
Basic Concepts
Use Cases
Use Limits
Purchase Guide
Tencent Cloud Product Monitoring
Application Performance Management
Mobile App Performance Monitoring
Real User Monitoring
Cloud Automated Testing
Prometheus Monitoring
Grafana
EventBridge
PTS
Quick Start
Monitoring Overview
Instance Group
Tencent Cloud Product Monitoring
Application Performance Management
Real User Monitoring
Cloud Automated Testing
Performance Testing Service
Prometheus Getting Started
Grafana
Dashboard Creation
EventBridge
Alarm Service
Cloud Product Monitoring
Tencent Cloud Service Metrics
Operation Guide
CVM Agents
Cloud Product Monitoring Integration with Grafana
Troubleshooting
Practical Tutorial
Application Performance Management
Product Introduction
Access Guide
Operation Guide
Practical Tutorial
Parameter Information
FAQs
Mobile App Performance Monitoring
Overview
Operation Guide
Access Guide
Practical Tutorial
Tencent Cloud Real User Monitoring
Product Introduction
Operation Guide
Connection Guide
FAQs
Cloud Automated Testing
Product Introduction
Operation Guide
FAQs
Performance Testing Service
Overview
Operation Guide
Practice Tutorial
JavaScript API List
FAQs
Prometheus Monitoring
Product Introduction
Access Guide
Operation Guide
Practical Tutorial
Terraform
FAQs
Grafana
Product Introduction
Operation Guide
Guide on Grafana Common Features
FAQs
Dashboard
Overview
Operation Guide
Alarm Management
Console Operation Guide
Troubleshooting
FAQs
EventBridge
Product Introduction
Operation Guide
Practical Tutorial
FAQs
Report Management
FAQs
General
Alarm Service
Concepts
Monitoring Charts
CVM Agents
Dynamic Alarm Threshold
CM Connection to Grafana
Documentation Guide
Related Agreements
Application Performance Management Service Level Agreement
APM Privacy Policy
APM Data Processing And Security Agreement
RUM Service Level Agreement
Mobile Performance Monitoring Service Level Agreement
Cloud Automated Testing Service Level Agreement
Prometheus Service Level Agreement
TCMG Service Level Agreements
PTS Service Level Agreement
PTS Use Limits
Cloud Monitor Service Level Agreement
API Documentation
History
Introduction
API Category
Making API Requests
Monitoring Data Query APIs
Alarm APIs
Legacy Alert APIs
Notification Template APIs
TMP APIs
Grafana Service APIs
Event Center APIs
TencentCloud Managed Service for Prometheus APIs
Monitoring APIs
Data Types
Error Codes
Glossary

Use Limits for Free Mode

PDF
Mode fokus
Ukuran font
Terakhir diperbarui: 2025-10-24 14:46:34
To help users better experience product features while reducing costs, APM provides a free mode. You can enable free mode for specific business systems to enjoy permanent free usage of the APM product. Once free mode is enabled, charging for the selected business system will immediately stop, and the applications accessing this business system will incur no fees and will not consume any quotas from prepaid packages. Charging for the business system will only resume under your specified billing mode once you proactively disable the free mode.

Use Limits

In free mode, APM provides limited features. To access the full features of APM, you need to disable free mode. Be aware of the following use limits:
Linkage data is not saved. Both the Distributed Tracing and Trace details features will be affected.
Metric data is retained for a fixed period of 3 days. APM uses separate data sources to store metric data for free and paid modes. When a business system switches between free mode and paid mode, historical metric data will no longer be queried.
For Spans with the call role Internal, no metric data is generated. You can see Link Tracing Field Description for more details about Span call roles. In most scenarios, users only need to focus on the metrics generated under the Server, Client, Consumer, and Producer roles. Therefore, this limit has minimal impact on the normal use of APM.
Alarming features are not supported.

Features Supported in Free Mode

In addition to the use limits mentioned above, all other APM features can be used normally in free mode. These include application performance overview, application topology, JVM monitoring, API monitoring, database call analysis, MQ call analysis, error analysis, and advanced diagnostic capabilities such as application performance profiling.

How to Enable Free Mode?

1. Log in to the TCOP console.
2. Go to APM > Resource management > System Management, find the business system to enable free mode, and click Modify configuration.
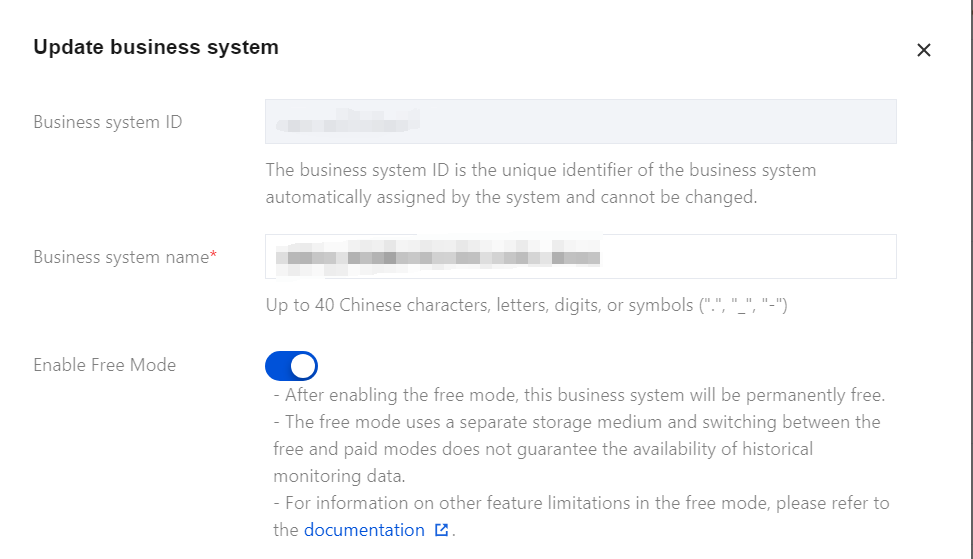
3. In the Update business system dialog box, turn on the Enable Free Mode switch, and click OK.


Once the operation is completed, the business system will enter Free Mode, and all charging associated with the system will stop immediately. In free mode, application access operates in the same manner as in the normal mode. Switching between free mode and paid mode takes effect instantly without requiring re-access of the application. Free mode is configured at the business system level, allowing both free mode and paid mode business systems to coexist under the same account.


Bantuan dan Dukungan

Apakah halaman ini membantu?

masukan