Release Notes
Archive Storage
Archive storage is a data storage solution designed for long-term retention of infrequently accessed data. Archive storage is typically used to store information that should be retained but does not require frequent access. To meet users' long-term data retention and business requirements and maximize cost reduction for users, TencentCloud Managed Service for Prometheus (TMP) provides an archive storage feature. The following is a detailed introduction on how to use this feature.
Use Limits
Specifications limit: Archive storage can be configured only for instances with a data storage duration of 30 days or longer.
Retention period limit: The time range for archive storage with support for custom input. The configurable minimum value is 60 days, and the maximum value is 2 years.
Query frequency limit: If the queried data range includes archive storage data, the system will limit the query request frequency to a maximum of 3 times per second. When there is no query, the system will "cool down" and accumulate available quotas, with a maximum of 15 query quotas (approximately equivalent to 5 seconds of idle time). Therefore, you can initiate up to 15 queries at a time in a short time frame. (For example: If there are no query requests in the first 5 seconds, you can initiate up to 15 queries at a time in the 6th second. Then, the frequency will be restored to a maximum of 3 times per second.)
Directions
Method 1: Configuration via the Instance Purchase Page
1. Log in to the TCOP console.
2. Select Managed Service for Prometheus in the left menu bar.
3. On the Managed Service for Prometheus page, click Create. If Data Retention Period is selected as 30 days or longer, the Archive Storage option will appear below this configuration item.
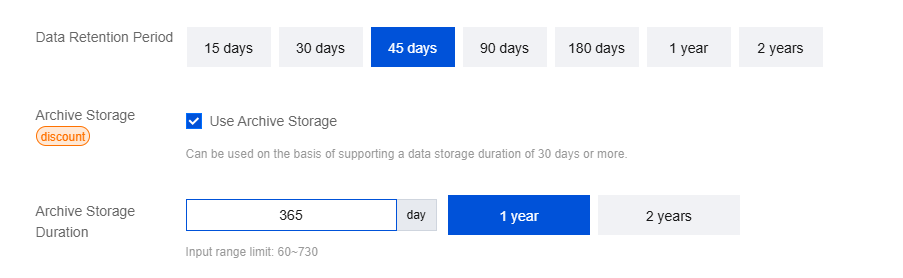
4. Archive storage supports customizing storage duration, with a range limited to 60 - 730 days. For configuration of other items, follow the on-page prompts. After the configuration, select the Terms of Service and click Buy Now and complete the payment.
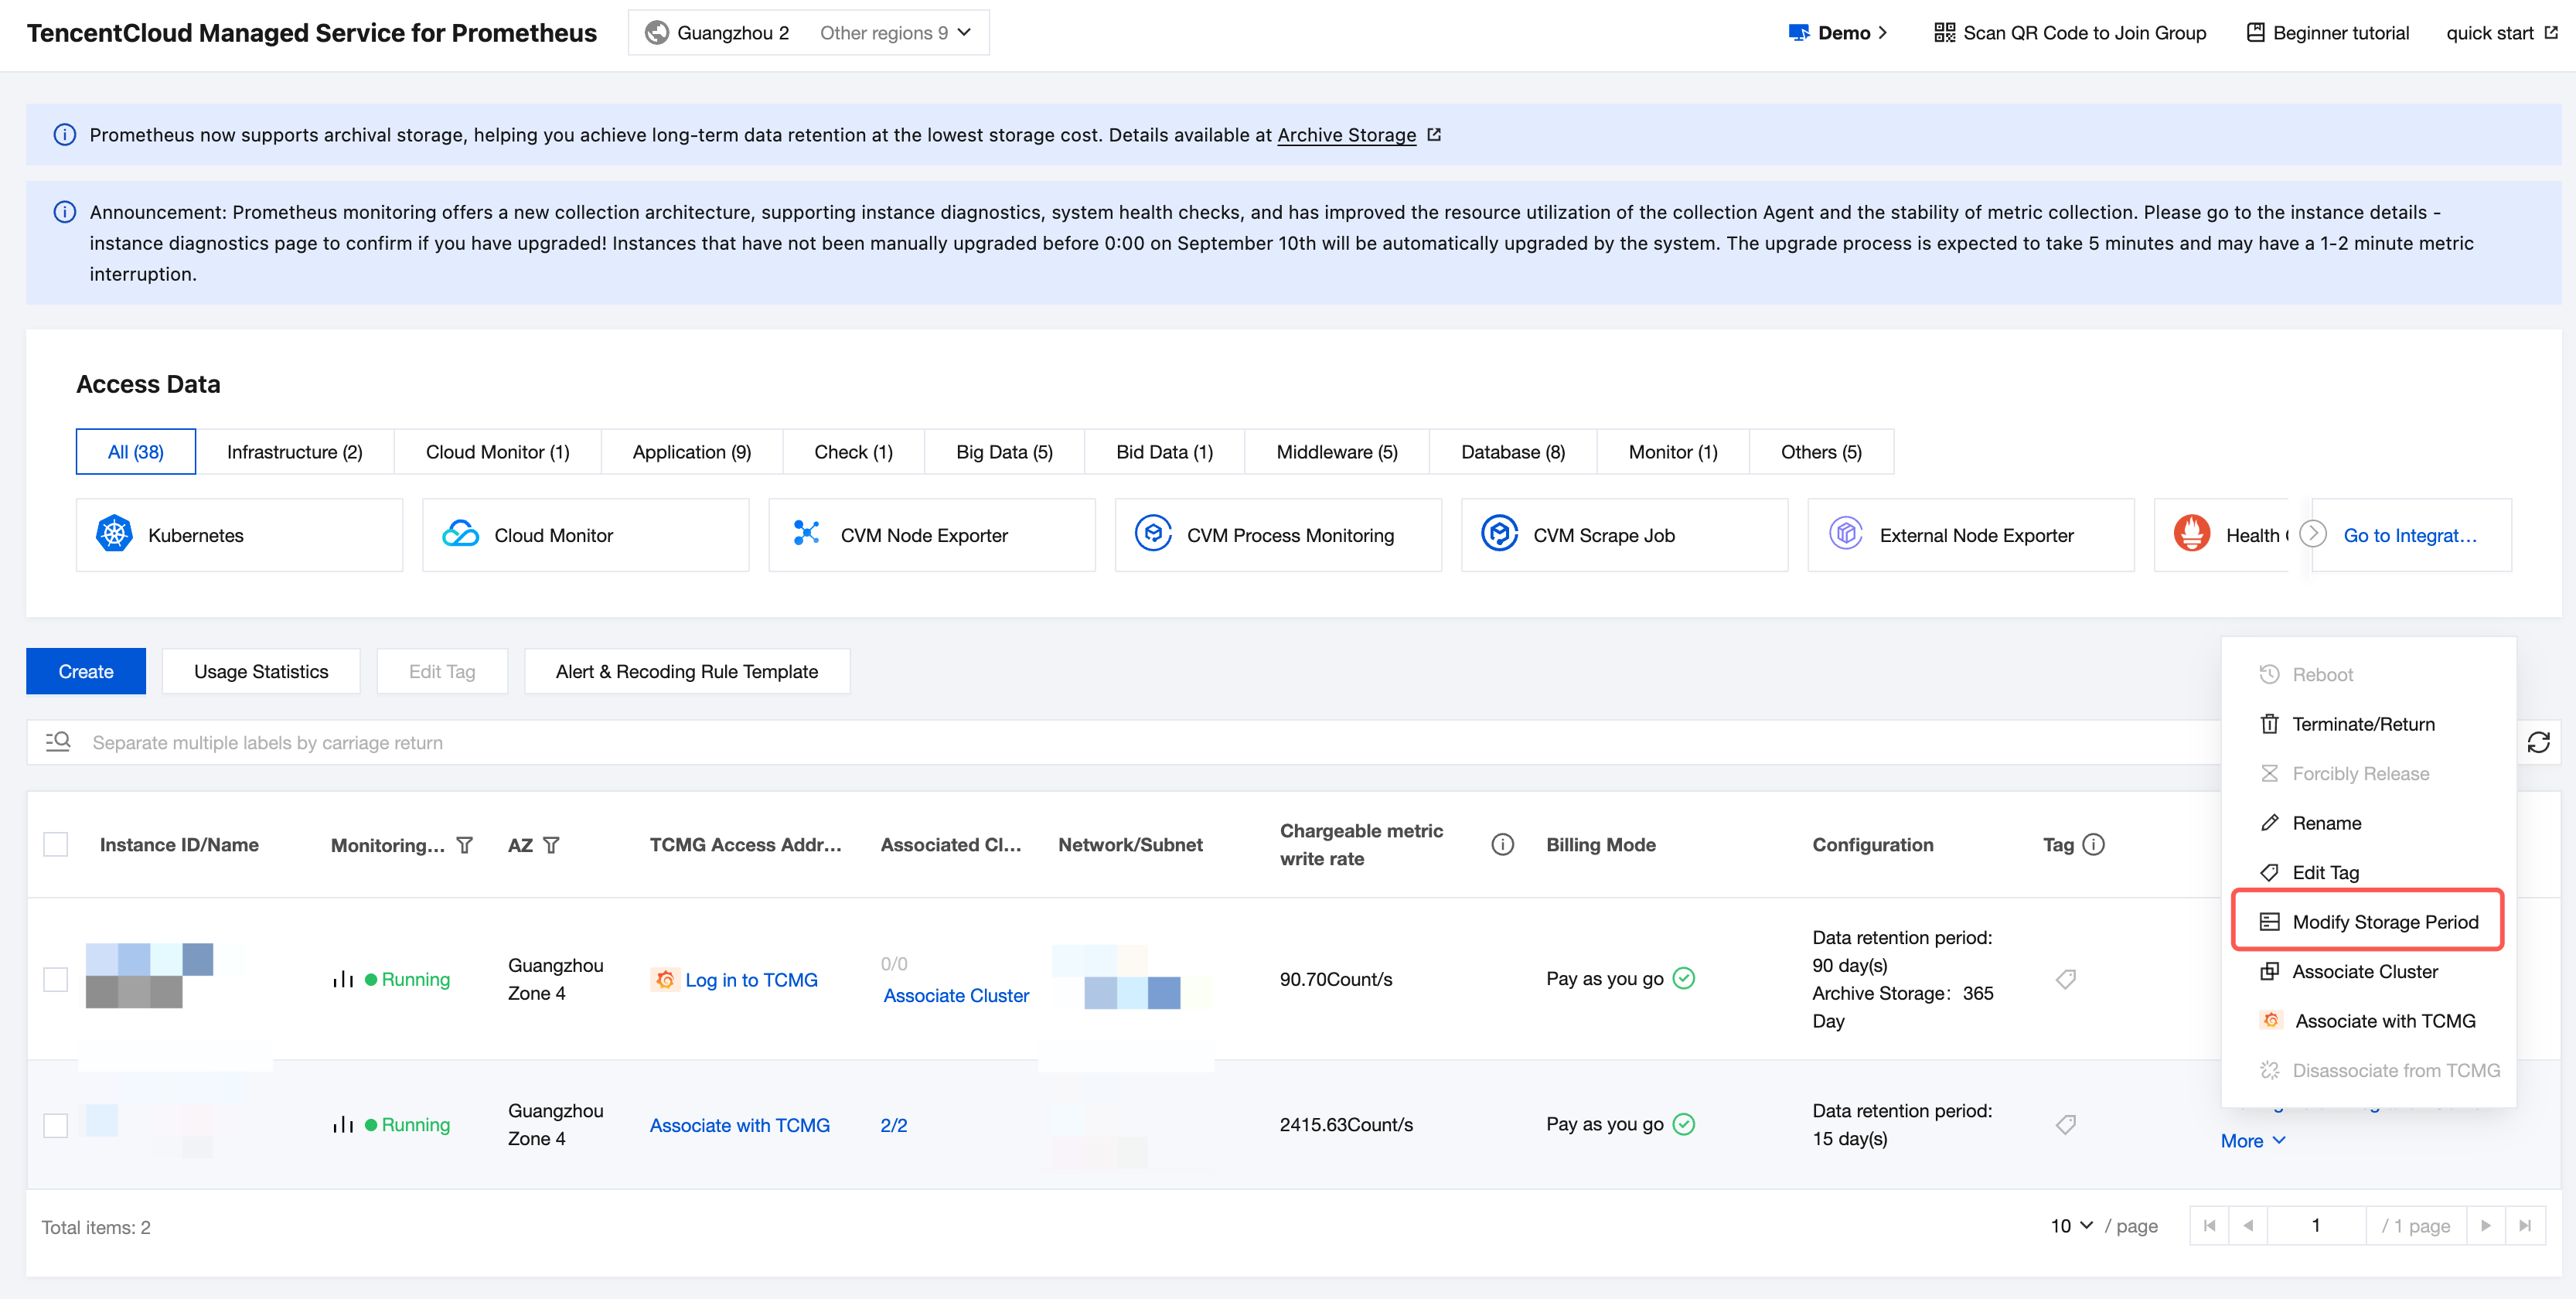
Method 2: Configuration via the Instance List Page
1. Log in to the TCOP console.
2. Select Managed Service for Prometheus in the left menu bar.
3. In the instance list, select the instance for which you need to modify the storage duration, and click More > Modify Storage Period on the right.
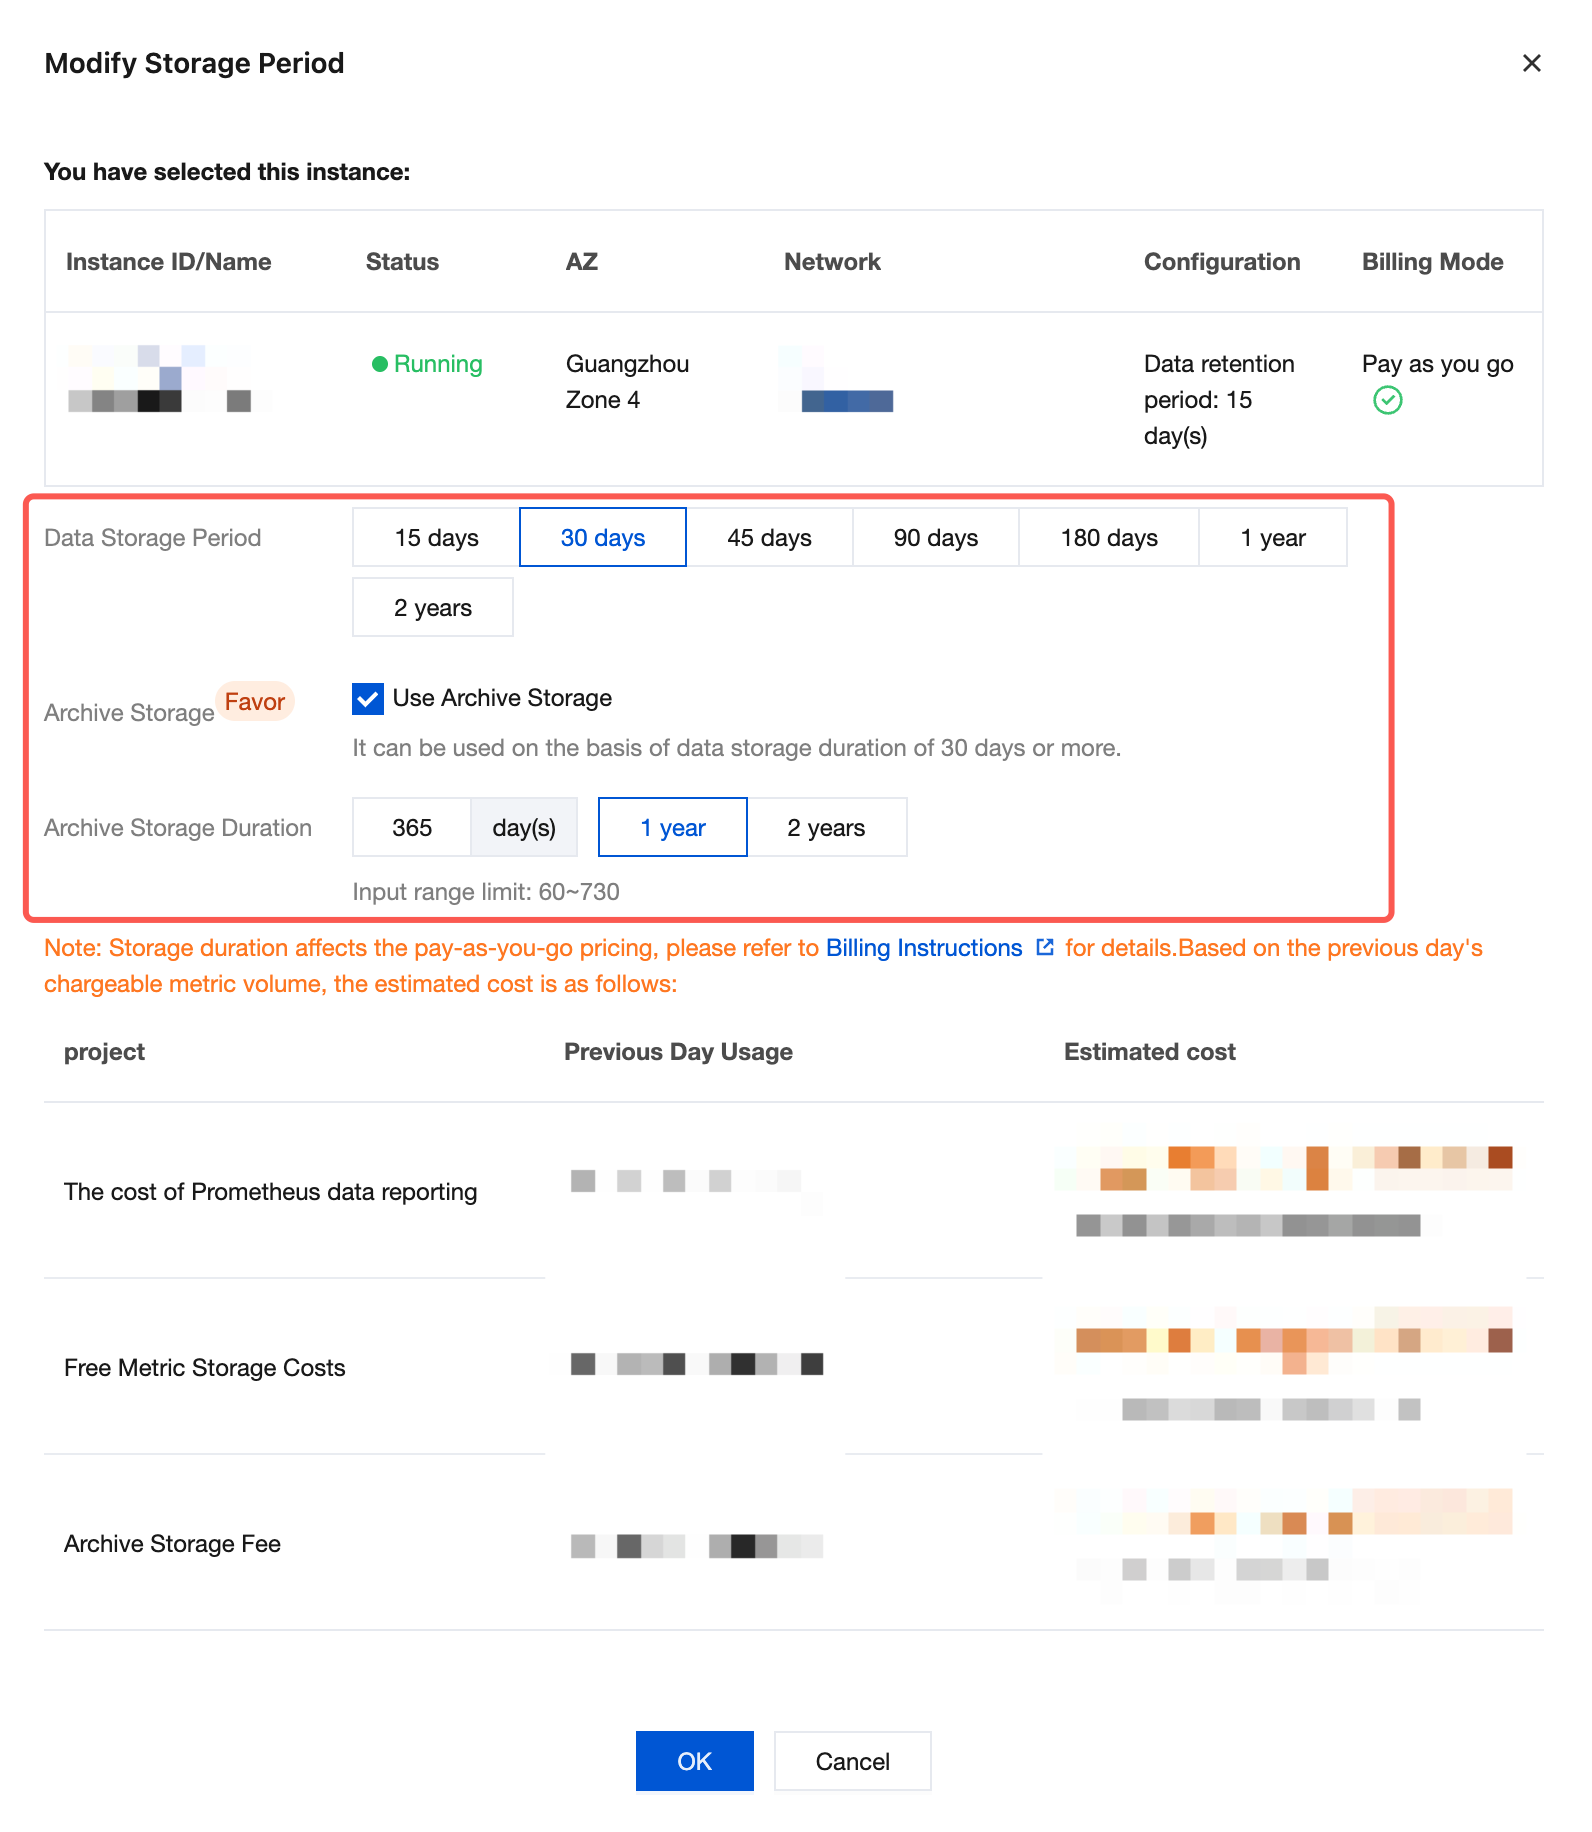
4. When the data storage duration is changed to 30 days or longer, you can select Archive Storage below and enter the custom archive storage duration. After modification, click OK to complete the process, as shown below.
Displaying Configuration Result
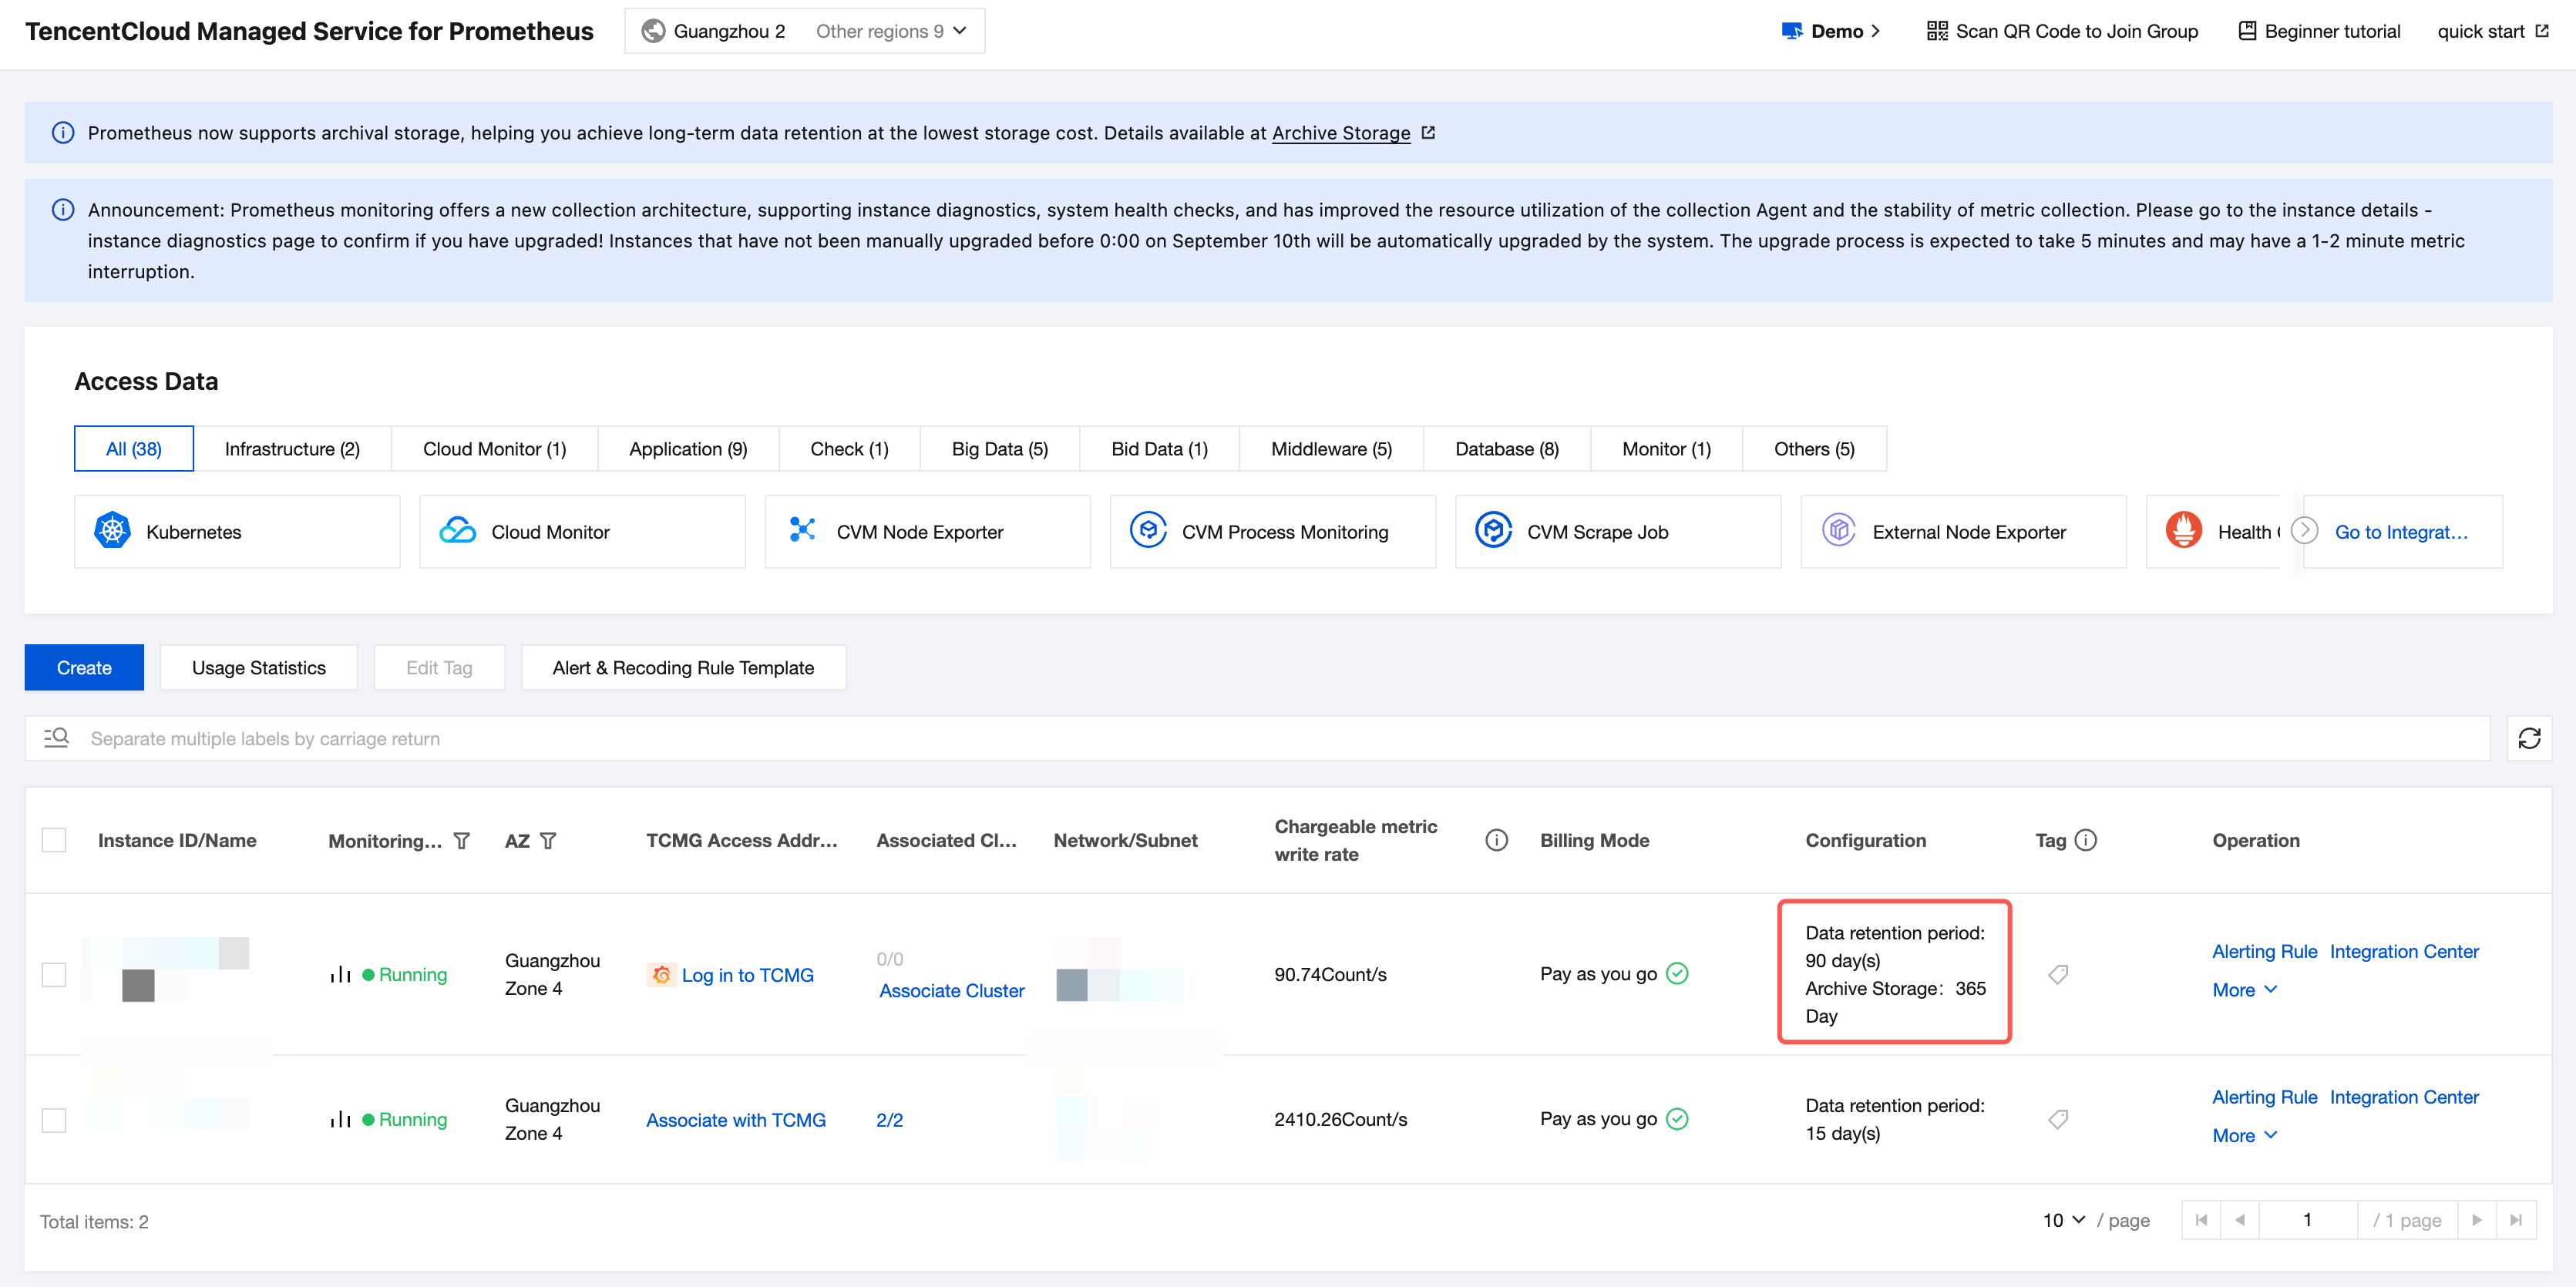
When you successfully set the configurations using either of the above methods, you can return to the instance list page and find that the archive storage duration displays in the Configurations column, as shown in the figure below:
Additional Description
The comparison between normal storage and additional archive storage is as follows:
Storage Method | Price | Query Frequency Limit | Reference Documentation |
Data storage | High | No | |
Data storage + Archive storage | Low | Yes |
Bantuan dan Dukungan
Apakah halaman ini membantu?
Anda juga dapat Menghubungi Penjualan atau Mengirimkan Tiket untuk meminta bantuan.
masukan