Release Notes
Nginx Ingress Controller Exporter Integration
Scenarios
To check whether the Nginx Ingress Controller is running normally and to troubleshoot issues, you need to monitor the running status of the Nginx Ingress Controller when using the Nginx Ingress Controller. Tencent Cloud Observability Platform (TCOP) provides an out-of-the-box Grafana monitoring dashboard for the Nginx Ingress Controller through TencentCloud Managed Service for Prometheus (TMP). This document describes how to use Prometheus to monitor the Nginx Ingress Controller.
Integration Methods
Prerequisites
A Kubernetes cluster of Tencent Cloud Tencent Kubernetes Engine (TKE) has been created in the region and Virtual Private Cloud (VPC) of the corresponding Prometheus instance, and a namespace has been created for the cluster.
The self-built Nginx Ingress has been successfully deployed in the Kubernetes cluster.
In the TMP console, select the corresponding Prometheus instance, then choose Data Collection > Integrate with TKE to find the corresponding Kubernetes cluster and complete the cluster association. See the guide on associating with a cluster.
Directions
Step 1: Confirming Nginx Ingress Exposure Metrics
1. Use the community Helm repository for installation. In this case, you need to confirm that the metrics configuration item is set up in values.yaml to enable metrics. The specific configurations are as follows:
controller:metrics:port: 10254portName: metrics
2. Create an Nginx Ingress workload on your own.
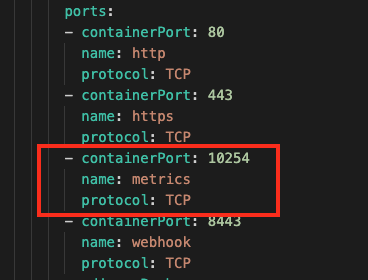
2.1 In this case, you need to add the following configuration items to the port settings spec.template.spec.containers[0].ports in the workload ingress-nginx-controller:
- containerPort: 10254name: metricsprotocol: TCP
The effect after configurations is as shown below:
2.2 If you use the ingress-nginx-controller image version v1.12.0 or higher, you also need to add the metrics configuration item in the startup parameters to enable metrics, and add the configuration item
--enable-metrics=true in the parameter settings spec.template.spec.containers[0].args of the workload ingress-nginx-controller. The effect after configurations is as shown below: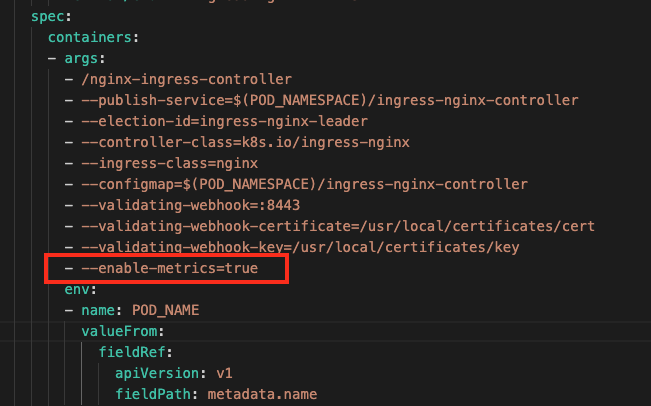
2.3 Restart the workload ingress-nginx-controller to apply the latest configurations.
Step 2: Adding a Collection Task
1. Log in to the TMP console and select the corresponding Prometheus instance to go to the management page.
2. In Data Collection > Integrate with TKE, select the associated cluster, then choose Data Collection Configuration > Customize Monitoring Configuration to add collection tasks.
Add
PodMonitors via service discovery to define a Prometheus collection task, choose Via YAML > PodMonitors, enter the YAML configurations, then click OK, as shown below: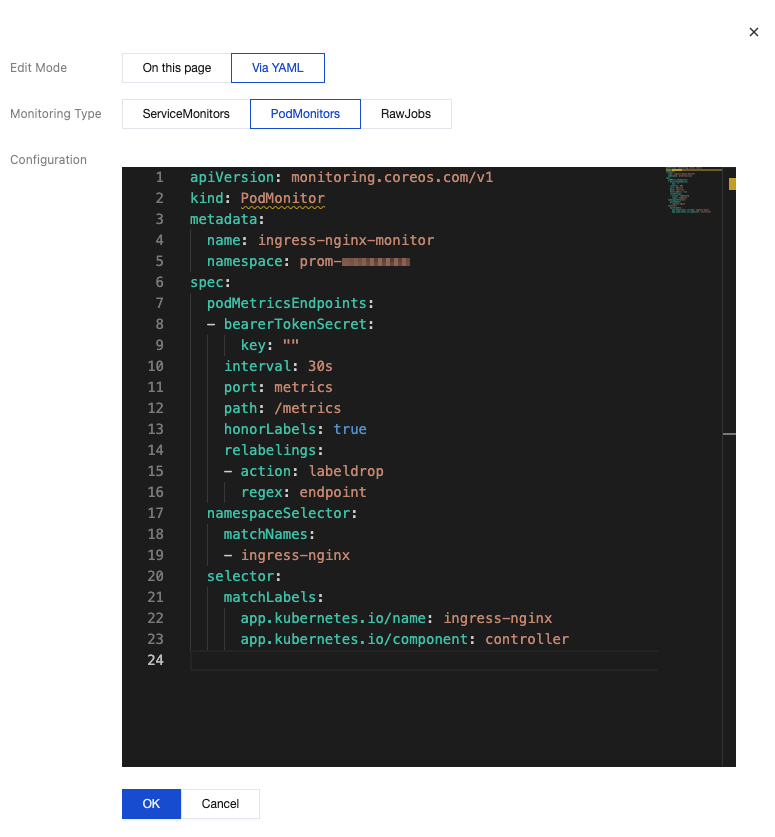
The YAML configuration example is as follows.
apiVersion: monitoring.coreos.com/v1kind: PodMonitormetadata:name: ingress-nginx-monitor # Enter a unique name.namespace: prom-xxxxxxxx # Enter the namespace corresponding to the Prometheus instance ID or where ingress-nginx-controller resides.spec:podMetricsEndpoints:- interval: 30sport: metrics # Enter the portName corresponding to metrics in values.yaml in Step 1.path: /metricshonorLabels: truerelabelings:- action: labeldropregex: endpointnamespaceSelector: # Select the namespace where the ingress-nginx-controller pod to be monitored resides.matchNames:- ingress-nginxselector: # Enter the Label value of the pod to be monitored to locate the target pod.matchLabels:app.kubernetes.io/name: ingress-nginxapp.kubernetes.io/component: controller
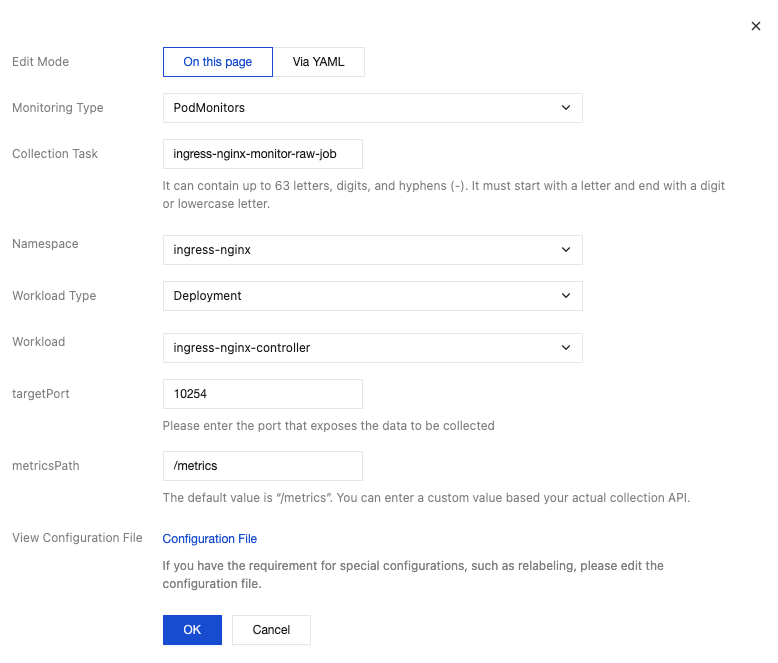
Add Prometheus native job configurations through the page editing capability of the console. Select On this page, and enter each configuration item as prompted. After configurations, click OK. The specific example is shown below:
Monitoring Type: Select PodMonitors.
Collection Task: Enter a unique name.
Namespace: Select the namespace where ingress-nginx-controller resides.
Workload Type: Select the load type of ingress-nginx-controller.
Workload: Select the load name of ingress-nginx-controller.
targetPort: Enter the port number set in Step 1.
metricsPath: Remain as /metrics.
Step 3: Verifying Configurations
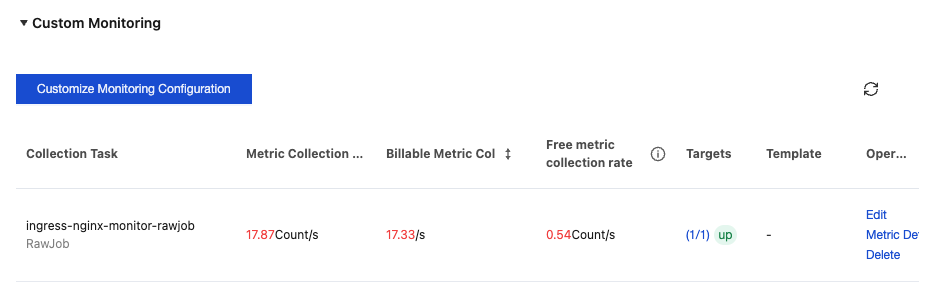
1. In the current Prometheus instance, choose Data Collection > Integrate with TKE to select the corresponding cluster, then choose Data Collection Configuration > Custom Monitoring to view collection tasks.
2. Locate the collection tasks added in Step 2 (choose either of the two), then check whether the Metric Collection Rate exceeds 0 and whether the Targets values match the number of ingress-nginx-controller pods and are all in the up status, as shown below:
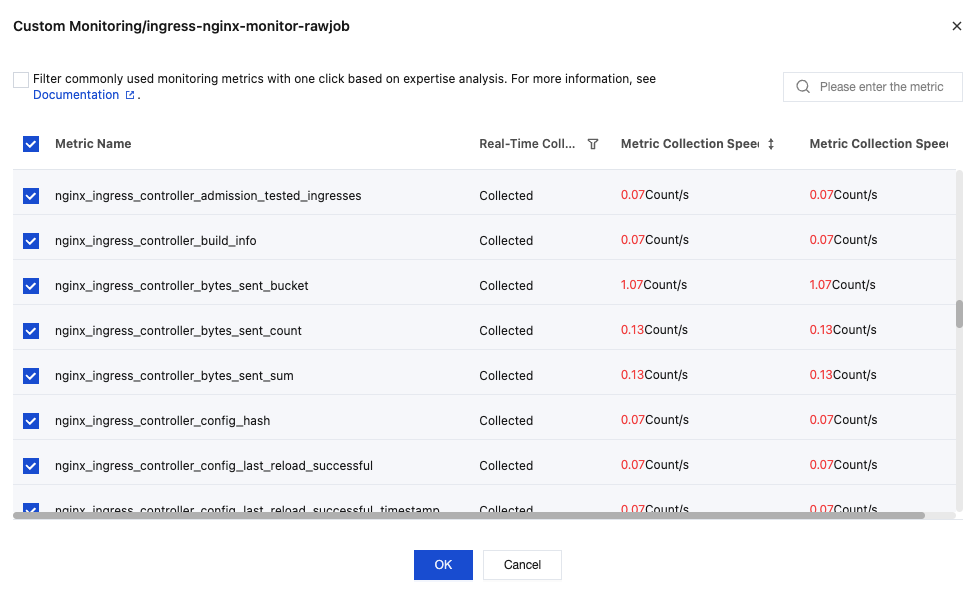
3. Click Metric Details corresponding to the collection tasks to view the metric collection details. Check if the metric list includes metrics with nginx_ingress as a prefix, as shown below:
Viewing Monitoring Information
Prerequisites
The Prometheus instance has been bound to a Grafana instance.
Directions
1. Log in to the TMP console and select the corresponding Prometheus instance to go to the management page.
2. In Data Collection > Integration Center, locate and click Nginx Ingress Controller for monitoring. Choose Dashboard > Dashboard operation > Install/Upgrade Dashboard, then click Install/Upgrade to enable the Nginx Ingress Controller monitoring dashboard.
3. On the Basic Info page of the instance, find the bound Grafana address, and open and log in to Grafana. Then, find the nginx-ingress related panel in the middleware folder to observe the above-mentioned ingress-nginx-controller dashboards, as shown below:

Nginx Ingress Controller:
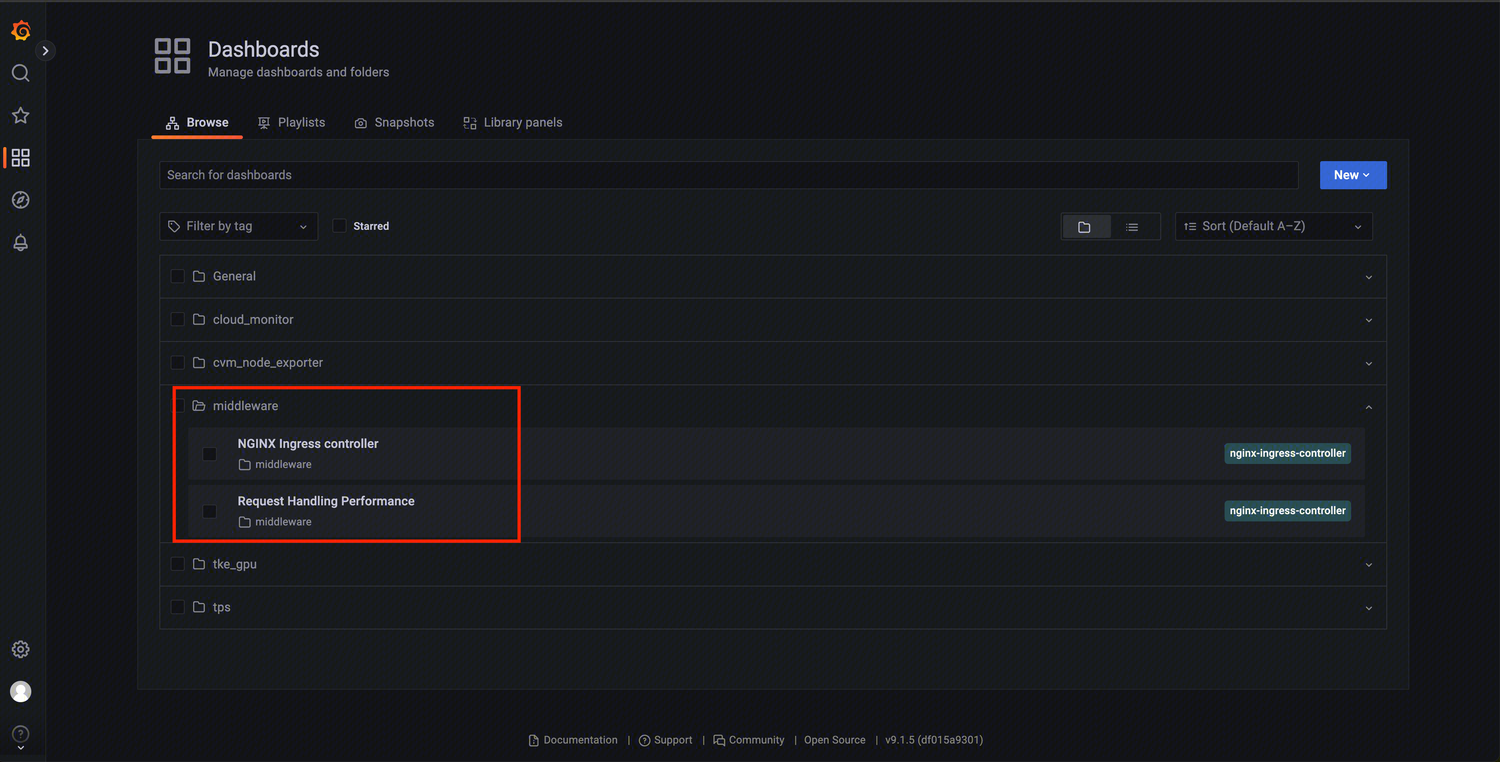
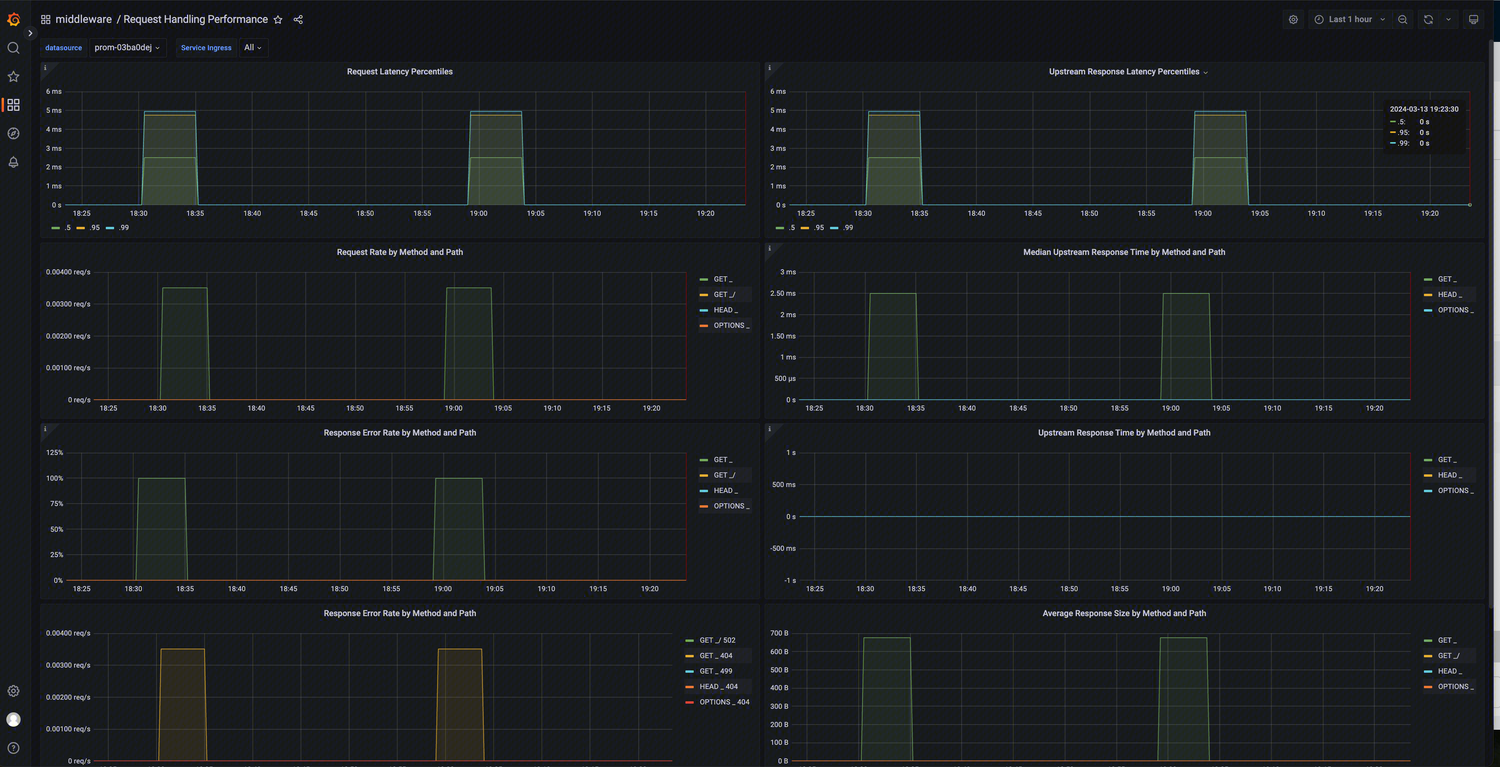
Request Handling Performance:
Bantuan dan Dukungan
Apakah halaman ini membantu?
Anda juga dapat Menghubungi Penjualan atau Mengirimkan Tiket untuk meminta bantuan.
masukan