Compression Monitoring
Unduh
Mode fokus
Ukuran font
QosAgent provides a series of metrics on port 8084 for monitoring node and pod memory compression, as well as memory and CPU pressure. Users can configure Prometheus and Grafana for monitoring. In addition, we also offer a Grafana monitoring dashboard template for businesses to quickly check the efficiency of memory compression. (Please submit a ticket to obtain the template.)
Key Metrics Introduction
Object | Metric Name | Meaning |
Pod | pod_pressure_total | Pod-level PSI, which displays the waiting duration for each pod due to the lack of resources such as CPU, memory, and IO. |
| pod_memory_info | Memory status of a pod, including statistics on the following memory metrics for pods and containers: RSS, anonymous memory, file pages, active memory, and inactive memory. |
| pod_memory_page_fault_info | Page fault situation of a pod (including file page faults, anonymous page faults, major page faults, and minor page faults). |
| pod_memory_oom_kill | Out of Memory (OOM) statistics of a pod. |
Node | node_pressure_total | Node CPU, IO, and memory PSI metrics (indicating whether certain resources are constrained). |
| node_memory_page_fault_distance | Refault frequency, indicating the situation where "hot" pages are swapped out. |
| node_memory_page_fault_major | Number of page faults caused by disk reads. |
| node_disk_io_time_seconds_total | Node disk IO total time (via zram0 device metrics, you can observe the situations of swapping out and swapping in to zram0). |
| node_disk_read_bytes_total | Disk and zram0 device IO read bandwidth. |
| node_disk_reads_completed_total | Disk and zram0 device IO read count (indirectly indicating the situation of anonymous memory page faults caused by memory compression). |
| node_disk_writes_completed(time_seconds)_total | Disk/zram0 device write operations and total time consumption. |
| node_memory_oom_kill | Disk and zram0 device write status. |
Which services can be compressed
Supports collecting the ratio of "cold" pages in services as an estimated compressible value. "Cold" pages include cold anonymous pages and cold file pages. Based on the estimated compression value and business attributes, it can be determined which services can be compressed, as well as the estimated amount of compression.
Workingset Saved: kubelet-perspective observation of "Inactive anon" savings value.
Memory Saved: monitoring-perspective observation of "Inactive anon + Inactive File" savings value.
Save memory amount
Memory size saved per pod = Size before zram compression - Size after zram compression
Is memory reclamation accurate?
Observe "node_memory_page_fault_major" and PSI metrics. Low values for node_memory_page_fault_major and Memory PSI metrics indicate accurate reclamation.
Is the business stable?
Monitor the changes of the number of OOM occurrences, PSI, and Zram0 device IO for a pod/node (e.g., "node_disk_read_bytes_total", "node_disk_reads_completed_total", and "node_disk_writes_completed(time_seconds)_total"). The increases of the number of OOM occurrences, PSI, and Zram0 device IO all indicate instability.
Integrate with Tencent Cloud Prometheus Monitoring
1. log in to the Prometheus monitoring service console.
2. In the Prometheus instance list, click the newly created Instance ID/Name.
3. Enter the Prometheus Management Center and click Data Acquisition in the top navigation bar.
4. On the Integrated Container Service page, click Associate Cluster to associate the cluster with the Prometheus instance. For details, see Associated Cluster.
5. In the cluster list, click Data Collection Configuration on the right side of the cluster, select Create Custom Monitoring, and fill in the configuration information:
Monitoring type: Workload monitoring
Namespace: kube-system
Workload type: DaemonSet
Workload: qos-agent
targetPort: 8084
metricsPath: /metrics
6. Click OK.
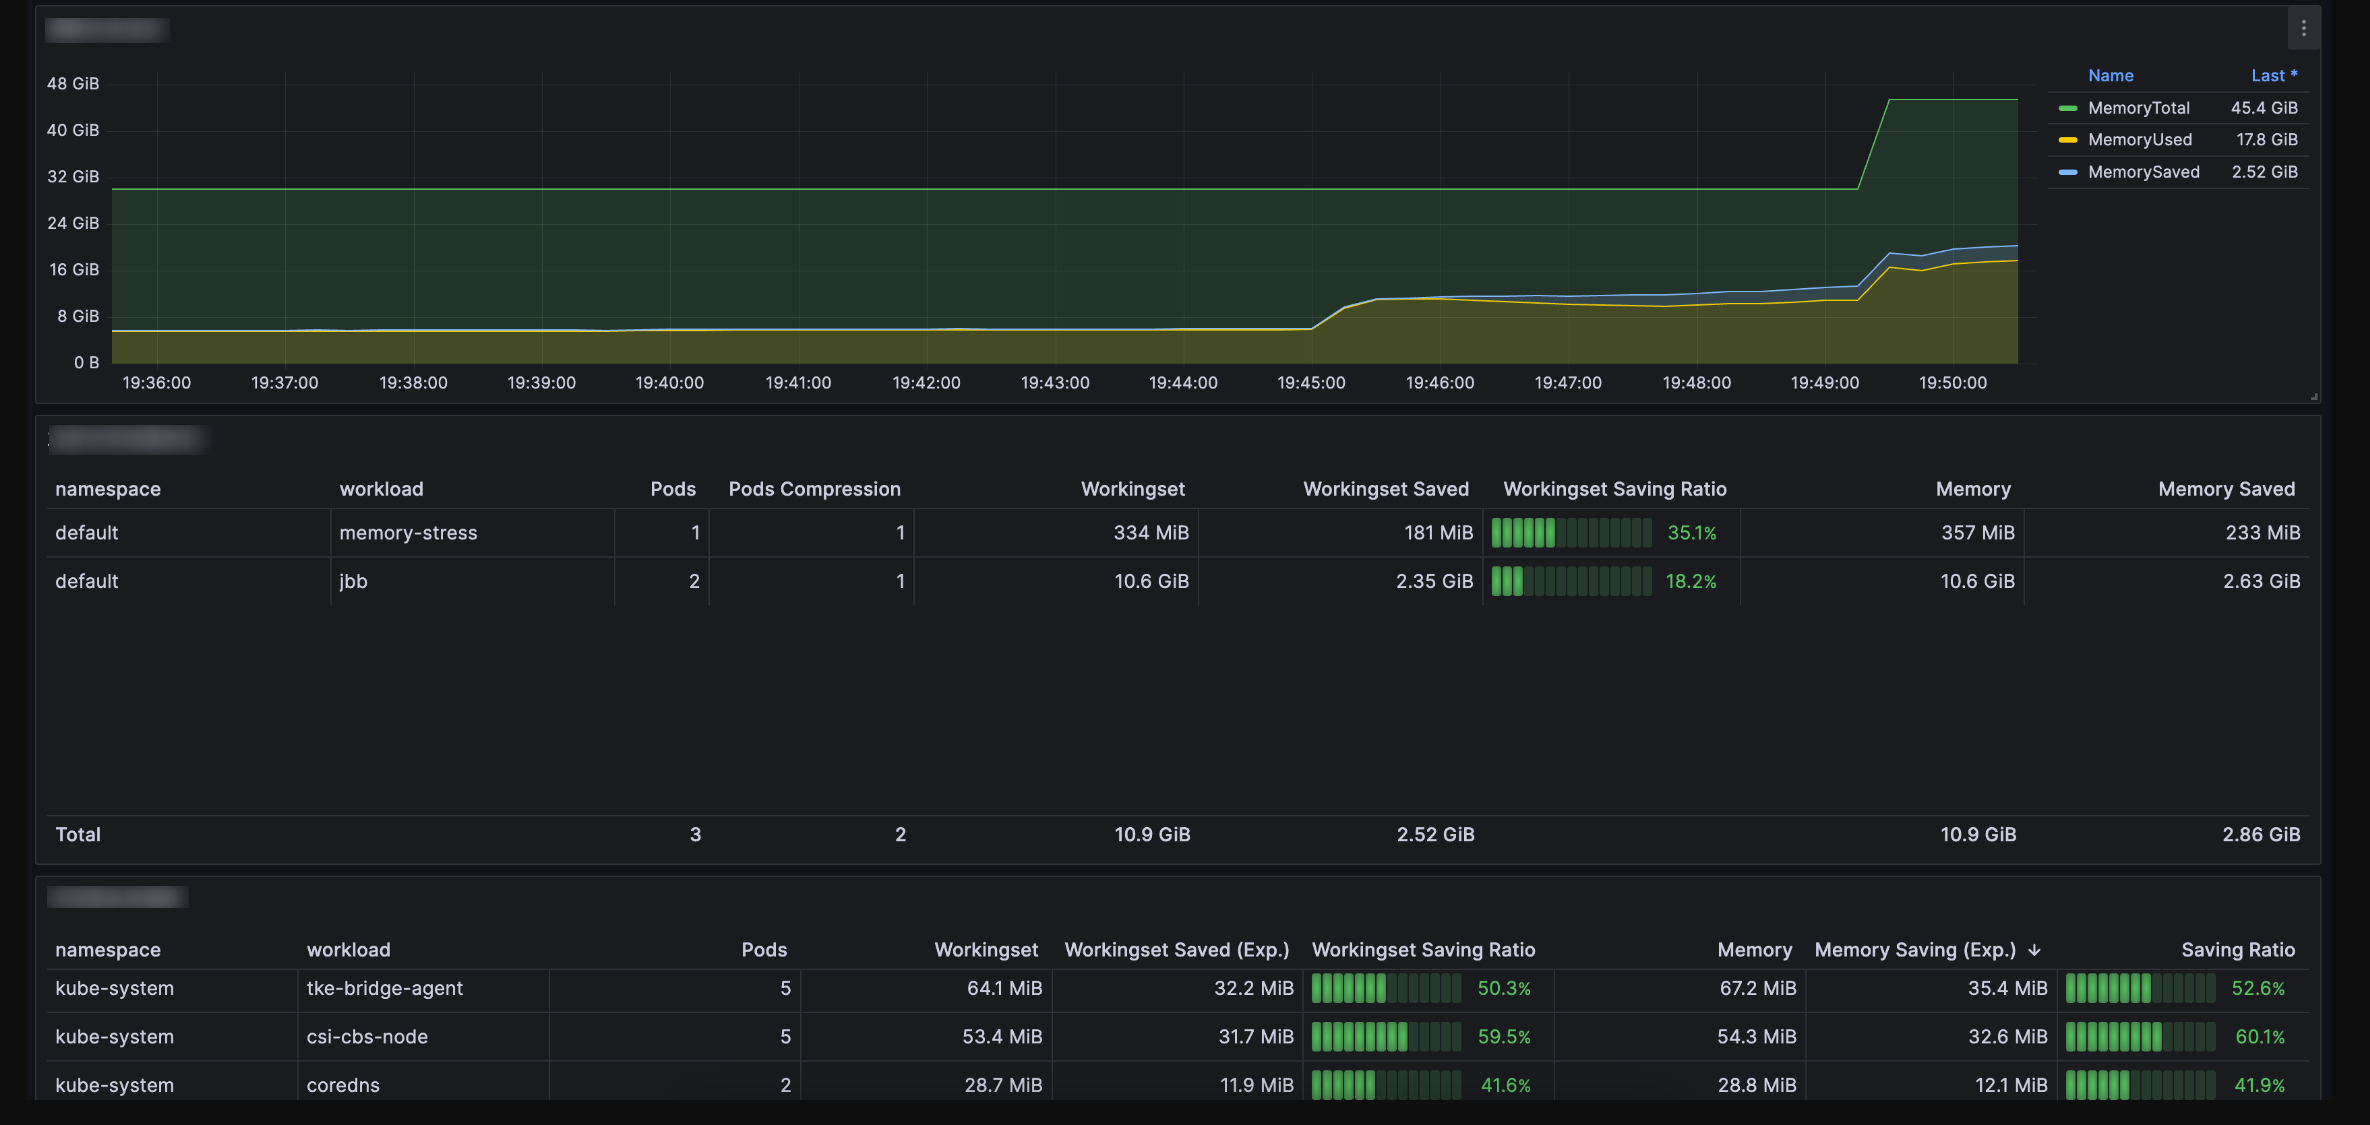
7. Import the following two panels in Grafana:
Cluster Dimension Panel. You can submit a ticket to obtain it, as shown below:
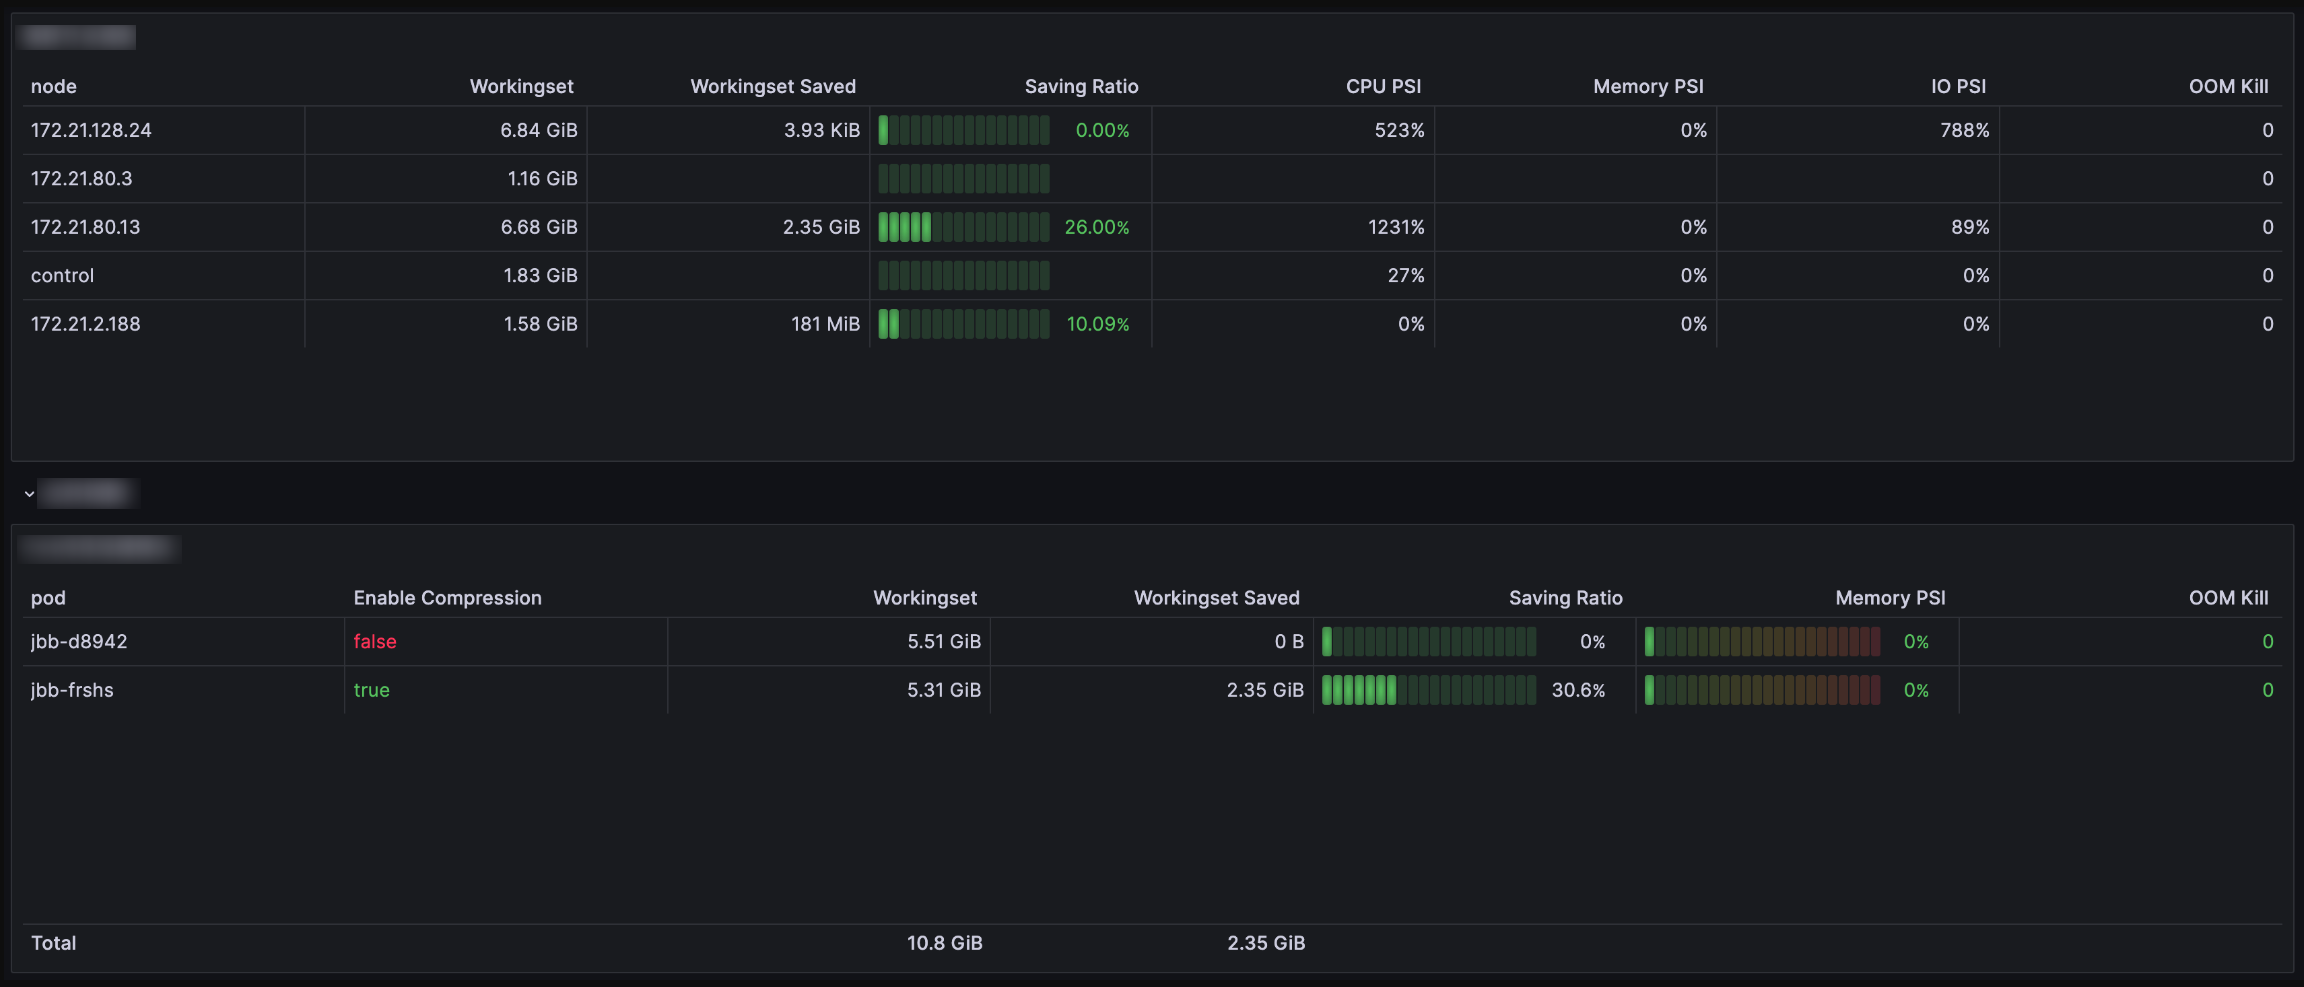
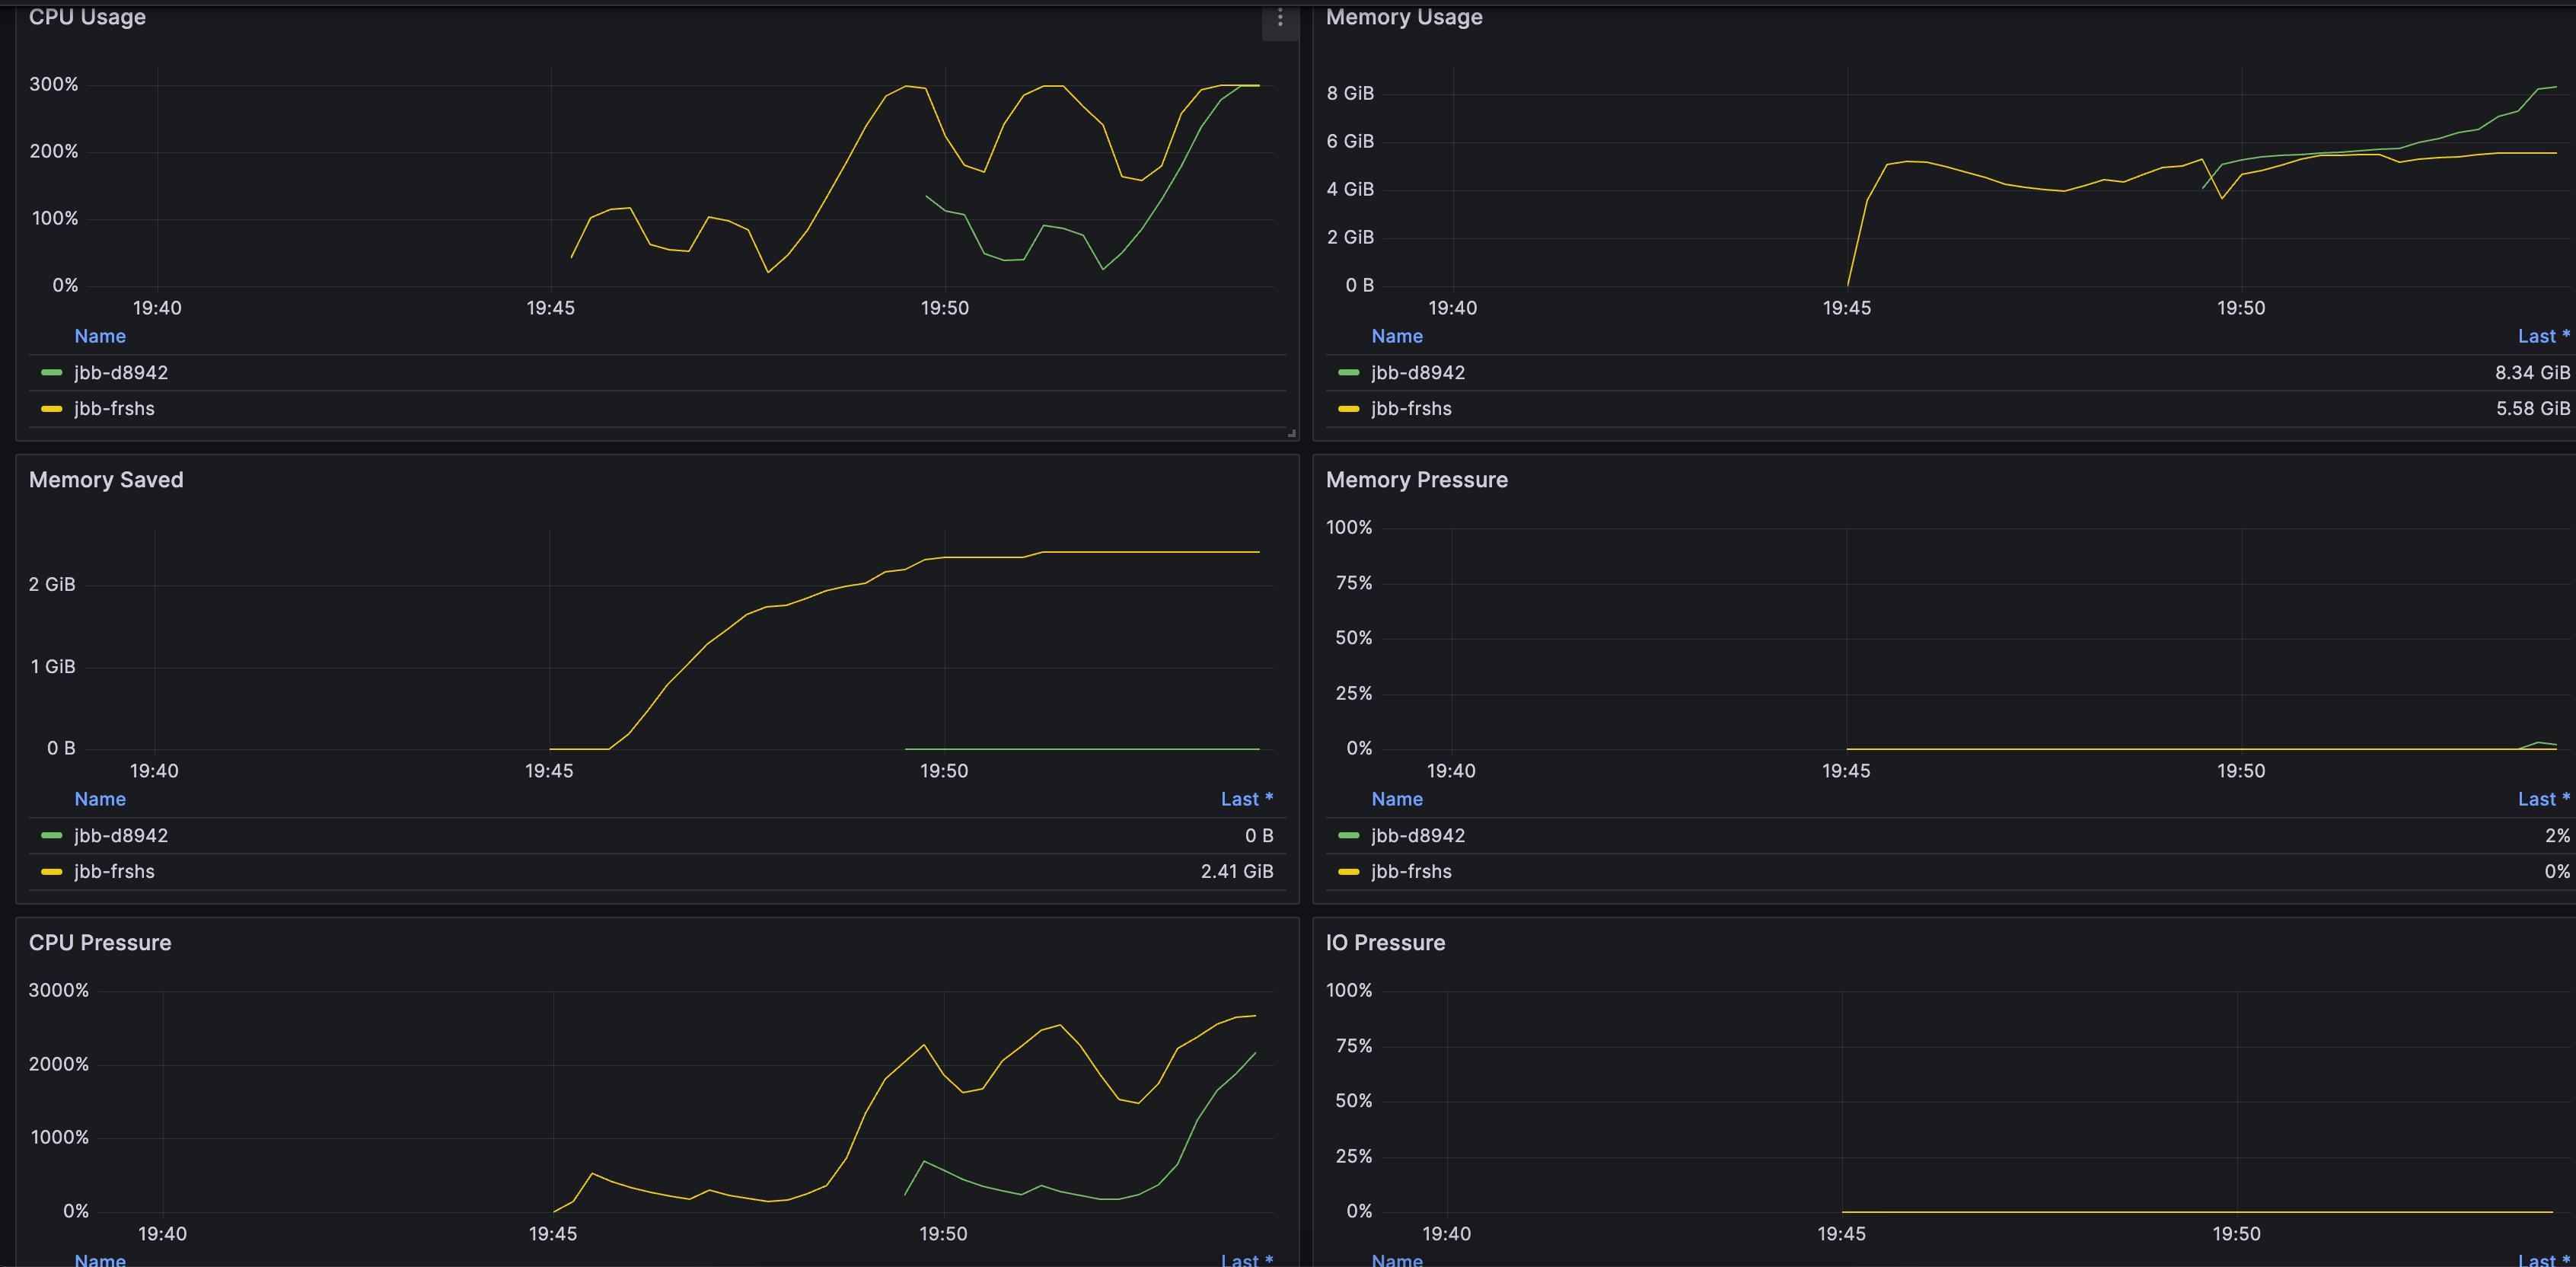
Node Dimension Panel. You can submit a ticket to obtain it, as shown below:
Bantuan dan Dukungan
Apakah halaman ini membantu?
Anda juga dapat Menghubungi Penjualan atau Mengirimkan Tiket untuk meminta bantuan.
masukan