Back pressure as described in Monitoring Back Pressure is an exception on a job: An operator is producing data faster than the downstream operators can consume due to slow processing by the downstream operators, congested transmission links, or other reasons, resulting in data piling. Then, piling will gradually occur in the upstream operators and finally in the data source, so less data is consumed than expected. If back pressure is not relieved for a long time, the total throughput of the job will decline greatly, even to 0.
If moderate back pressure occurs in an operator (the operator's back pressure displayed in the Flink Web UI is less than 50%, for example), you may observe the operator for more time to check whether the back pressure is occasional. A back pressure exceeding 50% (as shown below) probably affects the job performance greatly, and you need to handle it as soon as possible.
Note
This feature is in beta testing, so custom rules are not supported. This capability will be available in the future.
Trigger conditions
The system detects the operator back pressure in a Flink job every 5 minutes. If the back pressure of an operator (if there are multiple operator parallelism values, the max is used) is higher than 50%, the detection will continue until an operator is found to have a back pressure (Backpressued in the figure) lower than the threshold but a busyness (Busy in the figure) higher than 50%. This operator is generally the root cause of the back pressure, whose data processing rate is relatively slow. If you view the Flink Web UI of the job as instructed here at this moment, you will see a series of gray operators followed by a red operator.
If the back pressure of an operator in the link is higher than 50% but lower than 80%, an OceanusBackpressureHigh event is triggered. If the back pressure exceeds 80%, an OceanusBackpressureTooHigh event is triggered.
Note
To avoid frequent alarms, at most one push of this event can be triggered per hour for each running instance ID of each job.
Back pressure detection is available only to Flink v1.13 or later.
Alarm configuration
You can configure an alarm policy as instructed in Configuring Event Alarms (Events) for this event to receive trigger and clearing notifications in real time.
Note
OceanusBackpressureHigh and OceanusBackpressureTooHigh are two different alarm events. If you only care about a severe back pressure event that affects the job running, you can set an alarm for OceanusBackpressureTooHigh only.
Suggestions
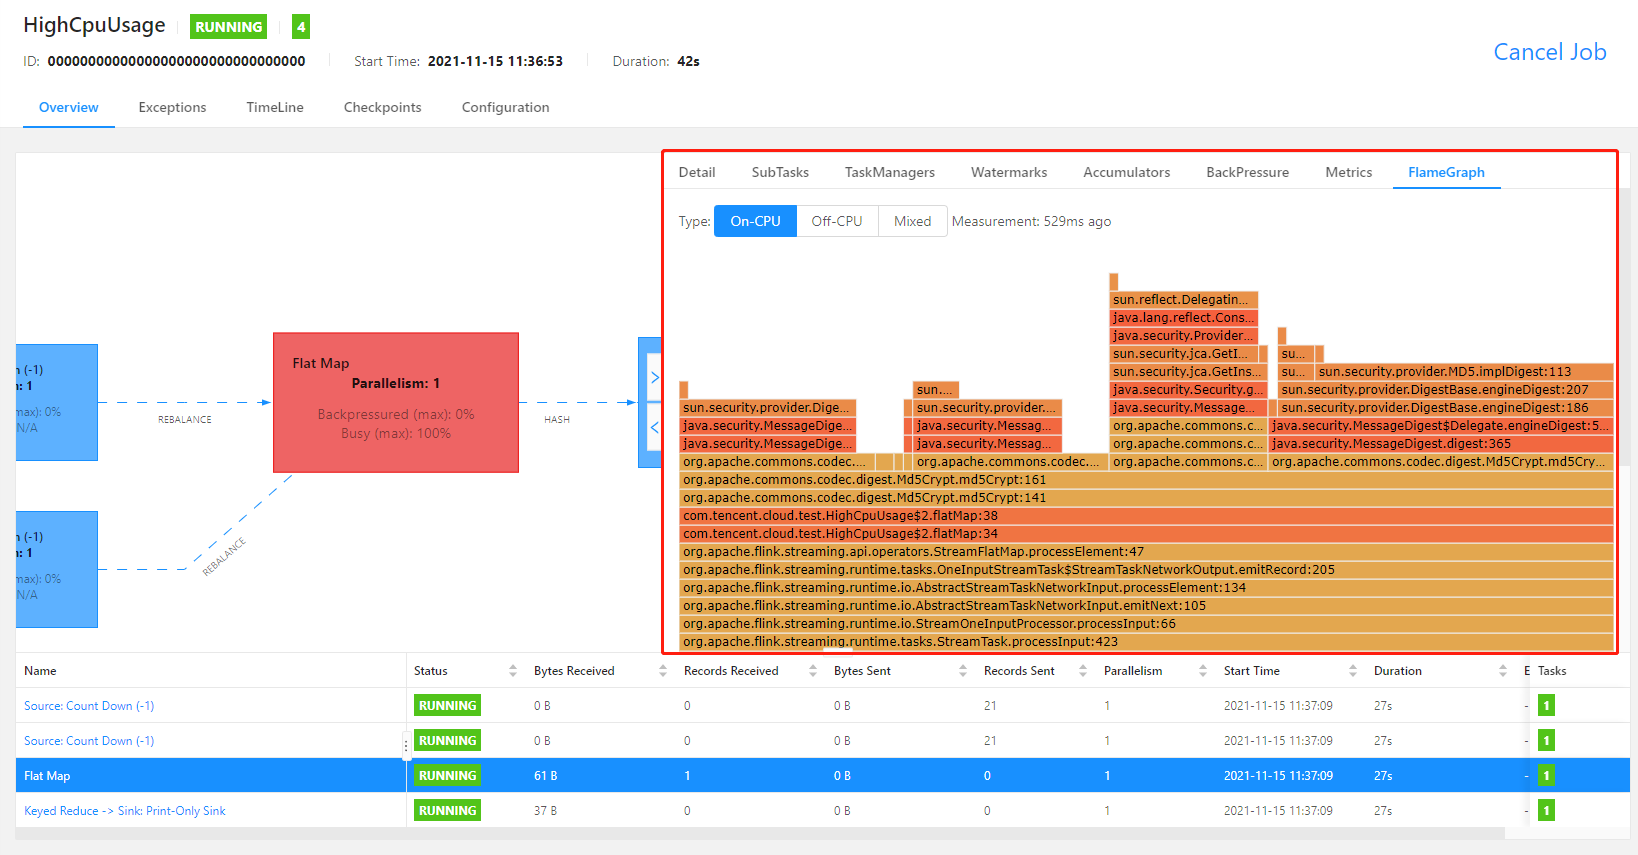
If you receive the push notification of this event, we recommend you immediately view the Flink Web UI as instructed here and analyze the current execution graph. If the source operator causing the back pressure is spotted, we recommend you use the built-in Flame Graphs in Flink UI to analyze method call hotspots, i.e., those methods that occupy a lot of CPU time. Specifically, you need to add rest.flamegraph.enabled: true to the advanced parameters of the job as instructed in Advanced Job Parameters, and publish the new job version to use flame graphs.
For example, in the CPU flame graph of a busy operator shown below, the method for MD5 calculation has used too much CPU time and restricted the job performance. In this case, you can modify the calculation logic in this operator to avoid frequent calls of this method, use a more efficient algorithm, or take other optimization actions.
We also recommend you configure more resources for the job as instructed in Configuring Job Resources. For example, you can increase the TaskManager spec (an increased CPU quota of a TaskManager to manipulate more state) or set a larger operator parallelism (reduced amount of data processed by a TaskManager to reduce the computing pressure of its CPU) for more efficient data processing.
If the source of back pressure is not found, and the problem persists after all above methods are used, submit a ticket to contact the technicians for help.