Feature Description
DBbrain provides the database autonomy service, which supports automatic SQL throttling and abnormal SQL killing. After the autonomy service is configured and enabled, the system performs automatic detection in case of high SQL concurrency (caused by cache penetration, abnormal calls, or other reasons) or high CPU consumption by SQL statements (such as those with poor performance or a long lock wait time). When trigger conditions are met, SQL throttling and abnormal SQL killing are automatically triggered to solve database issues. No manual intervention is required.
Note:
Currently, only TencentDB for MySQL and TDSQL-C for MySQL are supported.
Only the automatic throttling and killing features are supported now. More autonomy features will be supported in the future.
Automatic throttling limits the concurrency of SQL statements executed on databases. Currently, only threshold-based automatic throttling is supported. Throttling based on smart calculation will be supported in the next version.
Configuring the Autonomy Service
2. In the left sidebar, select Performance Optimization.
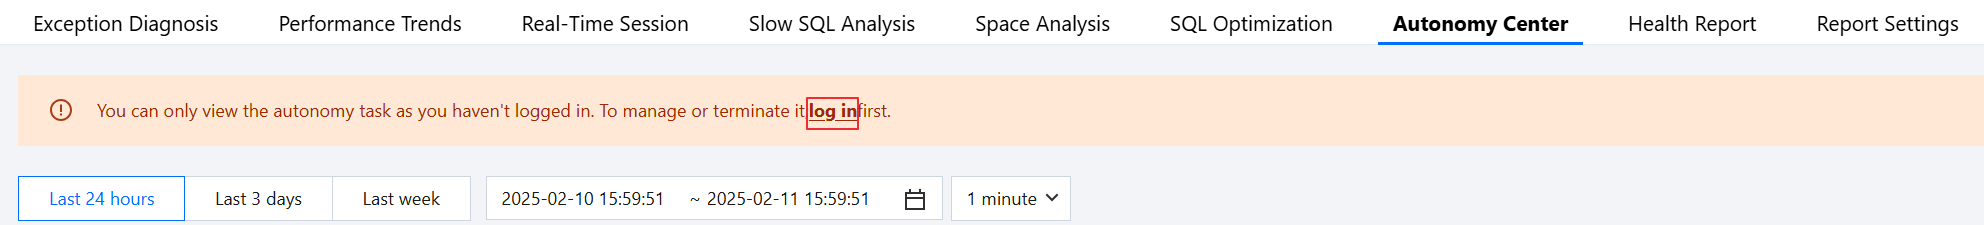
3. Select the Instance Type and Instance ID at the top of the page, and click the Autonomy Center tab.
4. Click log in, enter the account and password, click OK to log in to the database.
5. Click Autonomy Configuration in the upper right corner of the page.
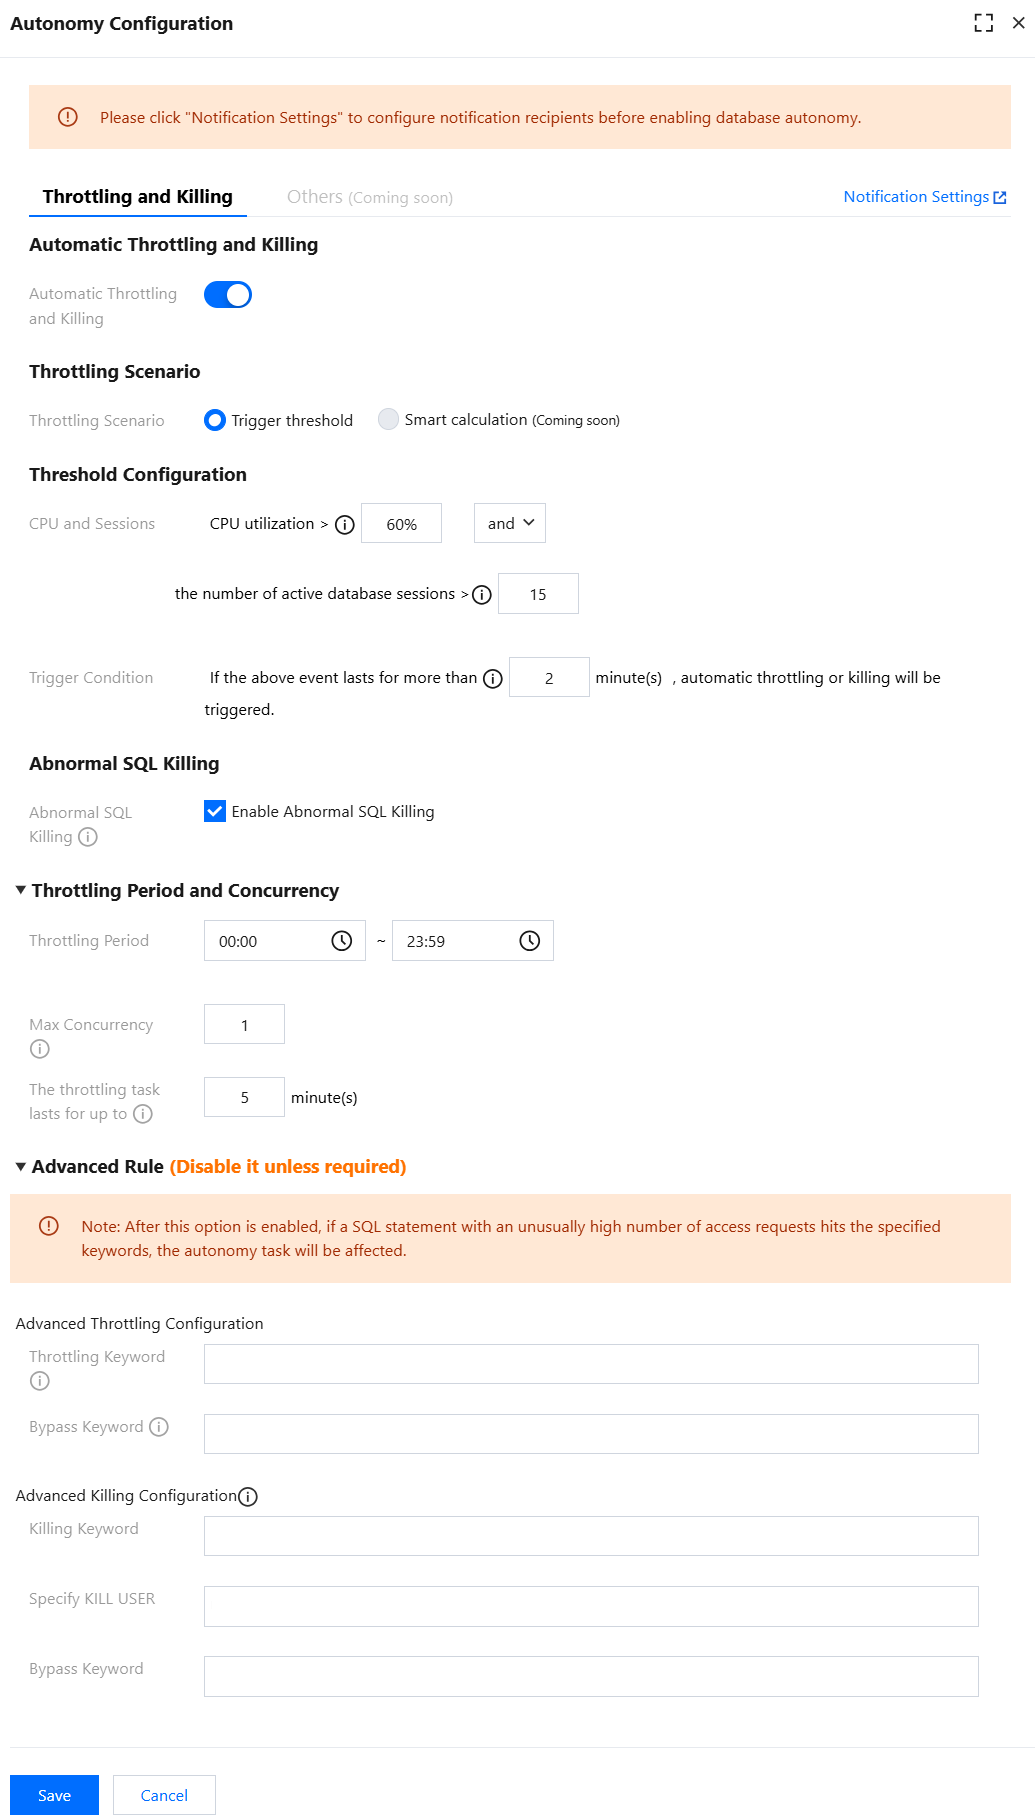
6. Turn on the switch of Automatic Throttling and Killing and configure the parameters as prompted.
Configuration parameters and their descriptions are listed in the table below.
|
Throttling Scenario | Currently, only Trigger threshold is supported. |
Threshold Configuration | Set the threshold trigger condition. CPU and Sessions: Set thresholds for CPU utilization and the number of database sessions, supporting and and or as judgment criteria. Trigger Condition: Set the duration of an event. Automatic throttling is triggered when the set thresholds and judgment rules of the CPU utilization or number of sessions are met and the event duration exceeds the set duration. As shown above, automatic throttling is triggered if the CPU utilization exceeds 60% or the number of active database sessions is greater than 15, and the event lasts more than 2 minutes. |
Abnormal SQL Killing | Select Enable Abnormal SQL Killing. If it is enabled, abnormal SQL statements under execution will be terminated when automatic throttling is triggered. The system's default abnormal SQL statements include those that occupy many resources or have a long lock wait time. If you need to specify rules for KILL SQL, go to Advanced Rule to set Advanced Killing Configuration. |
Throttling Period and Concurrency | Throttling Period: The time period during which automatic SQL throttling can be performed. Max Concurrency: The maximum number of concurrent SQL executions allowed for throttling. If the maximum concurrency for throttling is set to 0, it means all SQL executions are restricted. The throttling task lasts for up to: The maximum duration of the throttling task after initiating automatic throttling. If you need to specify throttling rules, please go to Advanced Rule to perform Advanced Throttling Configuration. |
Advanced Rule | Specify the keywords to be throttled or killed in the Advanced Rule area. You can also specify the keywords to be bypassed. If the keywords you set do not match abnormal SQL statements detected by DBbrain, the autonomy task performance will be affected. It is not recommended to enable advanced configuration unless necessary. Note: The relationship among configuration items is logical AND. Each configuration item supports setting multiple keywords, and the keywords are case-sensitive. The rule takes effect when any of the keywords are hit. If you set multiple keywords for each item, hitting one will take effect, and keywords are case-sensitive. Advanced Throttling Configuration: Selected and configured Available Throttling Period and Concurrency. Throttling Keyword: Throttling is triggered when DBbrain detects a keyword for throttling. Bypass Keyword: When DBbrain detects that the specified release keyword meets the configured throttling scenario trigger condition, it will be released without initiating throttling. Advanced Killing Configuration: Enable Abnormal SQL Killing is checked. Killing Keyword: When DBbrain detects that the exception SQL contains the specified keyword, the exception SQL will be KILLed. Specify KILL USER: Abnormal SQL statements are killed when DBbrain detects any of the specified USER values in the abnormal SQL statements. Bypass Keyword: When DBbrain detects that the abnormal SQL contains the specified release keyword, it will release the abnormal SQL containing the keyword without performing a KILL operation. |
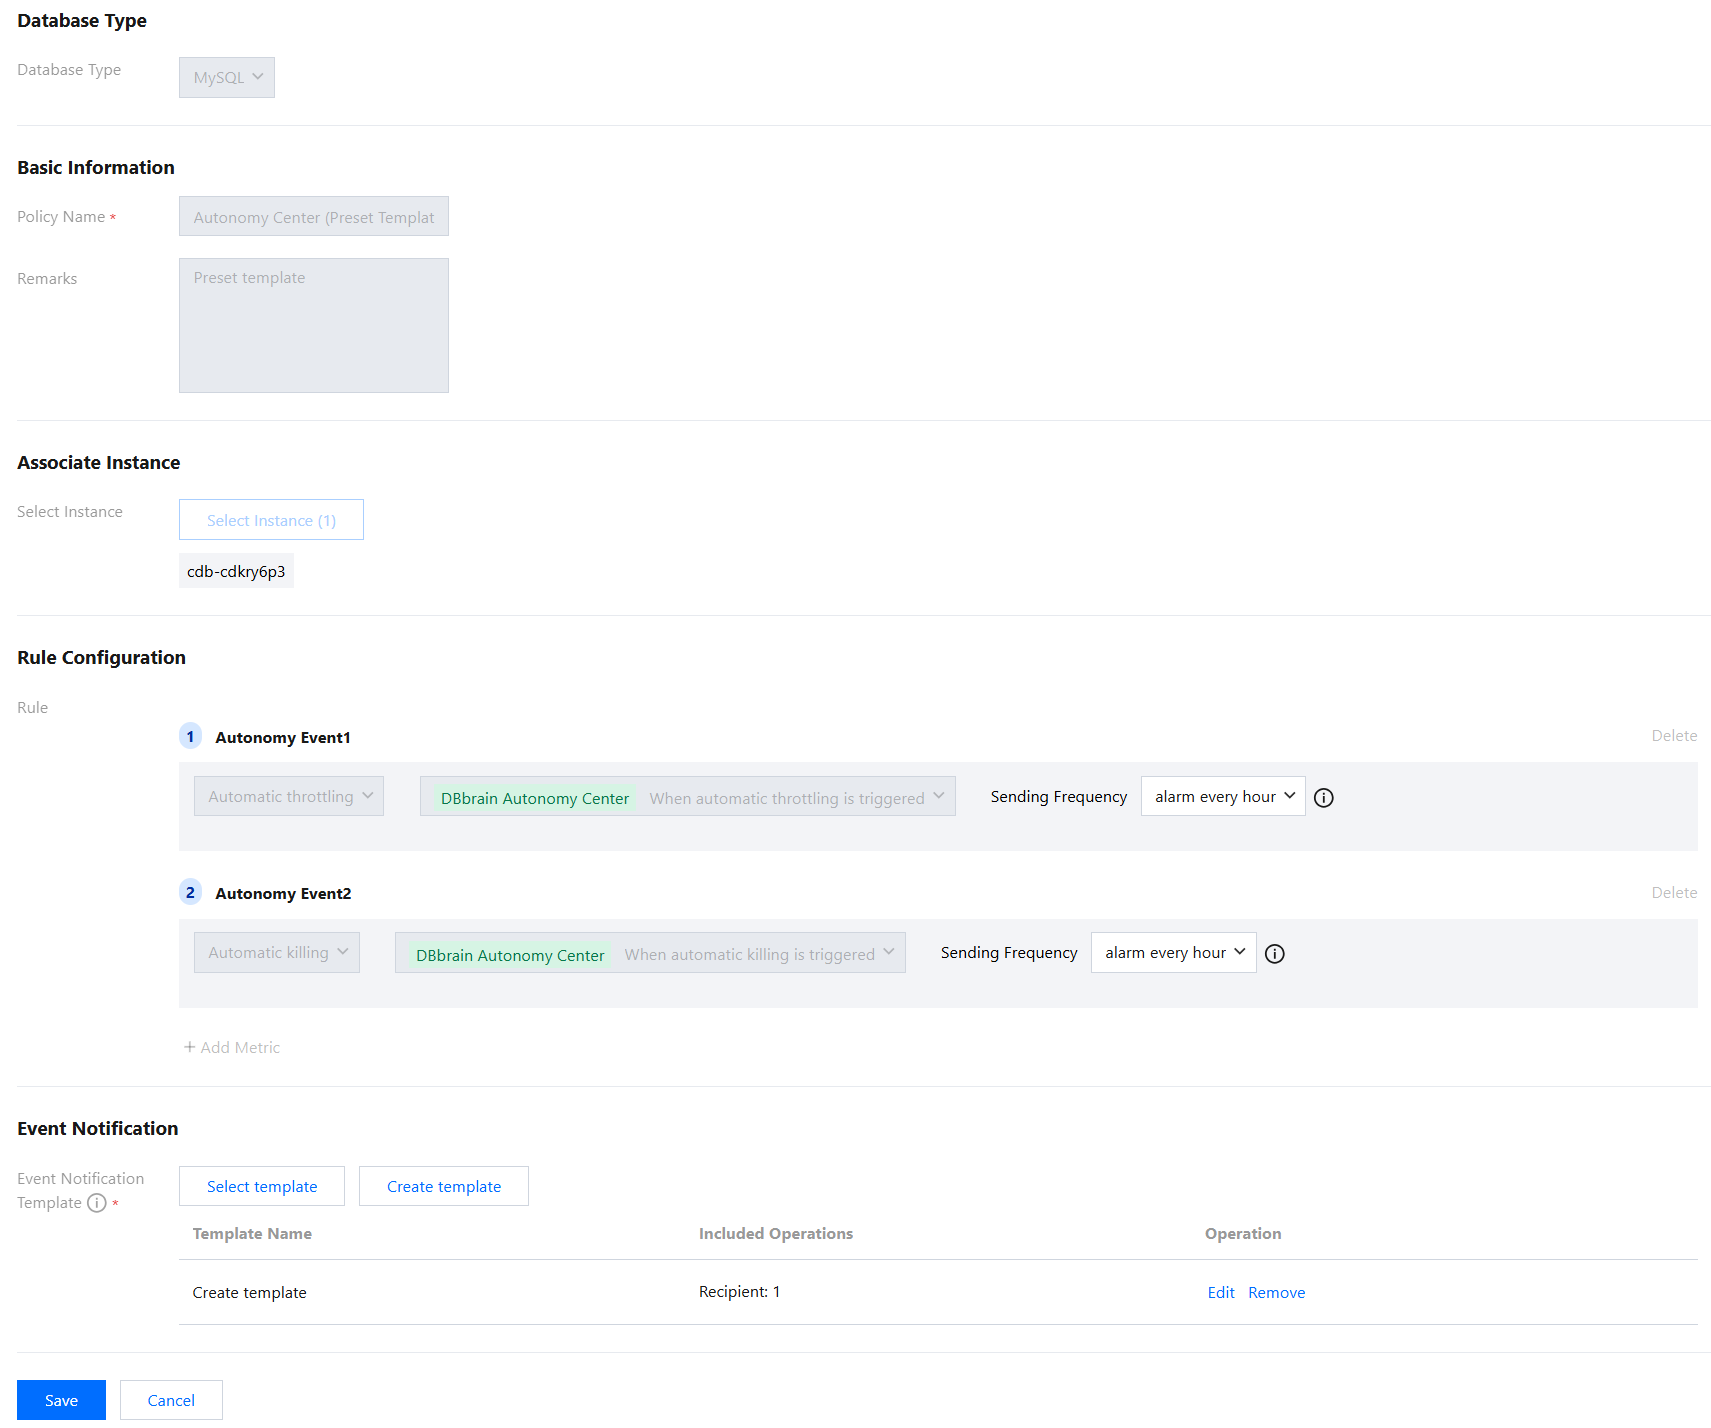
7. On the right side of the Autonomy Configuration page, click Notification Settings to jump to the Event Notification page. You can only configure the sending frequency of events and user notifications. After the configuration is completed, click Save.
Note:
The autonomy service uses a built-in policy template for event notifications. This template is automatically loaded when you configure the autonomy policy for your autonomy instances for the first time. You can modify only the sending interval and event notification template but not the instance information. If you want to modify other information in the built-in policy template, copy the template and modify the information in the new template. For details, see Event Notification. 8. Go to the Autonomy Configuration page, click Save, and in the pop-up dialog box, click OK.
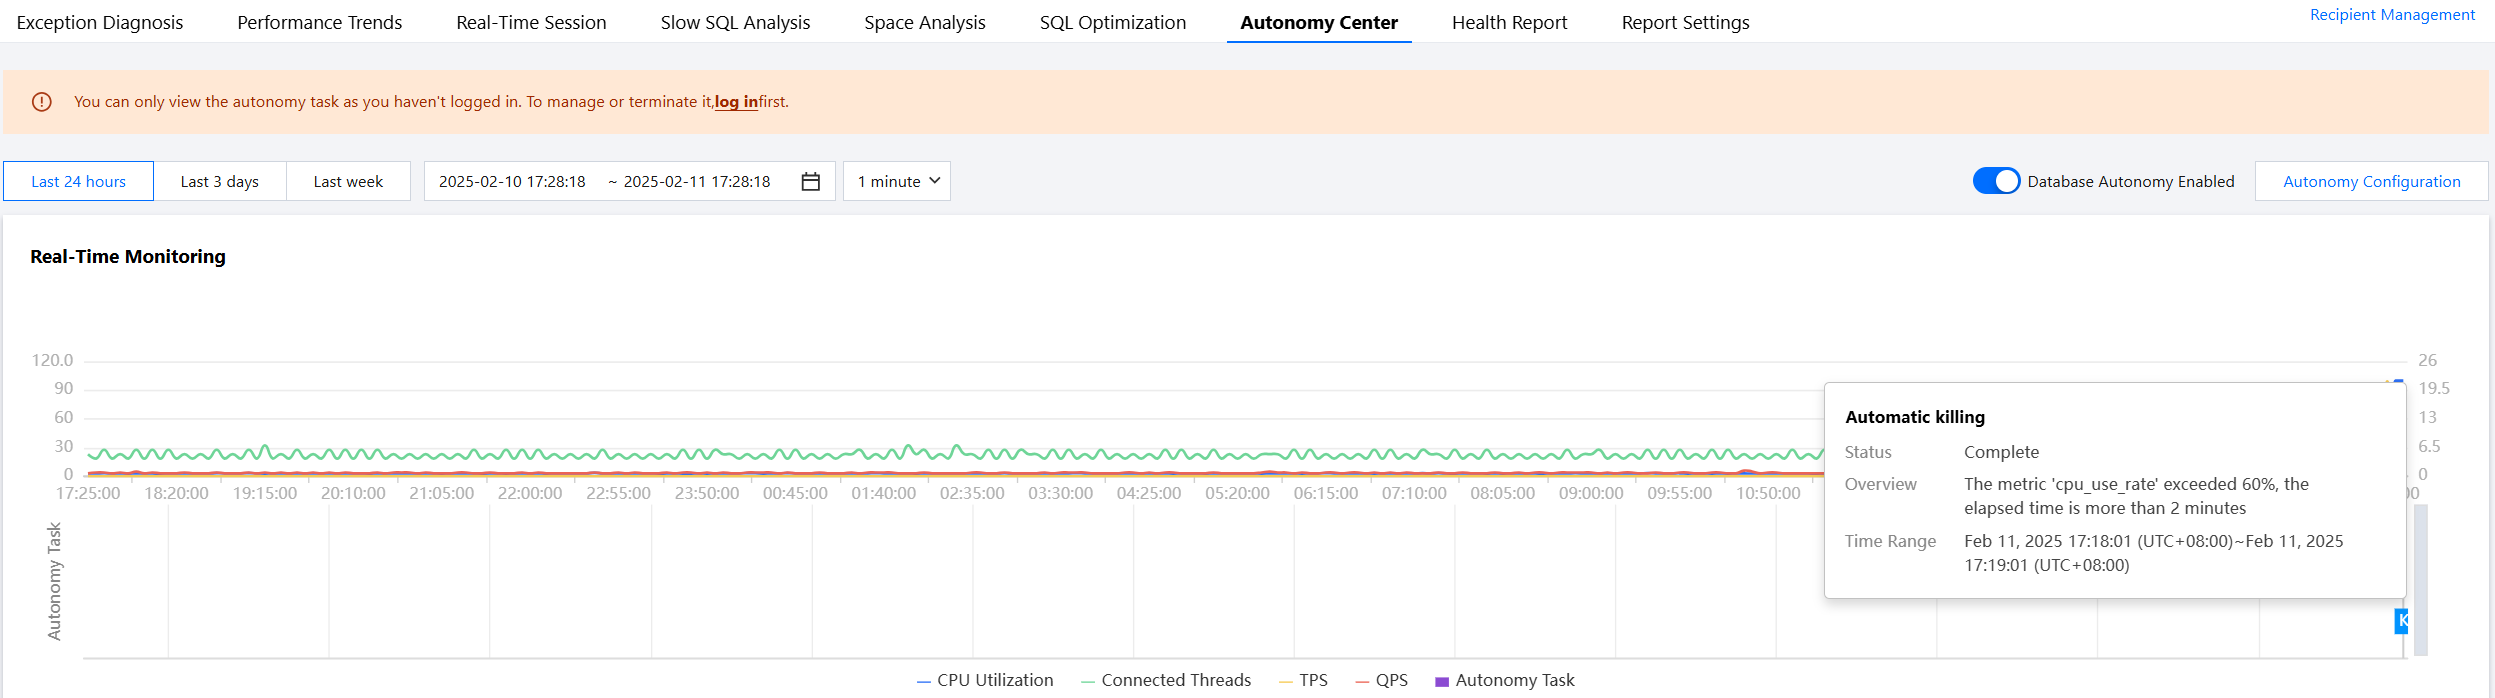
After the configuration is completed, the autonomy feature is automatically enabled. On the Autonomy Center page, the Database Autonomy Enabled switch is turned on.
Viewing the Autonomy-Related Information
After you enable the autonomy service, you can view the relevant information of the last 24 hours, last 3 days, last week, or a specific time range. Specifically, you can view the real-time monitoring data of performance and autonomy tasks, autonomy event details, and autonomy task distribution.
Viewing the Real-Time Monitoring Data
You can view the monitoring data of performance (CPU, Connected Threads, TPS, and QPS) and autonomy tasks (automatic throttling and abnormal SQL killing tasks).
You can hover over a specific autonomy task to view task details or hover over the performance monitoring line graph to view all performance data generated at a specific time point.
Viewing Autonomy Events
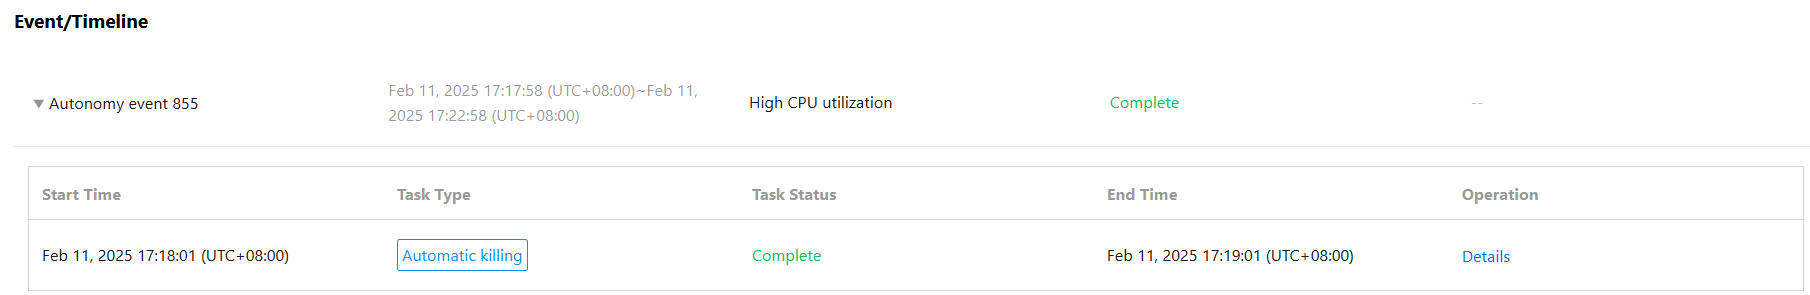
You can view the occurrence time, trigger condition, and current status of autonomy events in the selected time range. You can also view the type, status, start/end time, and details of autonomy tasks triggered by autonomy events. In addition, you can terminate running autonomy tasks of autonomy events.
Note:
The Real-Time Session page also displays SQL throttling and killing tasks triggered by autonomy events.
SQL Throttling tab: View SQL traffic throttling tasks with the source as autonomous events. For detailed introduction and operation, please refer to View SQL Traffic Throttling Tasks. Session kill task list on the Active Session tab: You can view killing tasks with the type of Autonomy Center. For details, see Killing Sessions During a Period. Viewing Details of Autonomy Tasks Triggered by Autonomy Events
1. Click an autonomy event in the event list to display autonomy tasks triggered by the event.
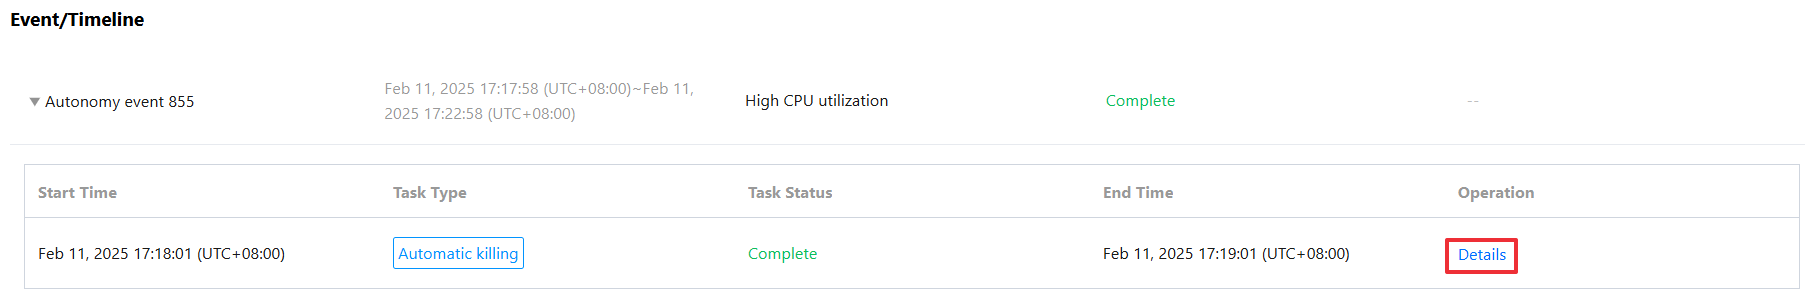
2. Click Details in the Operation column of an autonomy task to view the task details.
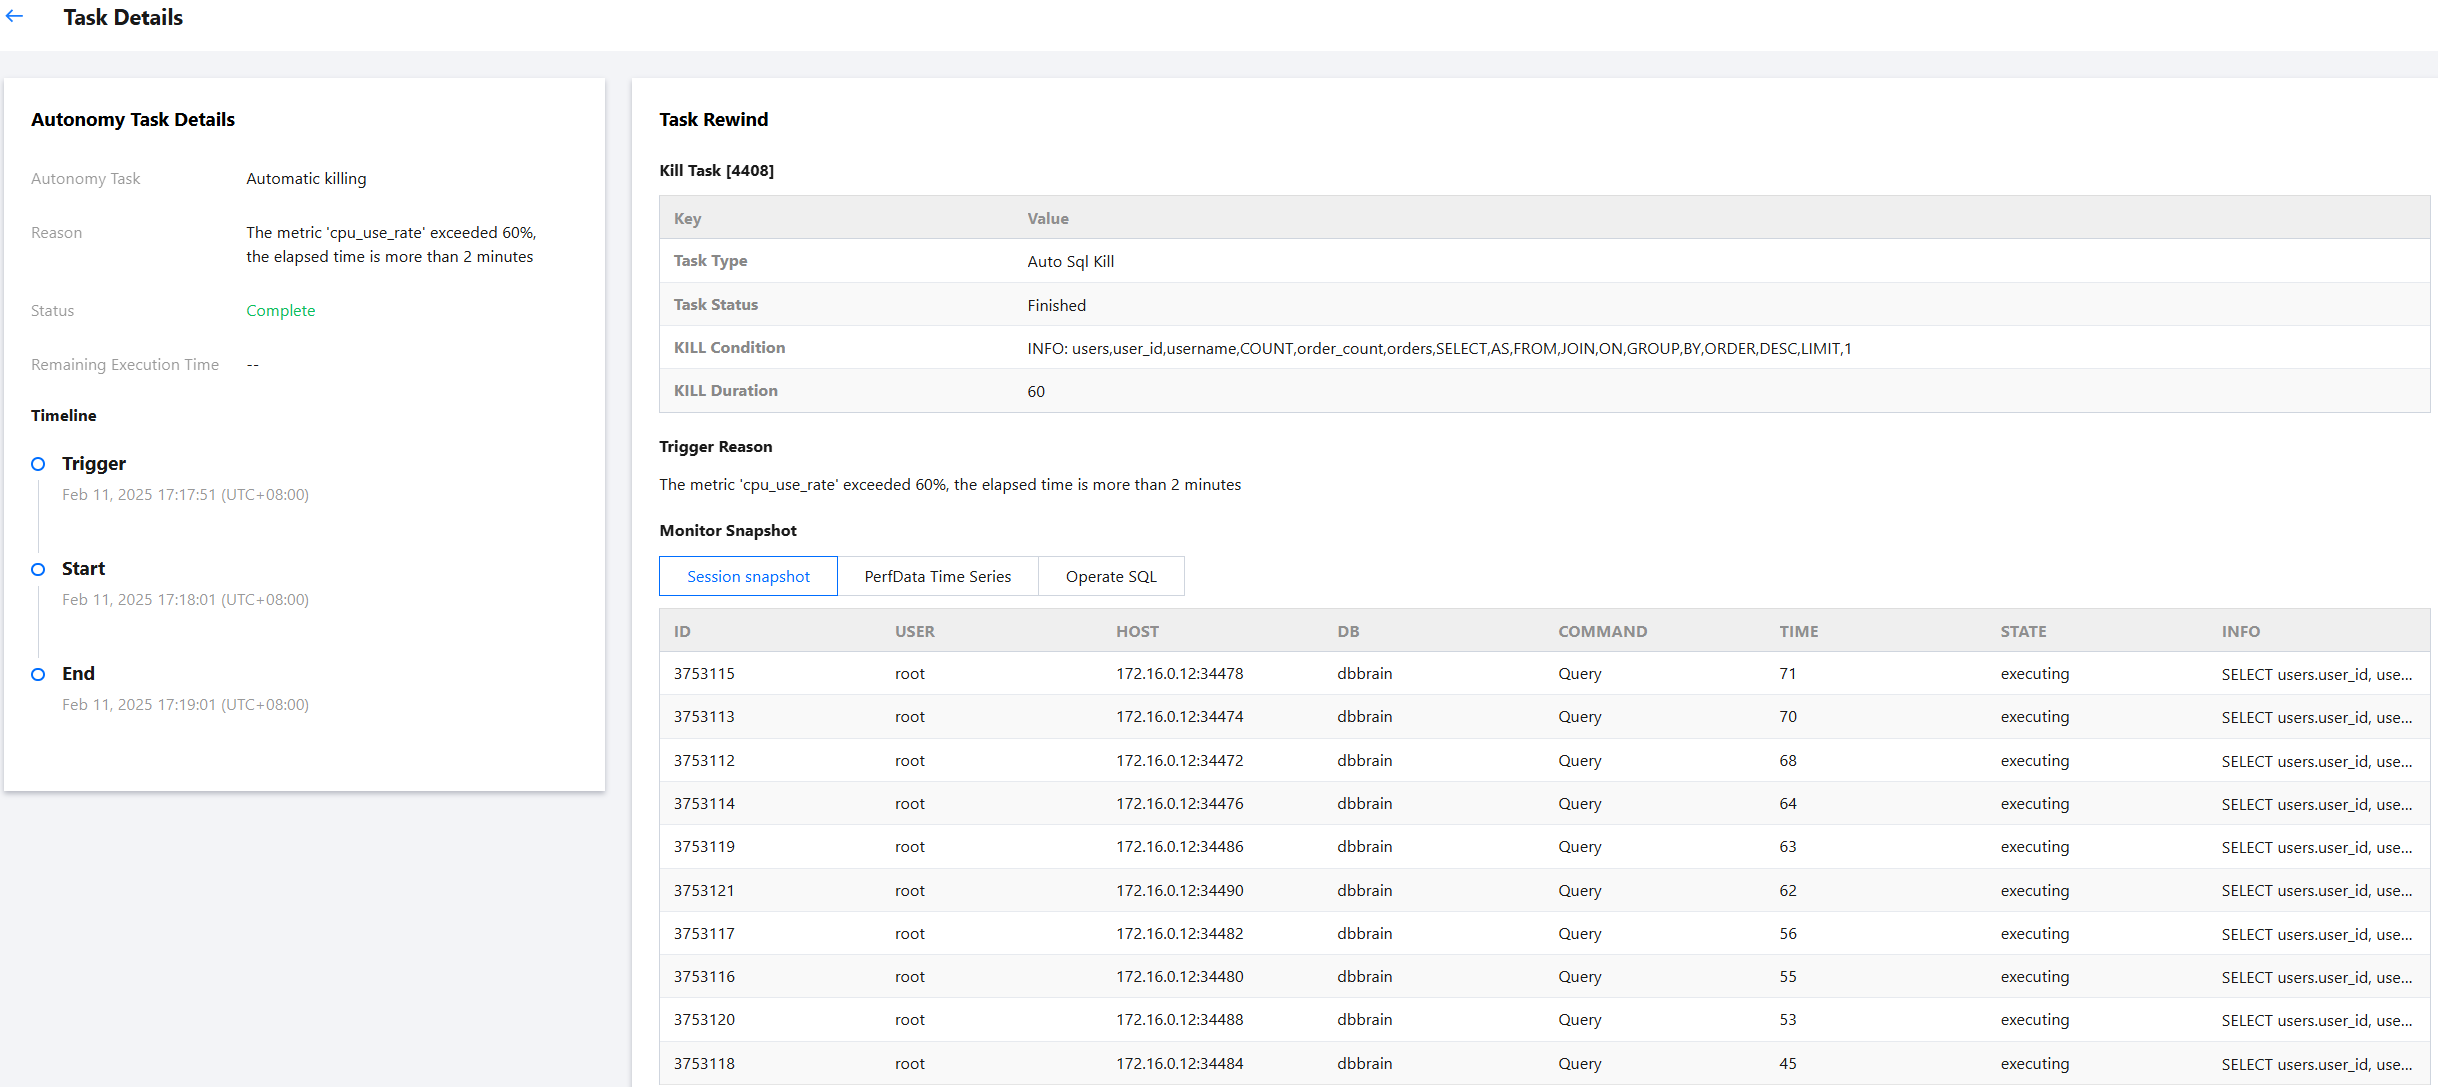
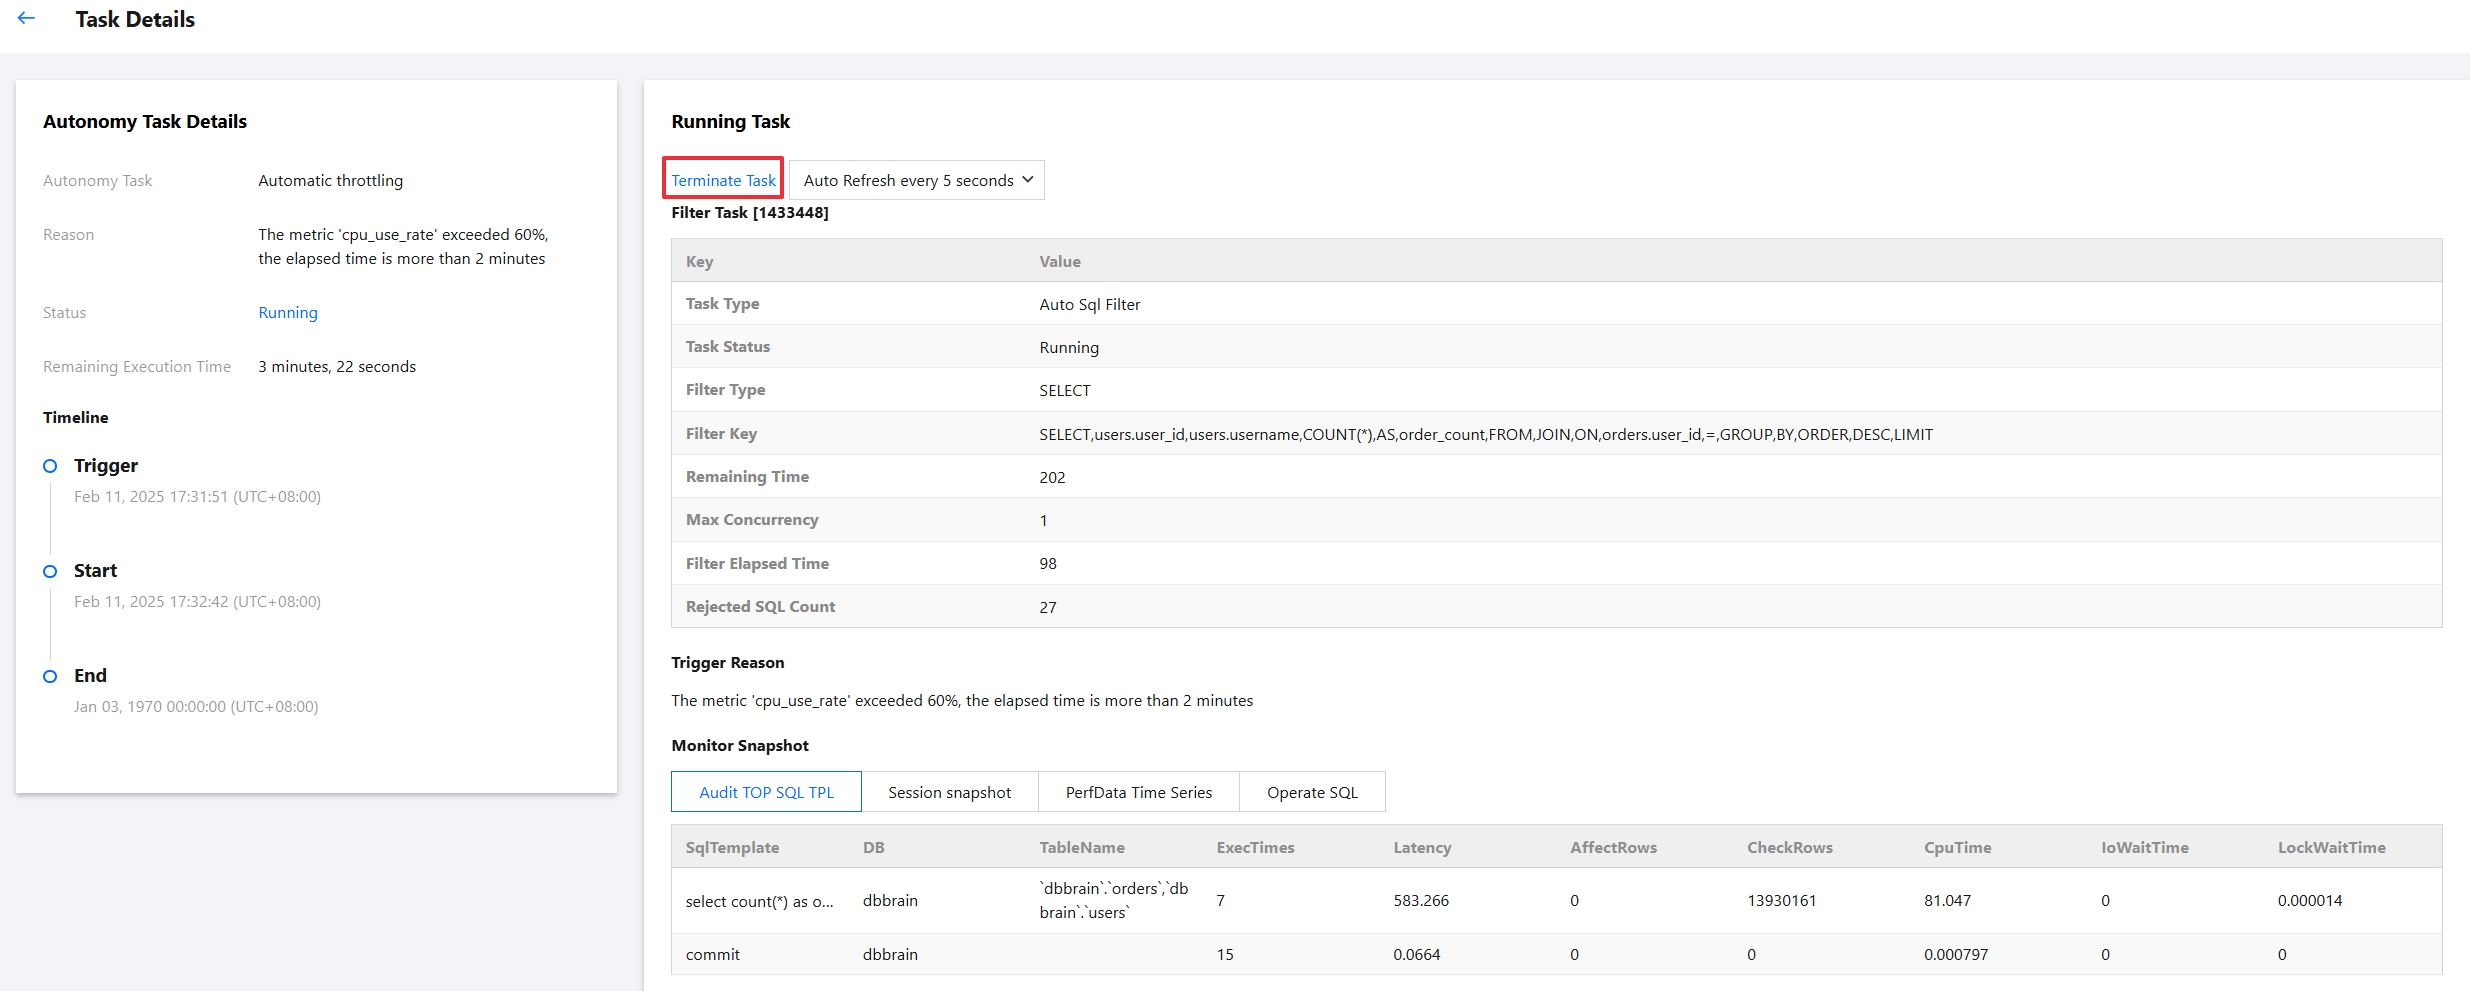
3. Go to the Task Details page, and view the reason for triggering the autonomy task, task status, type of throttled SQL statements, throttling keywords, remaining time, maximum concurrency, execution time, and number of rejected SQL statements. You can also view the data on the Session Snapshot, PerfData Time Series, and Operate SQL tabs.
Terminating Autonomy Tasks
You can terminate a specified or all autonomy tasks of running autonomy events if the task or autonomy service is no longer needed. Only running autonomy events support this operation. Subsequent autonomy events can still trigger tasks normally.
Note:
To terminate an autonomy task, log in to the database first. Otherwise, you can only view the task.
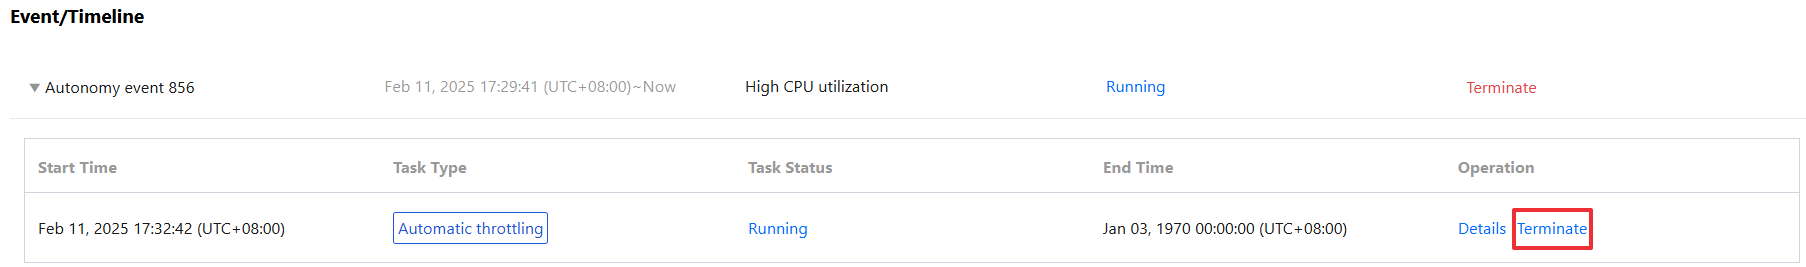
1. Find an autonomy event in the Running status in the event list.
2. Terminate autonomy tasks of the autonomy event in the following ways.
Terminate all autonomy tasks under an autonomy event: Click Terminate in the operation column corresponding to the autonomy event.
Terminate a specific autonomy task under an autonomy event: Click to expand the autonomy event, click Terminate in the operation column corresponding to the autonomy task, or click on Details and then click Terminate Task on the Details Page.
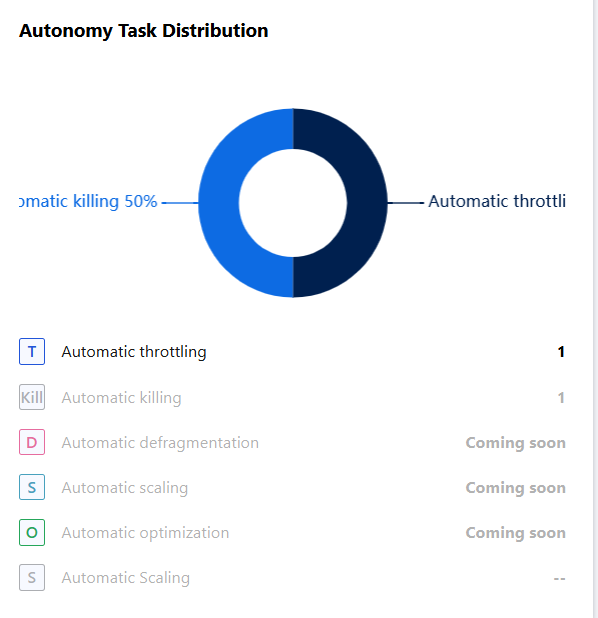
Viewing the Distribution of Autonomy Tasks
After you enable the autonomy service for an autonomy event, the distribution chart will automatically refresh itself and count the number of autonomy tasks triggered within the selected time range. The chart will also display the proportion of different types of autonomy tasks.