Instance Operation and Maintenance is the operation page for instance snapshots generated by computing tasks based on scheduling policies and event listening. Through this page's features, you can view and manage Cycle instances and event instances. Maintenance is carried out through a series of operations to ensure that data processing and operation processes are stable, effective, and reliable.
3. Select the corresponding project and click to enter the data development module.
4. In the left directory tree, click Instance Ops.
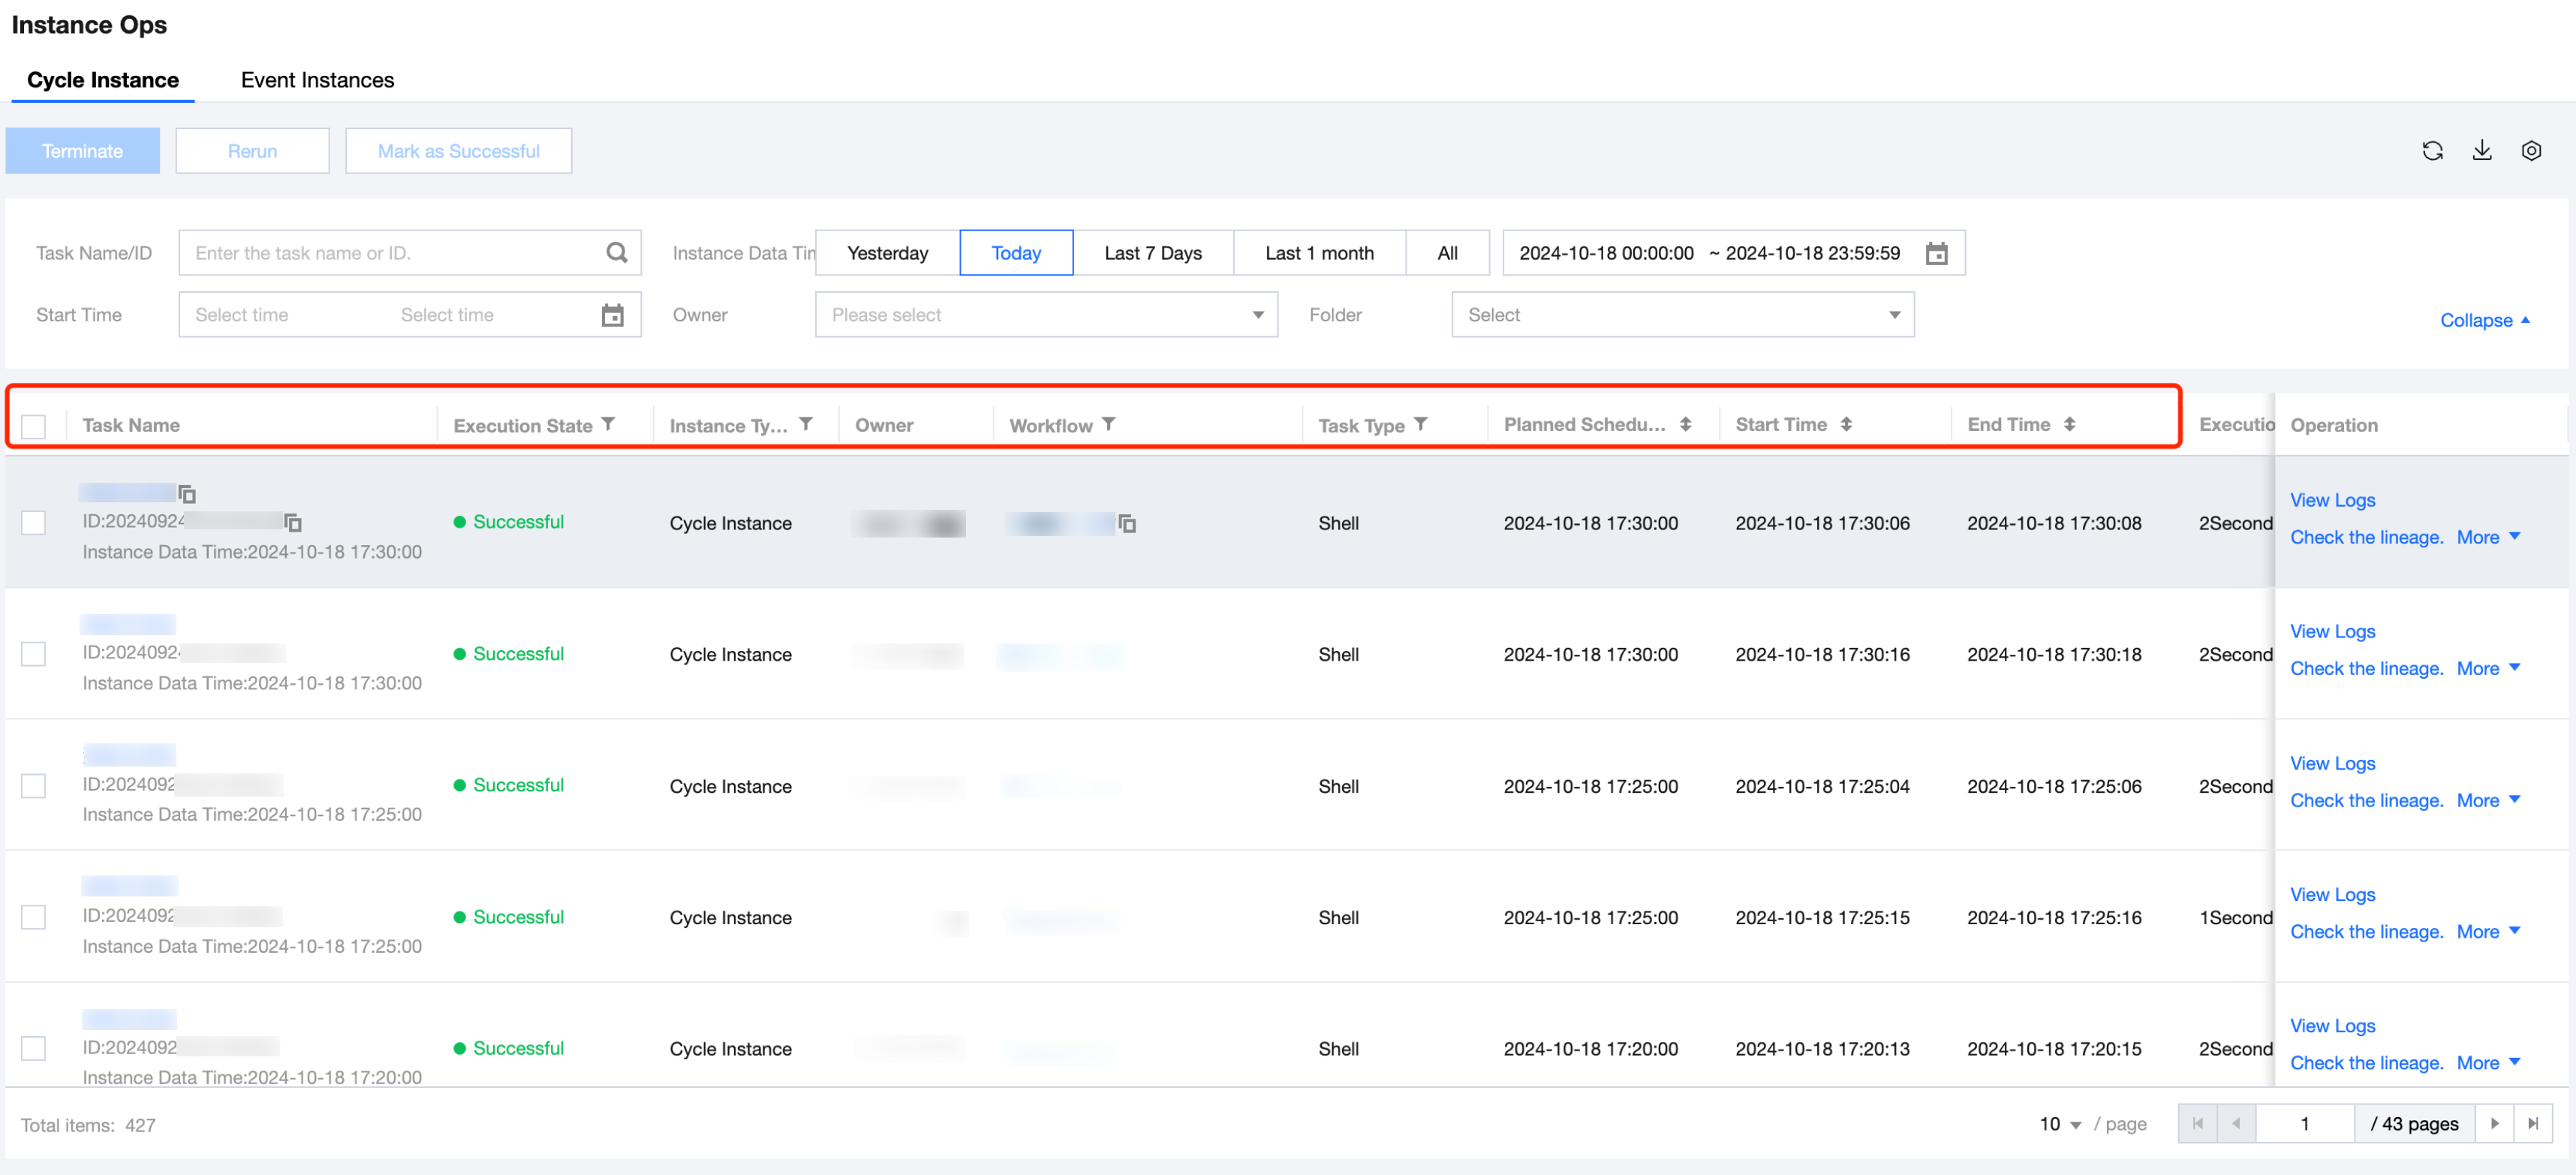
Cycle Instance List
The Cycle Instance page displays detailed information and operation features for instances generated by computing tasks through scheduling policies. You can view the instance running status, logs, and upstream and downstream relationships of parent-child instances. You can also perform operations such as rerun, terminate, and set successfully.The system currently retains instances for only 3 months; instances older than 3 months will be automatically cleaned up.
Cycle Instance List Information
Feature description:
Information
Description
Task name.
Task name: Clickable and redirects to the instance details page - instance lineage. Copying is supported.
Task ID: Used for querying logs and troubleshooting in the backend. Copying is supported.
Instance Data Time: The data time of the display task. A task name and instance data time uniquely identify an instance.
Execution Statue
Instance running status by cycle helps detect faults, issues, and anomalies.
Wait for event: The calculation task configuration under instance ownership has an event listener. The instance will operate normally after the event trigger.
Waiting for upstream: The computing task under instance ownership has upstream dependency tasks in the workflow orchestration process. The current instance task will run normally only after the upstream computing task generates an instance and runs successfully.
Waiting for execution: Waiting for scheduling resource or exceeding scheduling concurrency, pending distribution to executor. The newly generated instance is in the preparation phase for execution and will enter the next stage in a short time.
Running: The instance is running and the running process can be viewed in real time through logs.
Terminating: Task instances in the status of waiting for event, waiting for upstream, awaiting execution, or running can be terminated through the terminate feature.
Retry on failure: If an instance run fails, it will execute again according to the retry-on-failure configuration in the computing task scheduling strategy.
Failure: The task instance run failed.
Success: The task instance ran successfully.
The execution status column provides diagnostic information and error code information.
Diagnostic information: provides diagnostic information, possible causes, and operation guides, convenient for users to quickly locate problems and resolve them when instance anomalies occur.
Error code: provides error code and error information. When unable to locate issues, you can copy the error code and ask platform students for operation assistance.
Instance Type
Displays the instance type according to the scheduling strategy of generated cycle instances.
Periodic instance: a computing task instance generated by periodic scheduling policy, such as task instances created by daily, weekly, monthly, hourly, or minute scheduling plans belong to periodic instances.
Non-periodic instance: a computing task instance generated by one-time execution.
Supplementary instance: a task instance generated through data replenishment.
Owner
Displays the owner of the cycle instance, clarifying the maintenance responsibility of the computing task instance, defaulting to the creator of the computing task.
Workflow Directory
Displays the name of the workflow to which the cycle instance's computing task belongs in the orchestration space, facilitating the identification and unified management of instances. Clicking on the workflow name will redirect to the respective task's workflow configuration page.
Task type
Displays the type of computing task to which the cycle instance belongs.
Planned Scheduling Time
Scheduling cycle for cycle instances.
Start Time
Execution start time for cycle instances after generation. Format: yyyy-MM-dd HH:mm:ss.
End Time
End time of the cycle instance's execution. Format: yyyy-MM-dd HH:mm:ss.
Execution Duration
Running duration from start to end time for the periodic instance.
Execution Resource Group
Execution resource group used by the cycle instance.
Retries
Periodic scheduling, replenishment, or each rerun starts counting from 0. If the number of retries exceeds the maximum and the task still fails to run successfully, it results in task failure. "Number of retry attempts on failure" can be customized in Task Scheduling Settings > Advanced Settings > Number of Retry Attempts on Failure, with a default value of 5.
Accumulative Running Times
The total of periodic scheduling, replenishment, and rerun execution times for the instance.
folder
Displays the parent folder directory of the computing task to which the cycle instance belongs in the orchestration space, facilitating the identification and unified management of computational task instances.
Cycle Type
Displays the scheduling period for the computing task to which the cycle instance belongs.
Periodic Instance Ops Operation
Feature description:
Operation
Description
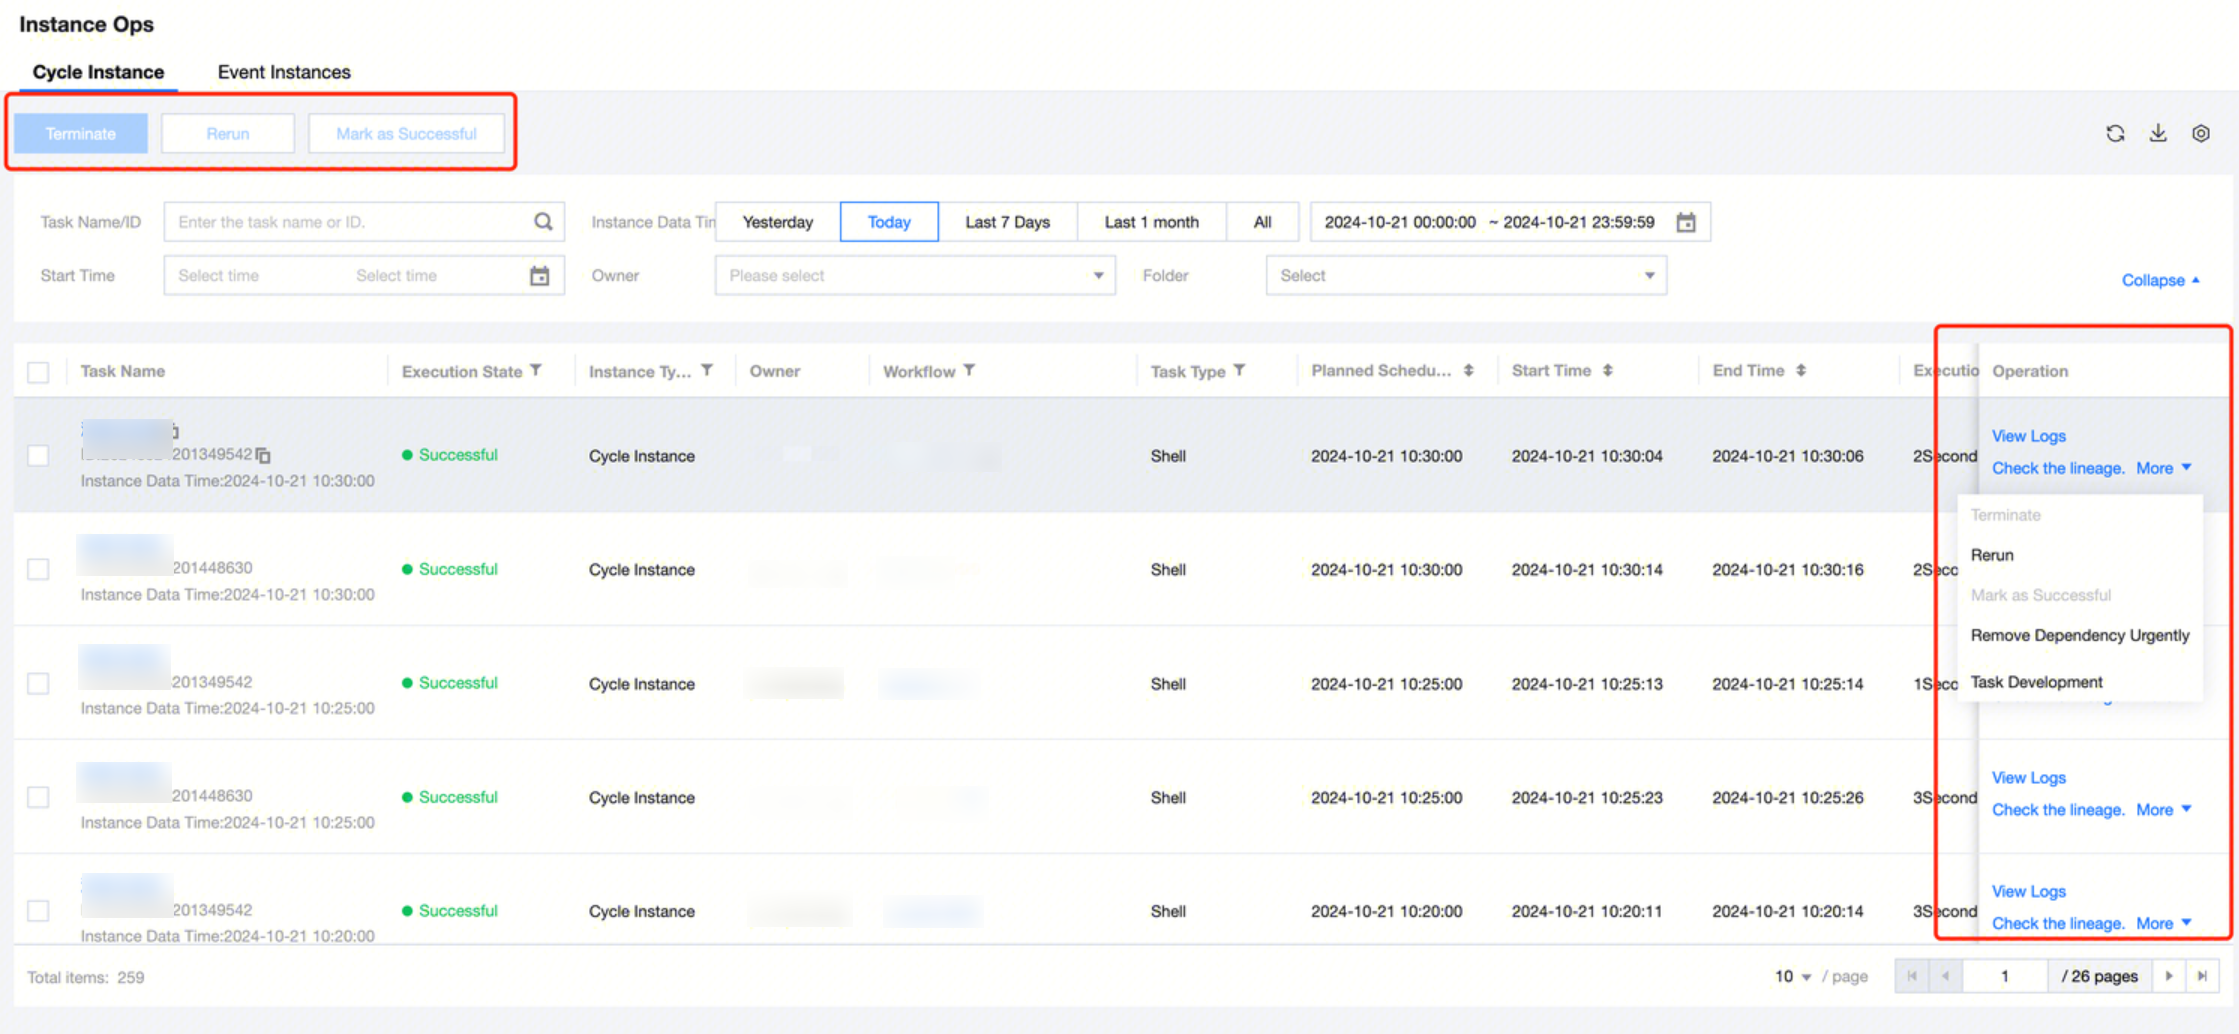
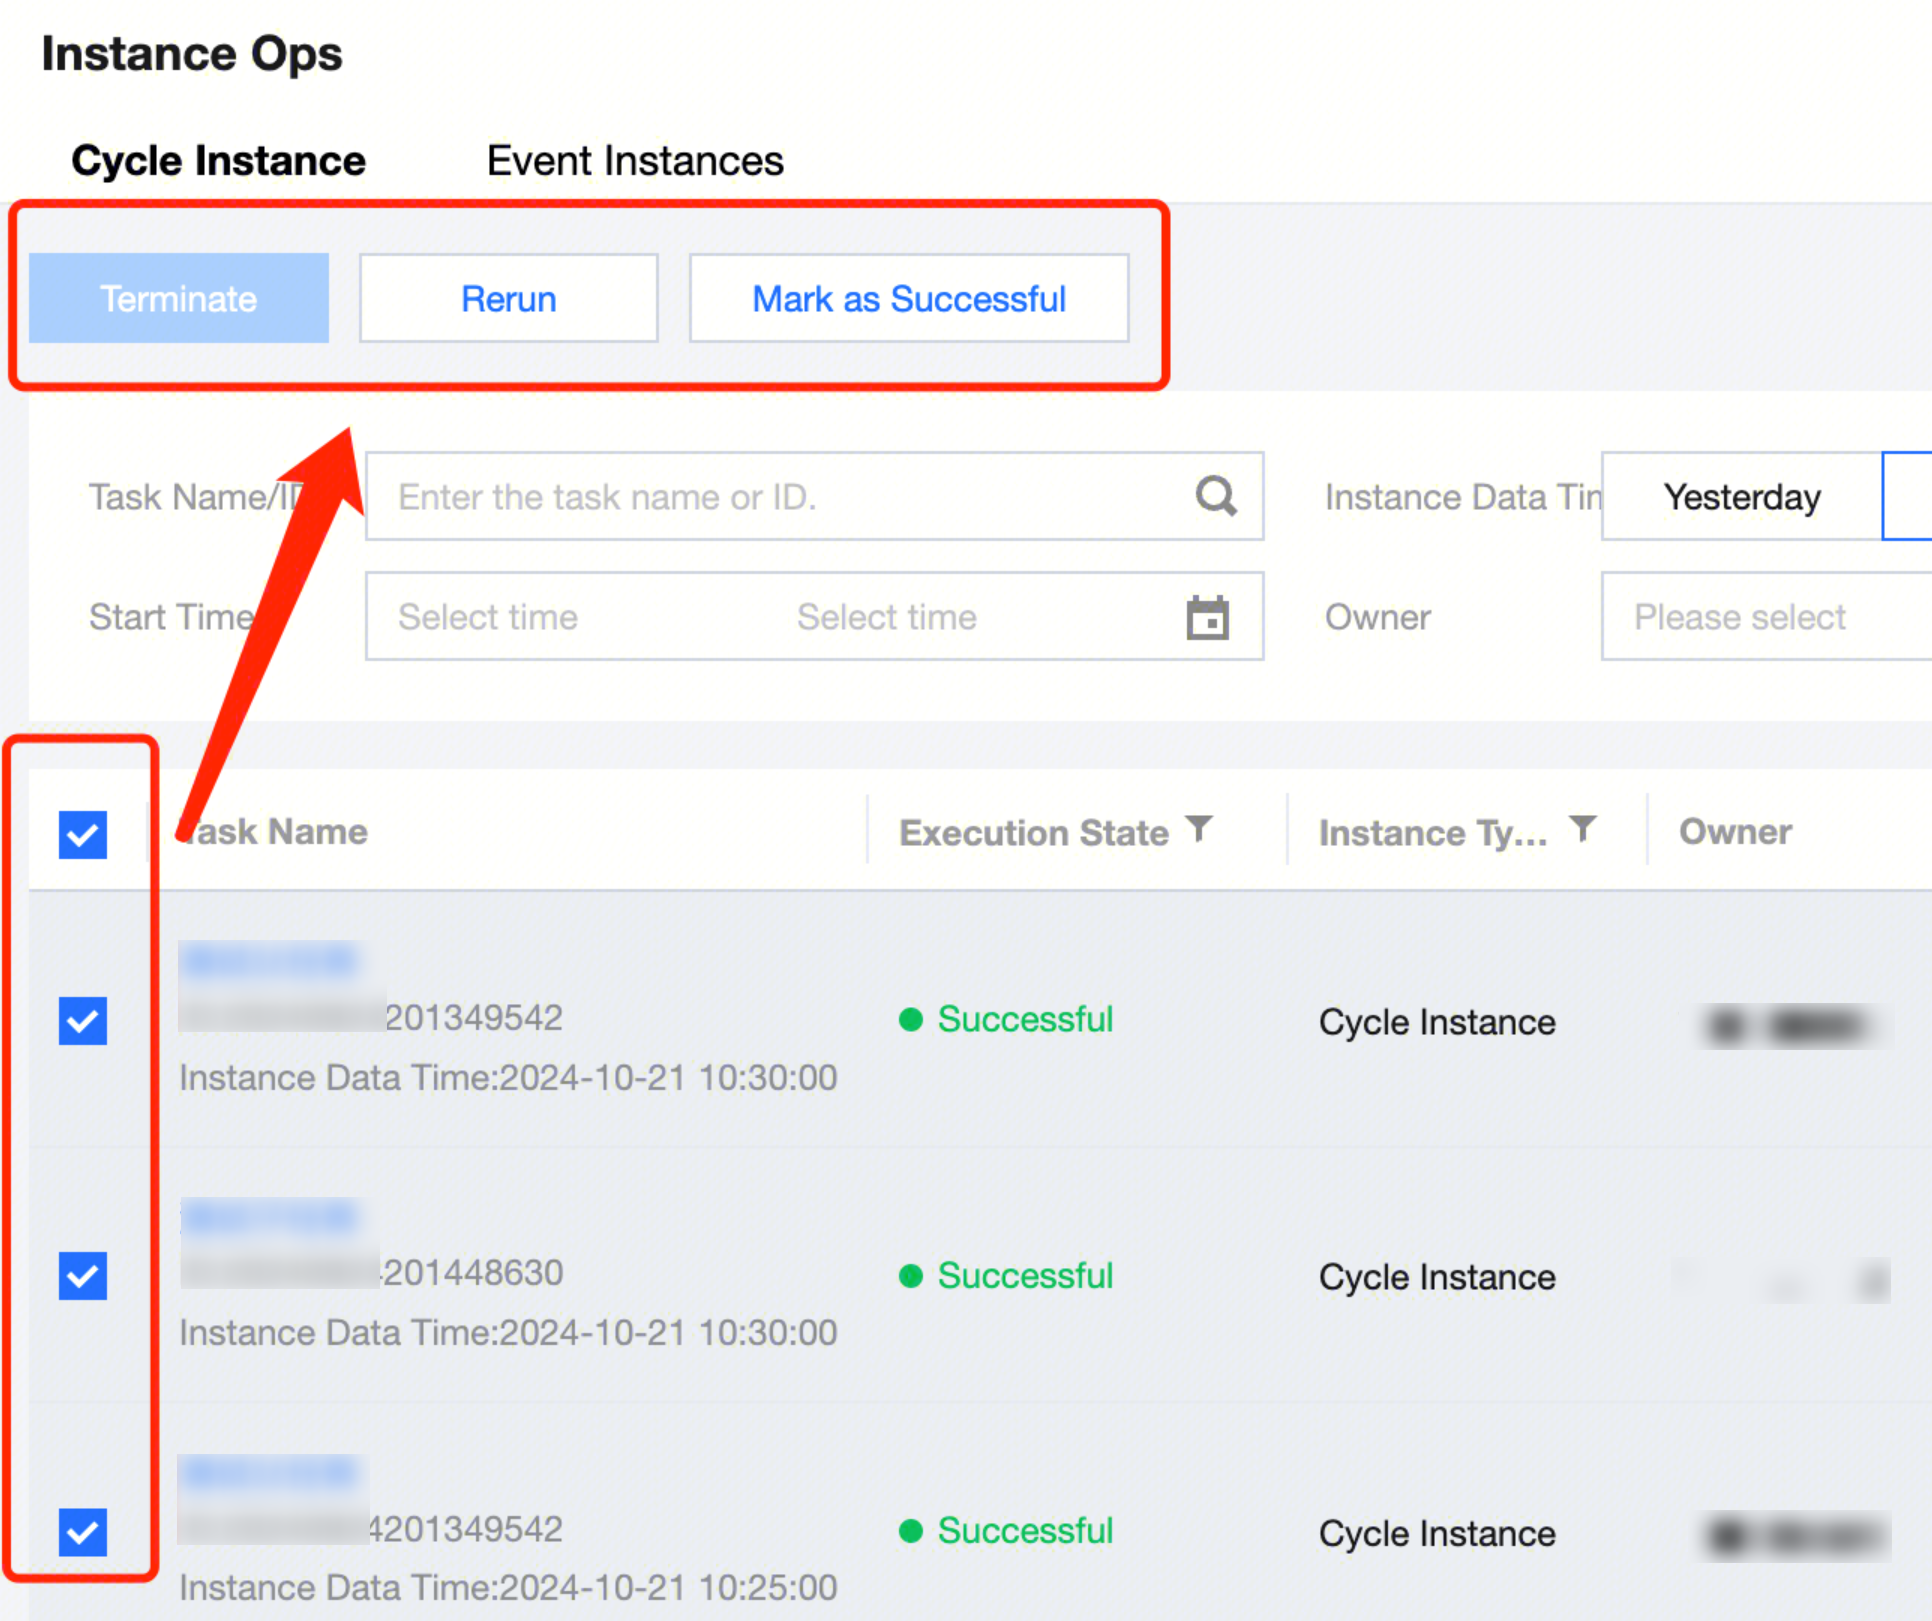
Operating in Batches
Select in front of the task name and use the feature button above to batch terminate, rerun, or set the selected cycle instance execution as successful.
Viewing Logs
Navigate to Instance Details Page > Execution Logs, view the end-to-end process of each execution after generation, including waiting events/upstream, pending execution, start time, end time, duration, specific circumstances, execution log, and execute code.
Check the lineage
Navigate to instance details page > instance lineage to view upstream and downstream relationships of the instance, and perform simple information viewing and operations by diagnosing upstream and downstream stages on the dag graph.
terminate
Effective only for cycle instance statuses "Waiting for Event," "Waiting for Upstream," "Waiting to Run," and "Running." After terminating the instance, the corresponding instance will cease running, and the execution status will be set to "Failed."
Rerun
Effective only for cycle instances with status "Failed," "Success," "Pending Execution," or "Failed Retry." After rerunning the instance, the corresponding task instance will be re-executed. Rerunning an instance may affect upstream and downstream dependencies, event listening, and other scheduling policies, so relevant configuration items need to be set when rerunning.
Scope of instances to rerun: choose from three methods.
Current instance: Rerun only the currently selected instance.
The instance and downstream instances: Rerun the currently selected instance and downstream task instances.
Downstream instances: Rerun only the downstream task instances of the currently selected instance.
Downstream instance range: If you select "The instance and downstream instances" or "Downstream instances" for the scope of instances to rerun, you can specify the downstream instance range. Includes:
Workflow location: Downstream instances in the current workflow
Project location: Downstream instances in the current project
ALL projects: ALL downstream instances
Specified instance: User self-define downstream instance range
Ignore event: When the computing task corresponding to the rerun instance is configured to listen for events, you can choose whether to ignore the event trigger condition to perform an instance rerun.
Check parent task: Check the direct upstream parent task of the selected instance, and select whether to check the instance of the previous period for the selected instance, determined by the scheduling configuration > self-dependent setting.
Advanced Parameters:
Custom Parameter: Re-specify the task's parameters to facilitate the execution of new logic by replenished instances.
Scheduling Parameters(Optional)
Default task parameters can be re-specified by users to facilitate the execution of new logic by replenished instances. The new parameters will override the earlier task parameter values.
Parameter name supports drop-down selection config. After selecting the parameter name, the parameter value will be automatically filled and can be modified as required.
Application Parameter
For Spark SQL and PySpark tasks, support re-specifying application parameter values.
Mark as Successful
Effective only for cycle instance statuses "Running," "Failed," "Waiting for Event," "Waiting for Upstream," and "Waiting to Run." After setting the instance to success, the execution status of the corresponding task instance will be set to "Successful."
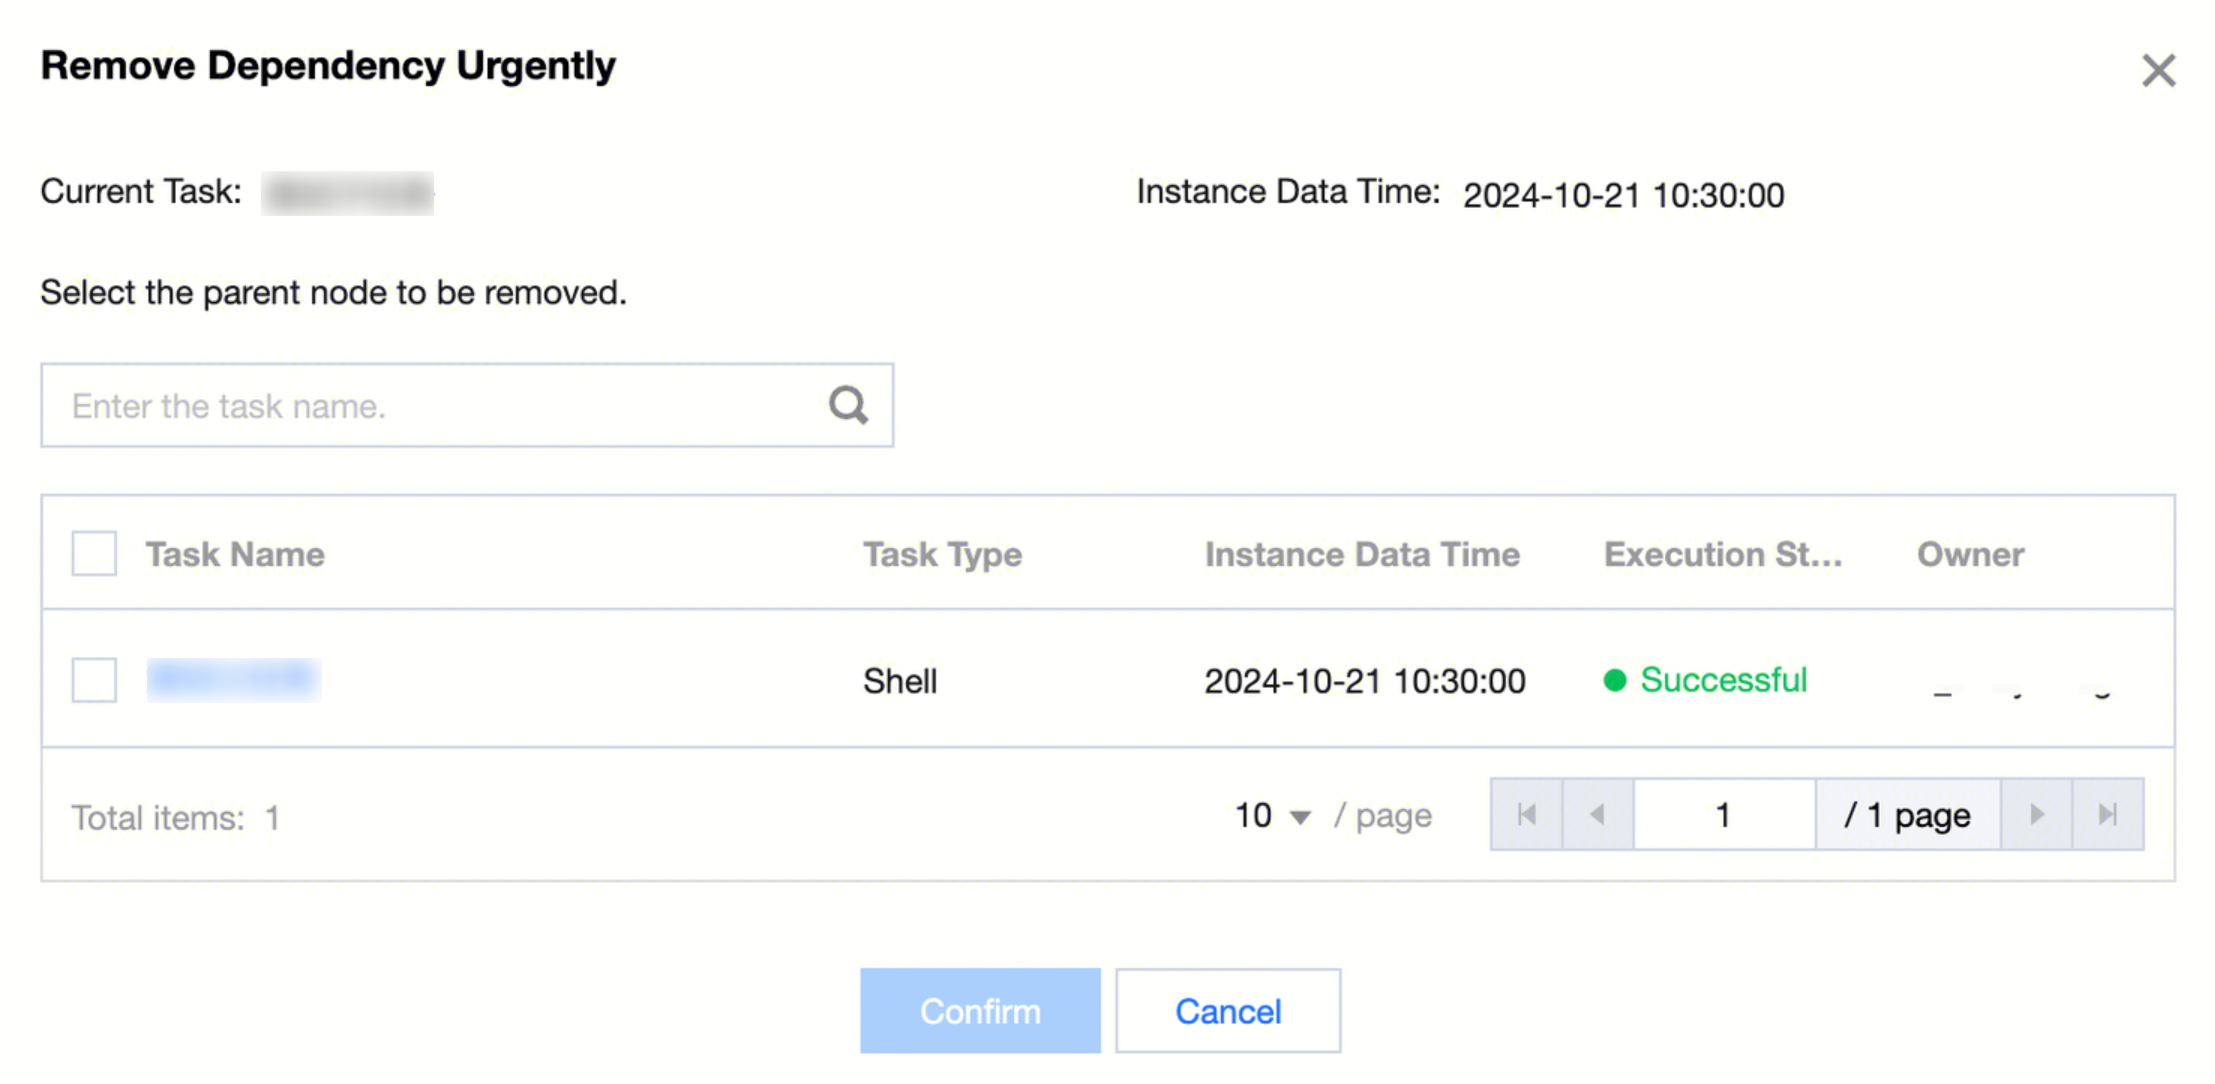
Remove Dependency Urgently
This operation removes the dependency relationship of the instance. In urgent scenarios where the upstream instance does not reach a successful status and affects downstream instance execution, users can manually judge if the upstream instance has minimal impact on the current instance and perform the emergency dependency removal. It removes the dependency between the corresponding upstream and current instance, ensuring the current instance can execute normally.
This operation takes effect only on the current instance and does not affect the dependency relationship of the previous or subsequent instances.
This operation is irreversible. Subsequently, rerun and supplementary entry operations for the instance will no longer check removed dependencies.
Remove dependencies on demand.
Removed dependencies will still show on the instance dag graph with a special marking so that users can distinguish them.
Task Development
Navigate to the compute node configuration interface of the corresponding cycle instance in the orchestration space. This is a quick access channel for instance operation and maintenance to the compute task node editing.
Periodic Instance Filter & List Operations
Operation
Description
Filter option - Above the list
Support filtering by Task Name/ID, Instance Data Time, Start Time, Responsible Person, and Folder.
Filter item - In the list
Support filtering by execution status, instance type, associated workflow, task type, execution resource group, and cycle type.
List Operations
Refresh: You can refresh the latest status of the cycle instance list. It is generally used to check the instance running status after operating on cycle instances, helping users easily obtain the latest operation and maintenance information.
Download: Download the data of existing instances. Currently only support downloading instances generated before 00:00 in the download list.
List configuration: supports adjusting the current list display fields and field order.
Cycle Instance Details Page
The instance details page collects all execution history, operating status, instance lineage, operation records, etc., as well as basic operations of the instance. It helps users view and manage the operations instance.
Tab Page
Description
Execution Logs
View the end-to-end process of each execution after instance generation, including waiting events/upstream, pending execution, start time, end time, duration, specific circumstances, execution log, and execute code.
Execution list: The right side shows the record list of each execution, including the first execution or retry of periodic scheduling, rerun, or backfill.
Execution information: For each execution, you can view the basic situation of three phases: waiting events/upstream, pending execution, and task running.
Waiting events/upstream: Show the upstream instance/event list and status to quickly identify blocking instances/events.
Pending execution: Waiting for distribution to the executor.
Task running: The task has been delivered to the executor and started execution. You can check the execution log and execute code.
The execution information of the For-each section displays the traversal list. Click the traversal to view the DAG of the corresponding instance. In the instance DAG, right-click the node > view logs to enter the child node instance and check its operating status and logs.
The sub-node instance details page displays the run code and execution log.
Instance lineage
View the upstream and downstream relationships between the current compute task instance and other compute task instances within its workflow. It also displays the running status and detailed information of each compute node, with different colors indicating the instance's running status.
Graph Mode: View instance lineage through graph mode, which can be expanded layer by layer. Basic instance operations are supported.
List Mode: View instance lineage in list mode, and select to view upstream or downstream.
Operation Record
View the operation records of an instance, including the operator, operation time, and other information such as marking as successful, termination, and rerun.
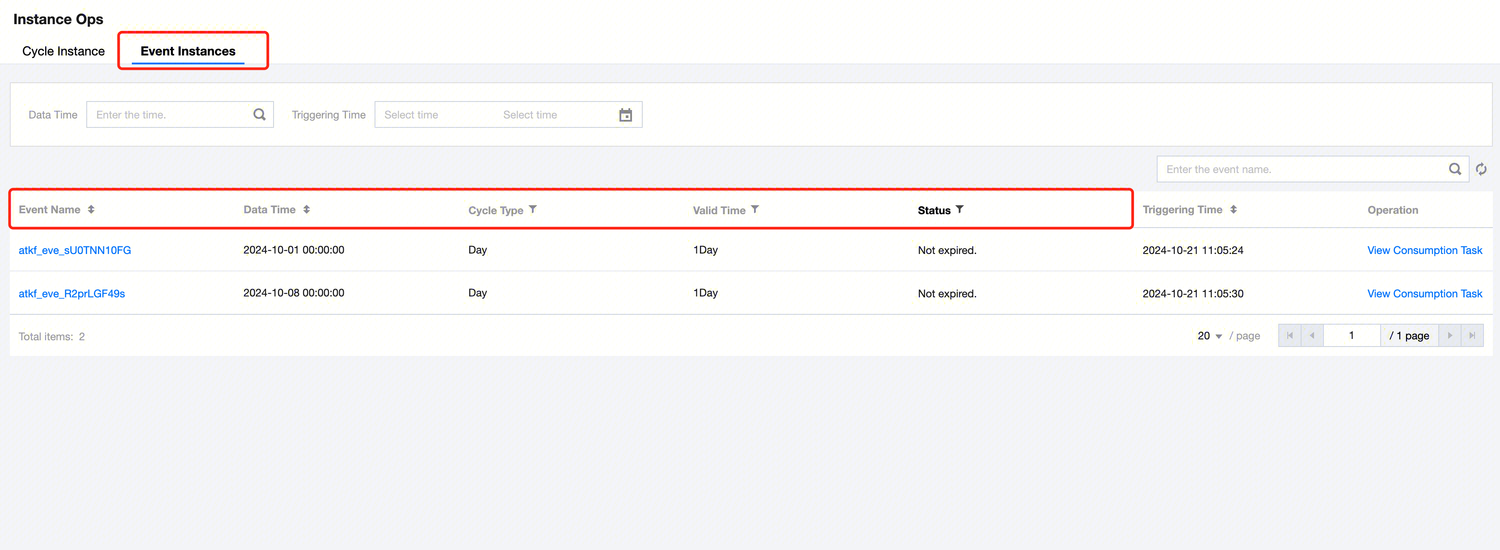
Event Instances List
The event instance webpage shows event instance information and operational features in a list format, generated after computing tasks trigger listening for events through scheduling policy configuration. You can view the event's consumption status, trigger time, consumption time, etc., as well as instance details and consumption tasks.
Event Instances List Information
Feature description:
Information
Description
Event Name
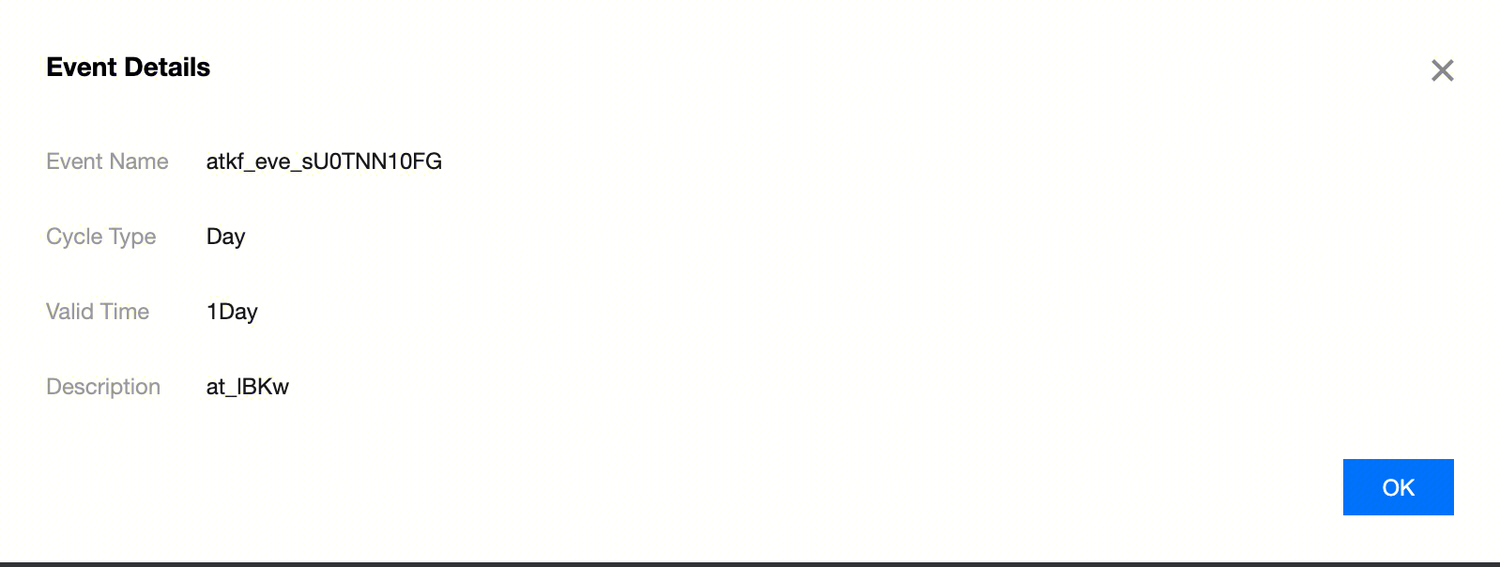
Display the event name of the triggered event instance. Click Event Name to view detailed information of the corresponding event listener, including period type, time format, validity time, and description.
Data Time
Display the planned scheduling time of the task instance that triggered the event.
Cycle Type
Display the trigger cycle type of the event instance, including day, hour, minute, second.
Validity time
Display the event waiting time preset in the scheduling configuration of the calculation task that triggers the event instance. If the event is not triggered longer than this time, the task instance will automatically terminate.
Status
Display the consumption status of the event instance, including to be consumed, consuming, consumed, and expired.
Trigger time
Display the date and time of the trigger event.
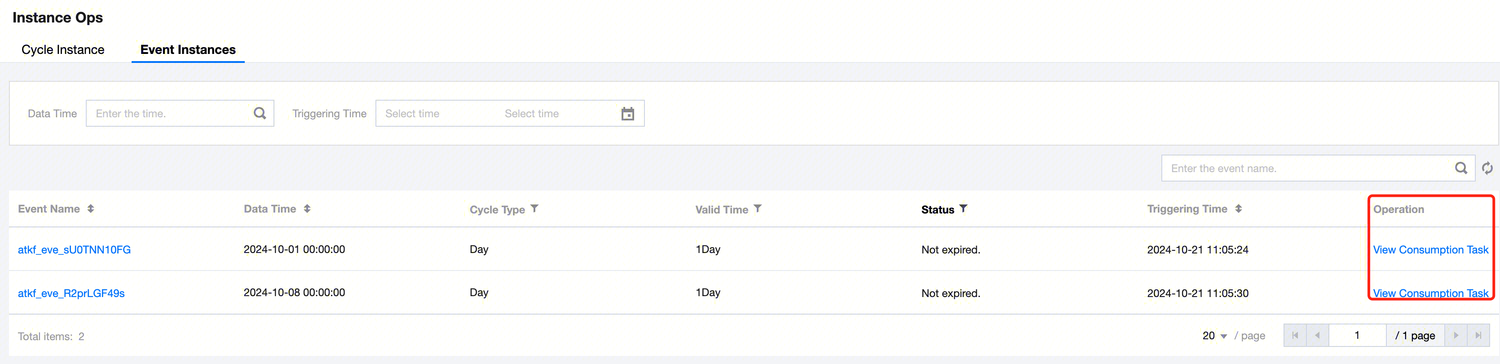
Event Instances Operations
Operation
Description
View consumption task
Click View consumption task under the event instance list to check the computing task info triggered by the event instance.
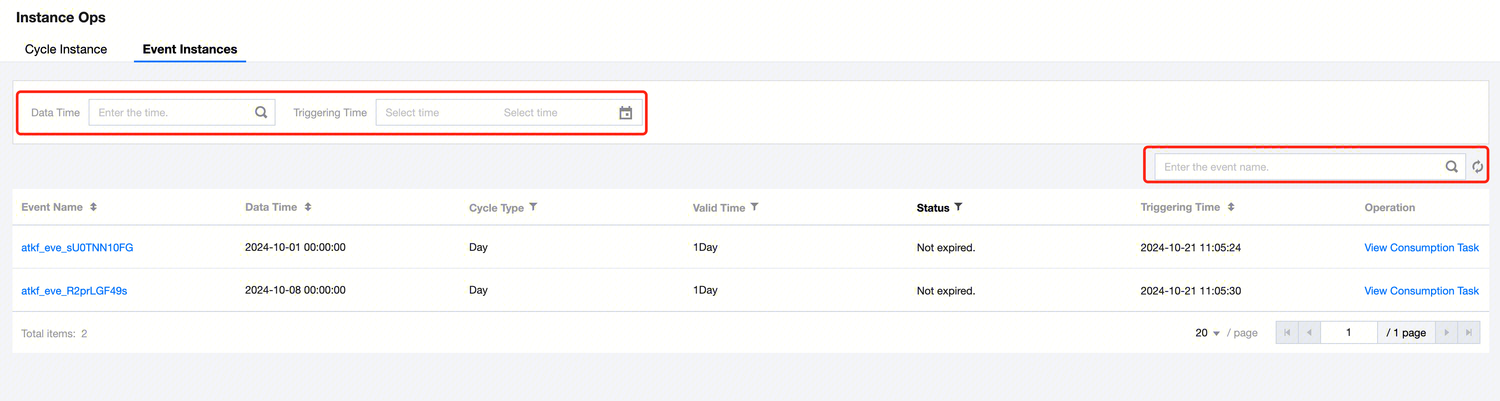
Event Instances Filter
Operation
Description
Filter option - Above the list
Support filtering by data time, trigger time, and event name.
Filter item - In the list
Support filtering by cycle type, validity time, and status.