tencent cloud

Tencent Cloud Observability Platform

Release Notes and Announcements
Release Notes
Product Introduction
Overview
Strengths
Basic Features
Basic Concepts
Use Cases
Use Limits
Purchase Guide
Tencent Cloud Product Monitoring
Application Performance Management
Mobile App Performance Monitoring
Real User Monitoring
Cloud Automated Testing
Prometheus Monitoring
Grafana
EventBridge
PTS
Quick Start
Monitoring Overview
Instance Group
Tencent Cloud Product Monitoring
Application Performance Management
Real User Monitoring
Cloud Automated Testing
Performance Testing Service
Prometheus Getting Started
Grafana
Dashboard Creation
EventBridge
Alarm Service
Cloud Product Monitoring
Tencent Cloud Service Metrics
Operation Guide
CVM Agents
Cloud Product Monitoring Integration with Grafana
Troubleshooting
Practical Tutorial
Application Performance Management
Product Introduction
Access Guide
Operation Guide
Practical Tutorial
Parameter Information
FAQs
Mobile App Performance Monitoring
Overview
Operation Guide
Access Guide
Practical Tutorial
Tencent Cloud Real User Monitoring
Product Introduction
Operation Guide
Connection Guide
FAQs
Cloud Automated Testing
Product Introduction
Operation Guide
FAQs
Performance Testing Service
Overview
Operation Guide
Practice Tutorial
JavaScript API List
FAQs
Prometheus Monitoring
Product Introduction
Access Guide
Operation Guide
Practical Tutorial
Terraform
FAQs
Grafana
Product Introduction
Operation Guide
Guide on Grafana Common Features
FAQs
Dashboard
Overview
Operation Guide
Alarm Management
Console Operation Guide
Troubleshooting
FAQs
EventBridge
Product Introduction
Operation Guide
Practical Tutorial
FAQs
Report Management
FAQs
General
Alarm Service
Concepts
Monitoring Charts
CVM Agents
Dynamic Alarm Threshold
CM Connection to Grafana
Documentation Guide
Related Agreements
Application Performance Management Service Level Agreement
APM Privacy Policy
APM Data Processing And Security Agreement
RUM Service Level Agreement
Mobile Performance Monitoring Service Level Agreement
Cloud Automated Testing Service Level Agreement
Prometheus Service Level Agreement
TCMG Service Level Agreements
PTS Service Level Agreement
PTS Use Limits
Cloud Monitor Service Level Agreement
API Documentation
History
Introduction
API Category
Making API Requests
Monitoring Data Query APIs
Alarm APIs
Legacy Alert APIs
Notification Template APIs
TMP APIs
Grafana Service APIs
Event Center APIs
TencentCloud Managed Service for Prometheus APIs
Monitoring APIs
Data Types
Error Codes
Glossary

Basic Features

PDF
フォーカスモード
フォントサイズ
最終更新日: 2025-03-18 15:38:30
After purchasing and using Tencent Cloud services supported by Tencent Cloud Observability Platform (TCOP), you can log in to the Tencent Cloud Observability Platform console to view service running status and metrics, and configure alarm rules for monitoring items.

Tencent Cloud services monitoring

TCOP offers free monitoring of resources on Tencent Cloud.
TCOP can automatically and accurately collect basic monitoring metrics and store monitoring data in real time.
Tencent Cloud Observability Platform and Dashboard allow you to create custom charts to view metric data and configure alarms. You can also pull metric data through APIs for further use and analysis.
Most monitoring metrics can be collected and displayed automatically, eliminating the need for manual configuration. Some cloud services require you to install and run agent to collect monitoring data, such as CVM and CPM. You can choose automatic installation when purchasing resources for these Tencent Cloud services.

Alarm Services

TCOP provides prompt and personalized alarm services.
Based on existing monitoring data, you can configure alarms for cloud resources and custom metrics using default or custom configurations.
You can configure different alarm policies (such as event alarms, failure alarms, and threshold alarms) for resources in different OPS scenarios.
You can configure different alarm frequencies and logics to distinguish alarms at various levels. You can configure mobile number, emails, and callback URLs to receive alarms promptly in multiple channels.

Multi-Dimensional Charts

TCOP allows you to view existing monitoring data in custom charts.
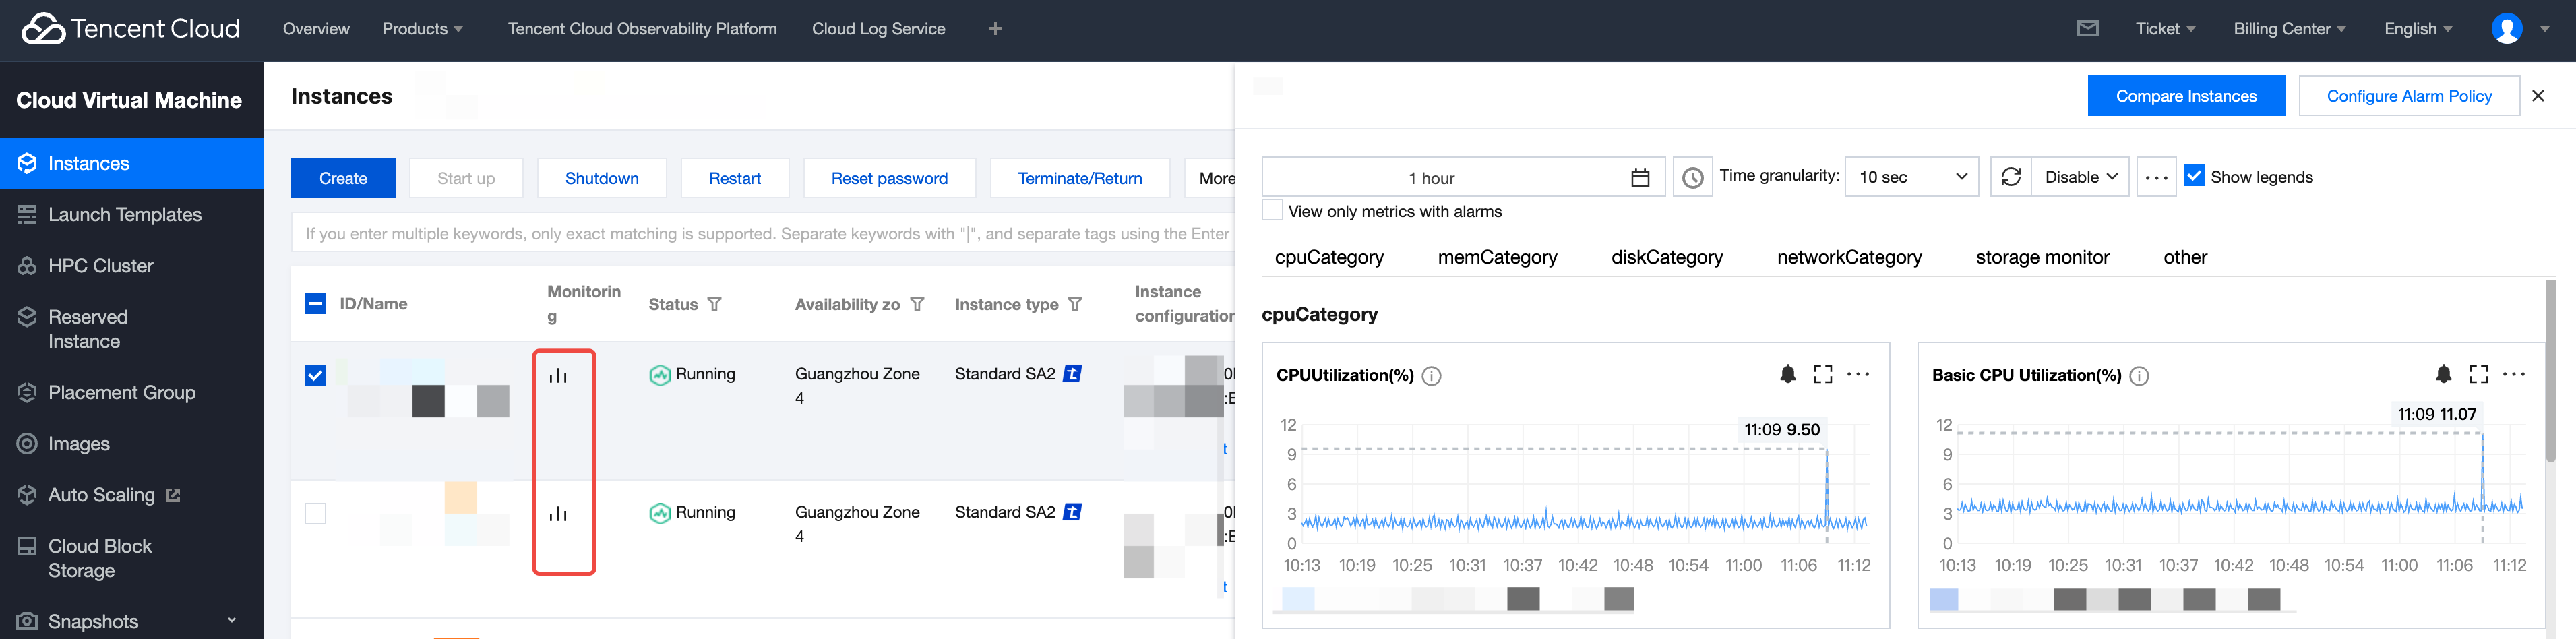
1. Users can conveniently view the monitoring data of each cloud service in the monitoring floating window of the console of purchased cloud products (taking Cloud Virtual Machine (CVM) as an example, as shown below), and the latest data is displayed in the graph by default.

2. On Dashboard, you can subscribe to key metrics, customize metric displays and calculation rules, sort and compare them in lists and charts, troubleshoot and analyze exceptions.
3. You can view the monitoring data and alarm information of all cloud services under your account in the Tencent Cloud Observability Platform console.

ヘルプとサポート

この記事はお役に立ちましたか?

フィードバック