tencent cloud

Tencent Cloud Observability Platform

Release Notes and Announcements
Release Notes
Product Introduction
Overview
Strengths
Basic Features
Basic Concepts
Use Cases
Use Limits
Purchase Guide
Tencent Cloud Product Monitoring
Application Performance Management
Mobile App Performance Monitoring
Real User Monitoring
Cloud Automated Testing
Prometheus Monitoring
Grafana
EventBridge
PTS
Quick Start
Monitoring Overview
Instance Group
Tencent Cloud Product Monitoring
Application Performance Management
Real User Monitoring
Cloud Automated Testing
Performance Testing Service
Prometheus Getting Started
Grafana
Dashboard Creation
EventBridge
Alarm Service
Cloud Product Monitoring
Tencent Cloud Service Metrics
Operation Guide
CVM Agents
Cloud Product Monitoring Integration with Grafana
Troubleshooting
Practical Tutorial
Application Performance Management
Product Introduction
Access Guide
Operation Guide
Practical Tutorial
Parameter Information
FAQs
Mobile App Performance Monitoring
Overview
Operation Guide
Access Guide
Practical Tutorial
Tencent Cloud Real User Monitoring
Product Introduction
Operation Guide
Connection Guide
FAQs
Cloud Automated Testing
Product Introduction
Operation Guide
FAQs
Performance Testing Service
Overview
Operation Guide
Practice Tutorial
JavaScript API List
FAQs
Prometheus Monitoring
Product Introduction
Access Guide
Operation Guide
Practical Tutorial
Terraform
FAQs
Grafana
Product Introduction
Operation Guide
Guide on Grafana Common Features
FAQs
Dashboard
Overview
Operation Guide
Alarm Management
Console Operation Guide
Troubleshooting
FAQs
EventBridge
Product Introduction
Operation Guide
Practical Tutorial
FAQs
Report Management
FAQs
General
Alarm Service
Concepts
Monitoring Charts
CVM Agents
Dynamic Alarm Threshold
CM Connection to Grafana
Documentation Guide
Related Agreements
Application Performance Management Service Level Agreement
APM Privacy Policy
APM Data Processing And Security Agreement
RUM Service Level Agreement
Mobile Performance Monitoring Service Level Agreement
Cloud Automated Testing Service Level Agreement
Prometheus Service Level Agreement
TCMG Service Level Agreements
PTS Service Level Agreement
PTS Use Limits
Cloud Monitor Service Level Agreement
API Documentation
History
Introduction
API Category
Making API Requests
Monitoring Data Query APIs
Alarm APIs
Legacy Alert APIs
Notification Template APIs
TMP APIs
Grafana Service APIs
Event Center APIs
TencentCloud Managed Service for Prometheus APIs
Monitoring APIs
Data Types
Error Codes
Glossary

Template Variables

PDF
フォーカスモード
フォントサイズ
最終更新日: 2024-01-27 17:45:42
This document describes how to configure and use template variables.

Configuring a template variable

1. Log in to the TCOP console.
2. On the left sidebar, click Dashboard List to enter the dashboard list page.
3. In the top-left corner of the dashboard list, click Create to enter the dashboard creation page.
4. Click

** or click Set on the dashboard list page to enter the global dashboard configuration page.
5. Click Template Variable. You can customize dashboard filters and use template variables on the dashboard management page as instructed in Using a template variable. Currently, you can filter by tags of CVM - basic monitoring, storage monitoring, and TencentDB for MySQL source/replica server monitoring.
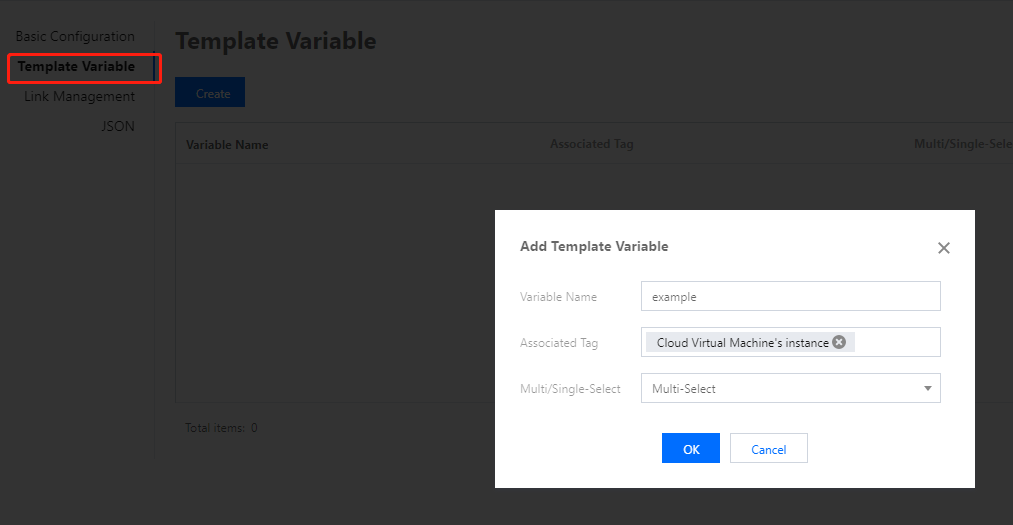
6. Click Create on the dashboard management page, configure parameters, and click OK to create a template variable.


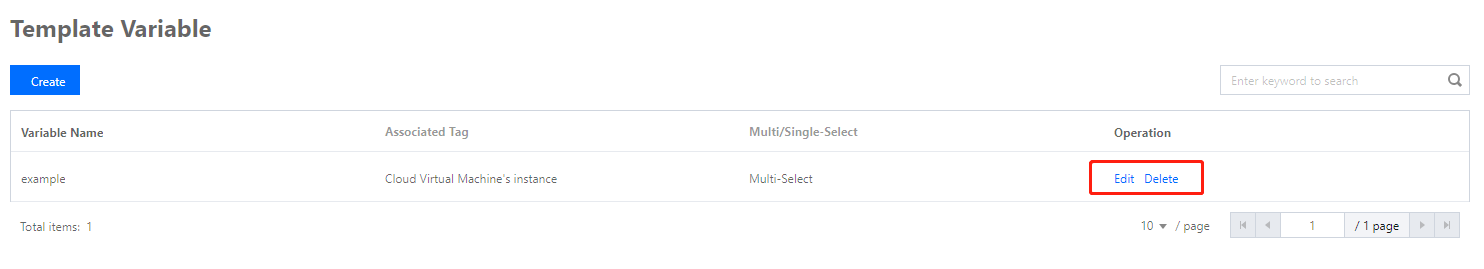
Editing or deleting a template variable

You can delete and edit template variables in the template variable list.


Using a template variable

1. Log in to the TCOP console.
2. On the left sidebar, click Dashboard List to enter the dashboard list page.
3. Find the target dashboard and click its name.
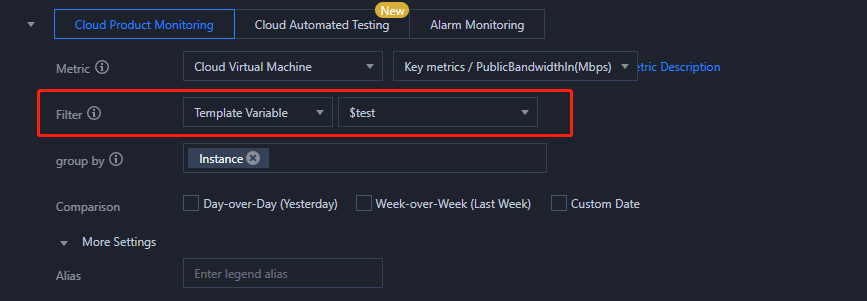
4. After creating a template variable, you can use it as a quick selector of dashboards and monitoring charts.
4.1 Select the template variable and corresponding template in the Create Monitoring Chart or Edit Monitoring Chart column.


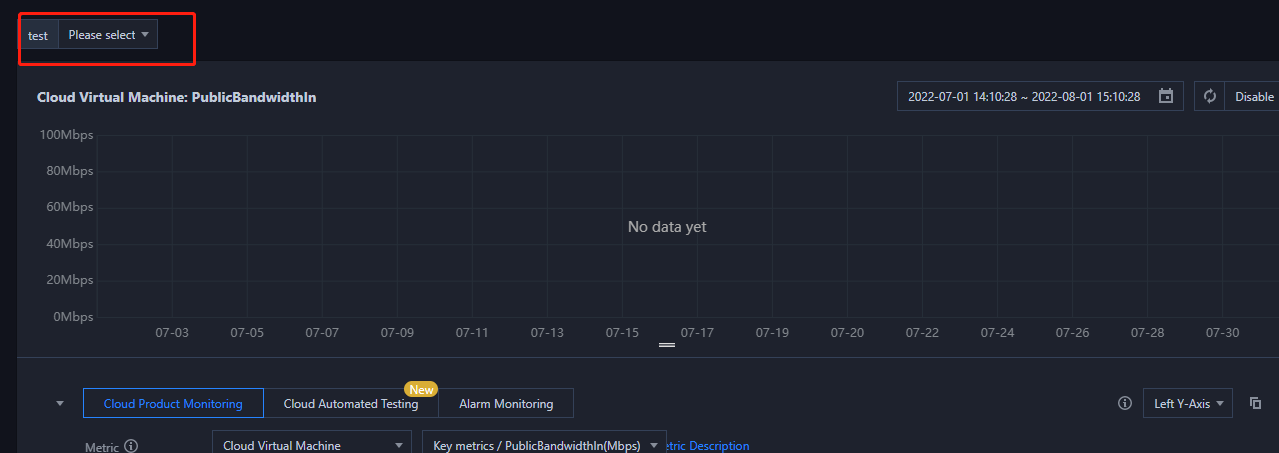
4.2 After successfully binding the template variable, you can use the instance filter in the dashboard for the chart to quickly filter instances. The chart bound to the template variable can be linked with the instance filter for you to quickly filter instances and view the instance monitoring data under the product type.


ヘルプとサポート

この記事はお役に立ちましたか?

フィードバック