tencent cloud

Tencent Cloud Observability Platform

Release Notes and Announcements
Release Notes
Product Introduction
Overview
Strengths
Basic Features
Basic Concepts
Use Cases
Use Limits
Purchase Guide
Tencent Cloud Product Monitoring
Application Performance Management
Mobile App Performance Monitoring
Real User Monitoring
Cloud Automated Testing
Prometheus Monitoring
Grafana
EventBridge
PTS
Quick Start
Monitoring Overview
Instance Group
Tencent Cloud Product Monitoring
Application Performance Management
Real User Monitoring
Cloud Automated Testing
Performance Testing Service
Prometheus Getting Started
Grafana
Dashboard Creation
EventBridge
Alarm Service
Cloud Product Monitoring
Tencent Cloud Service Metrics
Operation Guide
CVM Agents
Cloud Product Monitoring Integration with Grafana
Troubleshooting
Practical Tutorial
Application Performance Management
Product Introduction
Access Guide
Operation Guide
Practical Tutorial
Parameter Information
FAQs
Mobile App Performance Monitoring
Overview
Operation Guide
Access Guide
Practical Tutorial
Tencent Cloud Real User Monitoring
Product Introduction
Operation Guide
Connection Guide
FAQs
Cloud Automated Testing
Product Introduction
Operation Guide
FAQs
Performance Testing Service
Overview
Operation Guide
Practice Tutorial
JavaScript API List
FAQs
Prometheus Monitoring
Product Introduction
Access Guide
Operation Guide
Practical Tutorial
Terraform
FAQs
Grafana
Product Introduction
Operation Guide
Guide on Grafana Common Features
FAQs
Dashboard
Overview
Operation Guide
Alarm Management
Console Operation Guide
Troubleshooting
FAQs
EventBridge
Product Introduction
Operation Guide
Practical Tutorial
FAQs
Report Management
FAQs
General
Alarm Service
Concepts
Monitoring Charts
CVM Agents
Dynamic Alarm Threshold
CM Connection to Grafana
Documentation Guide
Related Agreements
Application Performance Management Service Level Agreement
APM Privacy Policy
APM Data Processing And Security Agreement
RUM Service Level Agreement
Mobile Performance Monitoring Service Level Agreement
Cloud Automated Testing Service Level Agreement
Prometheus Service Level Agreement
TCMG Service Level Agreements
PTS Service Level Agreement
PTS Use Limits
Cloud Monitor Service Level Agreement
API Documentation
History
Introduction
API Category
Making API Requests
Monitoring Data Query APIs
Alarm APIs
Legacy Alert APIs
Notification Template APIs
TMP APIs
Grafana Service APIs
Event Center APIs
TencentCloud Managed Service for Prometheus APIs
Monitoring APIs
Data Types
Error Codes
Glossary

Creating Alarm Monitoring Charts

PDF
フォーカスモード
フォントサイズ
最終更新日: 2024-01-27 17:45:42
This document describes how to create an alarm monitoring chart to track the number of alarms triggered for Tencent Cloud products, custom cloud monitor, or Prometheus service.

Directions

1. Log in to the Tencent Cloud Observability Platform console and go to the Default Dashboard.
2. Select the target dashboard.
3. Click

> Create Chart to go to the chart editing page, and configure the information as described below.
Monitor Type: select Alarm Monitoring
Filter: select Cloud Product Monitoring, Custom Tencent Cloud Observability Platform, or Prometheus service
Cloud Product Monitoring: if you select Cloud Product Monitoring, you need to specify the Tencent Cloud products you want to monitor. The system will track the number of alarms by product.
Custom Tencent Cloud Observability Platform: if you select Custom Tencent Cloud Observability Platform, you need to specify the namespaces you want to monitor. The system will track the number of alarms by namespace.
Prometheus service: if you select Prometheus service, the chart will display the number of alarms for all instances. Filter by instance is not supported currently.
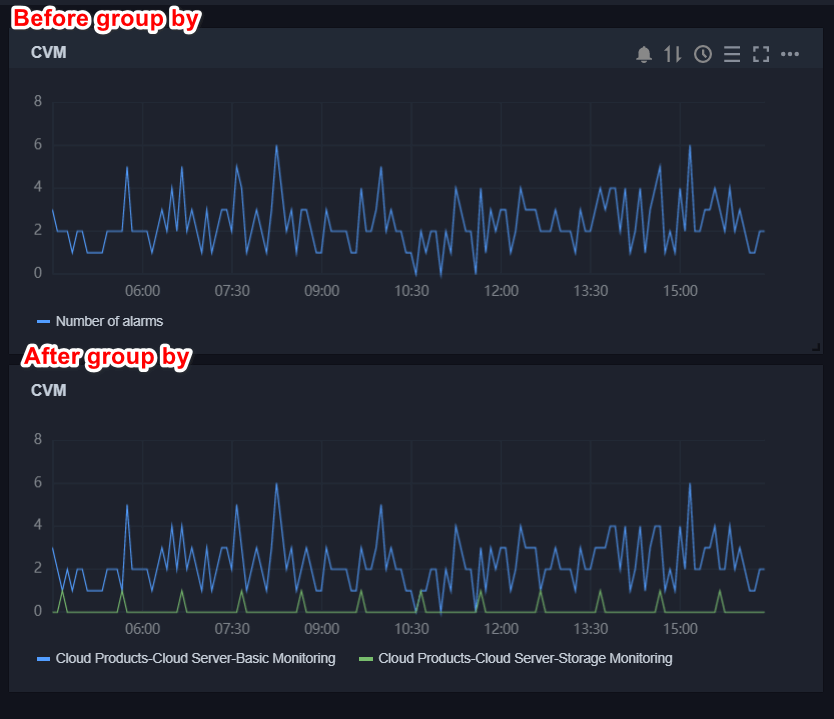
Group by: is similar to the Group by statement in SQL. It groups Tencent Cloud products or namespaces and merges them by the method specified, as shown below.


Merge by: specifies the way multiple curves are merged into one. If Group by is not empty, curves in the same group will be merged into one.
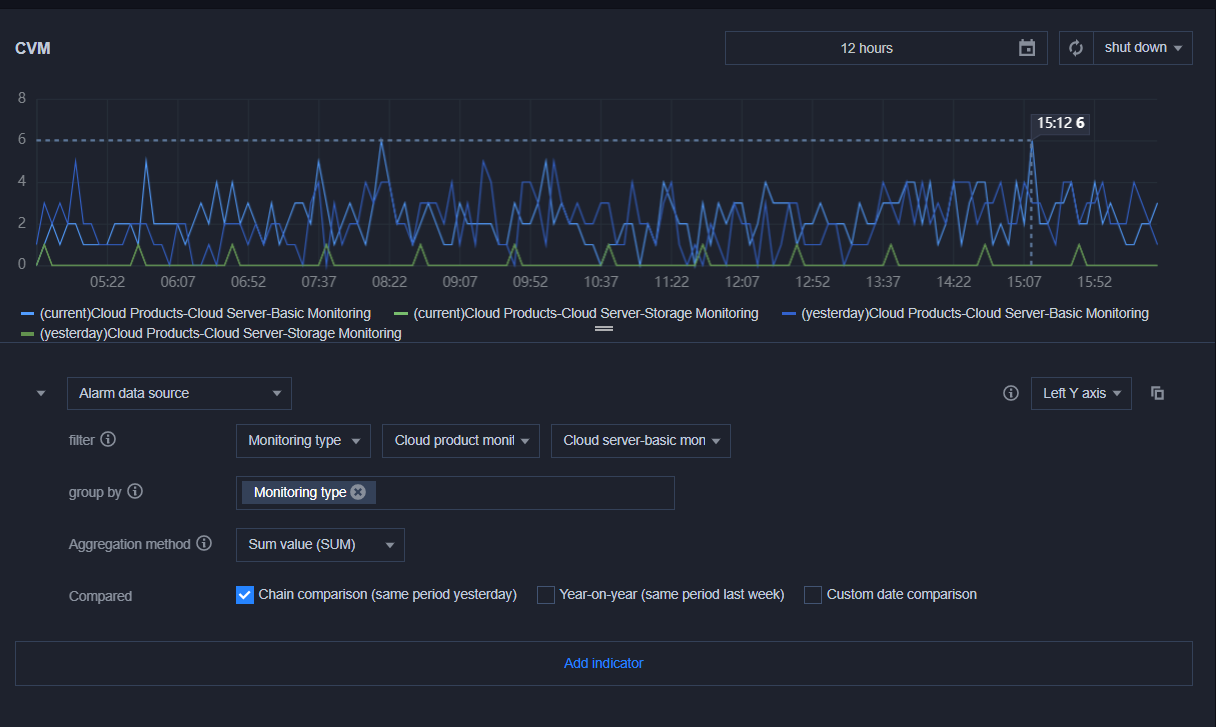
VS: supports day-on-day (compare with the same period yesterday), week-on-week (compare with the same period last week), as well as custom time comparisons. If you select all of them, the chart will display the curves for the same period yesterday and last week so that you can compare them with the statistics of the day.


4. After completing the above configuration, click Save.
Note:
To learn about different chart configurations, see Use Cases of Different Chart Types.

ヘルプとサポート

この記事はお役に立ちましたか?

フィードバック