Analyze startup metrics by using Startup Duration and Slow Startup Proportion. You can locate and analyze the root causes of slow app startups through the Slow Startup Issue List.
2. In the left sidebar, select Startup, and choose the business system, application, and time range you want to analyze for startup issues.
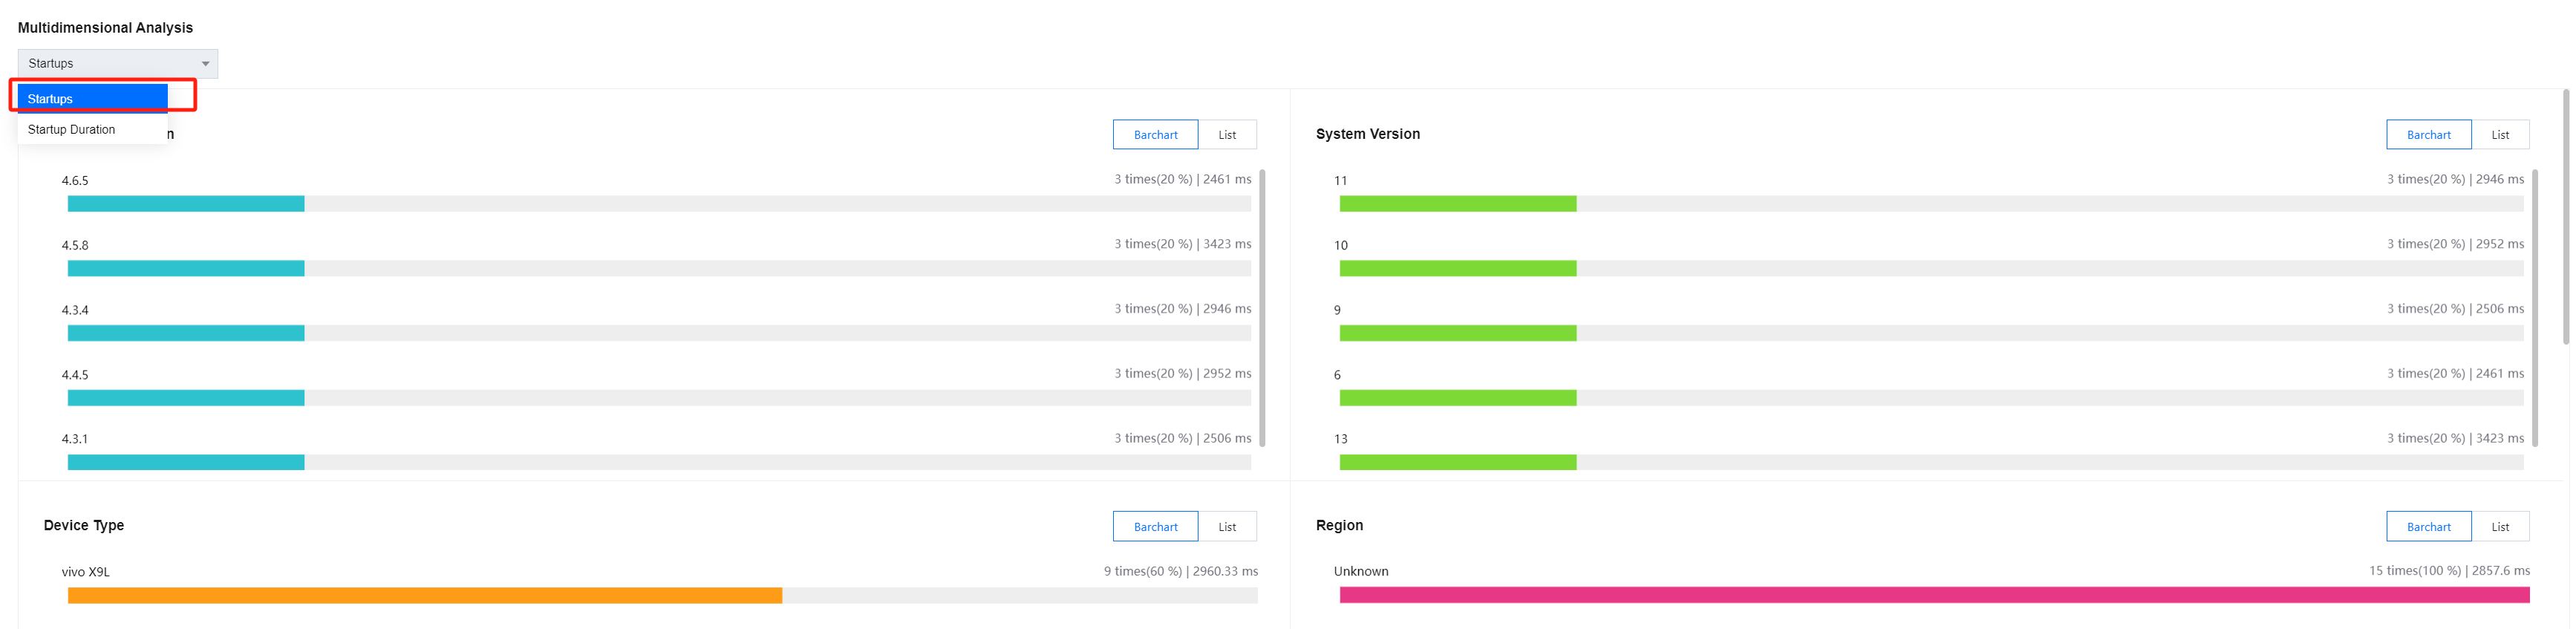
Multidimensional Analysis
Multidimensional analysis, based on application version, system version, device type, region, ISP, and other dimensions, facilitates targeted analysis of the root causes of observed slow startup.
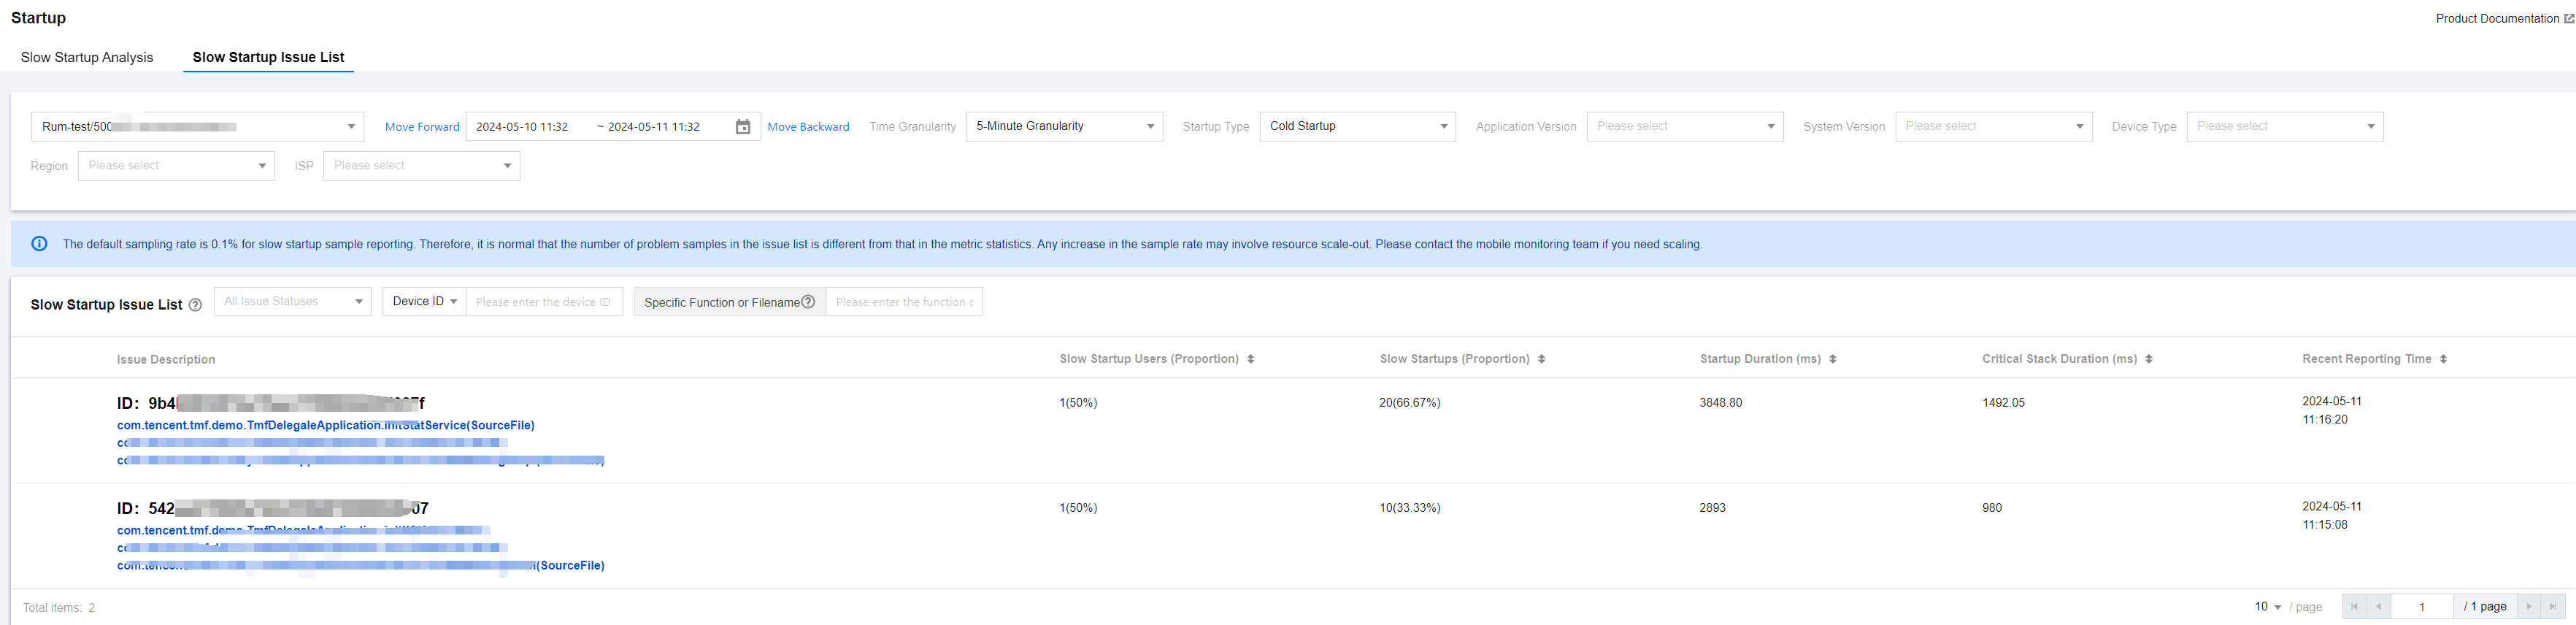
Slow Startup Issue List
The slow startup issue list displays slow startup issues for all devices. You can quickly filter for relevant slow startup devices based on issue exception type, problem device ID, specific function, or file name. You can also click Issue Description to view details of the slow startup issue and analyze the root cause of the app's slow startup.
For each application cold/first startup sample, the startup of an Android system with a duration greater than 2,500 ms is considered a slow startup, and the startup of an iOS system with a duration greater than 4,000 ms is considered a slow startup. For each warm startup sample, the startup of an Android system with a duration greater than 1,000 ms is considered a slow startup, and the startup of an iOS system with a startup duration greater than 2,000 ms is considered a slow startup. Only slow startup samples are displayed in the issue list.
Descriptions
Related metrics descriptions are as follows:
Metric Name
Descriptions
Startups
Application startups.
Startup Duration
Time consumed by the application startup.
Average Duration
The sum of an online sample startup duration/application startups.
Slow Startups (Proportion)
Slow startups/total startups.
For an Android terminal, a startup exceeding 2.5 s is, by default, defined as a slow startup.
For an iOS terminal, a startup exceeding 4s is, by default, defined as a slow startup, with the threshold being customizable.
Initial Startup
The first startup of the app after installation, considered as a special case of cold startup.
Cold Startup
The process of restarting the app after the app process ended, or running at the backend and the process has been reclaimed by the system.
Warm Startup
The process of awakening the app after it has been in the backend for 3 minutes or switching back from another app's interface.