tencent cloud

Tencent Cloud Observability Platform

Release Notes and Announcements
Release Notes
Product Introduction
Overview
Strengths
Basic Features
Basic Concepts
Use Cases
Use Limits
Purchase Guide
Tencent Cloud Product Monitoring
Application Performance Management
Mobile App Performance Monitoring
Real User Monitoring
Cloud Automated Testing
Prometheus Monitoring
Grafana
EventBridge
PTS
Quick Start
Monitoring Overview
Instance Group
Tencent Cloud Product Monitoring
Application Performance Management
Real User Monitoring
Cloud Automated Testing
Performance Testing Service
Prometheus Getting Started
Grafana
Dashboard Creation
EventBridge
Alarm Service
Cloud Product Monitoring
Tencent Cloud Service Metrics
Operation Guide
CVM Agents
Cloud Product Monitoring Integration with Grafana
Troubleshooting
Practical Tutorial
Application Performance Management
Product Introduction
Access Guide
Operation Guide
Practical Tutorial
Parameter Information
FAQs
Mobile App Performance Monitoring
Overview
Operation Guide
Access Guide
Practical Tutorial
Tencent Cloud Real User Monitoring
Product Introduction
Operation Guide
Connection Guide
FAQs
Cloud Automated Testing
Product Introduction
Operation Guide
FAQs
Performance Testing Service
Overview
Operation Guide
Practice Tutorial
JavaScript API List
FAQs
Prometheus Monitoring
Product Introduction
Access Guide
Operation Guide
Practical Tutorial
Terraform
FAQs
Grafana
Product Introduction
Operation Guide
Guide on Grafana Common Features
FAQs
Dashboard
Overview
Operation Guide
Alarm Management
Console Operation Guide
Troubleshooting
FAQs
EventBridge
Product Introduction
Operation Guide
Practical Tutorial
FAQs
Report Management
FAQs
General
Alarm Service
Concepts
Monitoring Charts
CVM Agents
Dynamic Alarm Threshold
CM Connection to Grafana
Documentation Guide
Related Agreements
Application Performance Management Service Level Agreement
APM Privacy Policy
APM Data Processing And Security Agreement
RUM Service Level Agreement
Mobile Performance Monitoring Service Level Agreement
Cloud Automated Testing Service Level Agreement
Prometheus Service Level Agreement
TCMG Service Level Agreements
PTS Service Level Agreement
PTS Use Limits
Cloud Monitor Service Level Agreement
API Documentation
History
Introduction
API Category
Making API Requests
Monitoring Data Query APIs
Alarm APIs
Legacy Alert APIs
Notification Template APIs
TMP APIs
Grafana Service APIs
Event Center APIs
TencentCloud Managed Service for Prometheus APIs
Monitoring APIs
Data Types
Error Codes
Glossary

Tencent Cloud Service Event Source

PDF
フォーカスモード
フォントサイズ
最終更新日: 2024-11-01 20:39:44
Note:
All Ops events such as alarms and auditing events generated by Tencent Cloud services will be delivered to the Tencent Cloud service event bus, which is the default event bus and cannot be modified or deleted. You can go to the EventBridge console to bind rules and targets to the Tencent Cloud service event bus to distribute Tencent Cloud service events.
If you want to use the Cloud Monitor events (such as CVM kernel faults and OOM exceptions) and CloudAudit events (available soon) that are generated by Tencent Cloud services as event sources, you only need to activate the corresponding Tencent Cloud services, and then the Tencent Cloud services will be automatically connected to EventBridge. The events generated by Tencent Cloud services will be delivered to the Tencent Cloud service event bus by default. For more information, see Tencent Cloud Service Event.

Directions

The following is the procedure for viewing all Tencent Cloud services (Cloud Monitor) data sources currently supported:
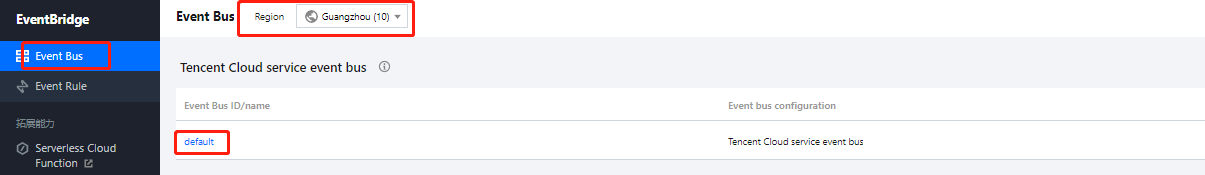
1. Log in to the EventBridge console and choose Tencent Cloud service event bus > default to view the Tencent Cloud service events that are currently connected to the Tencent Cloud service event bus.


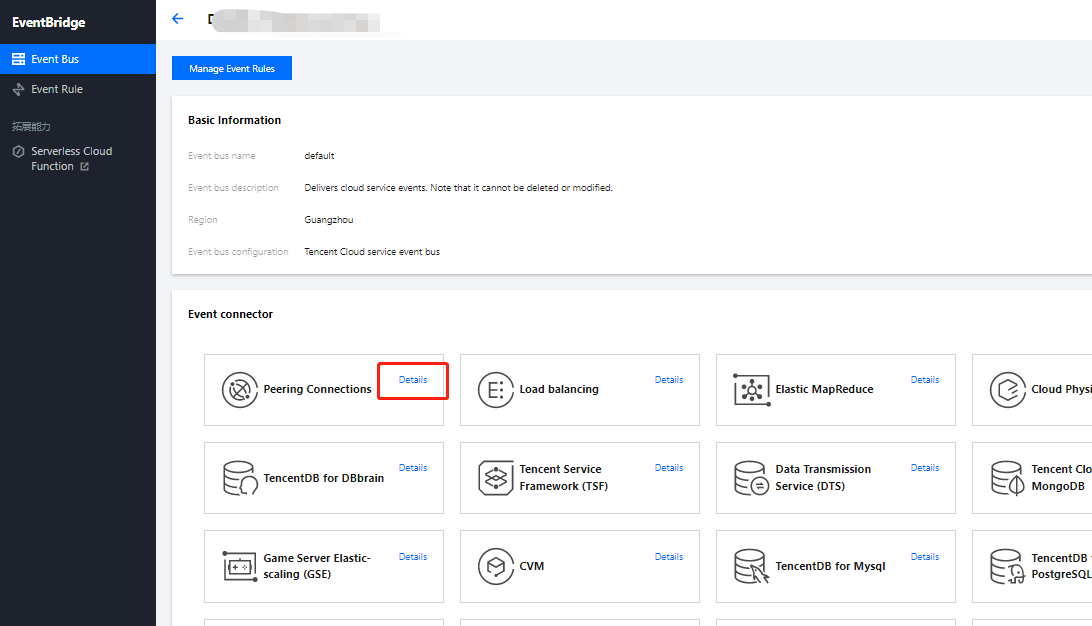
2. In the Event Connector area, you can view all Tencent Cloud services that support alarm event push.


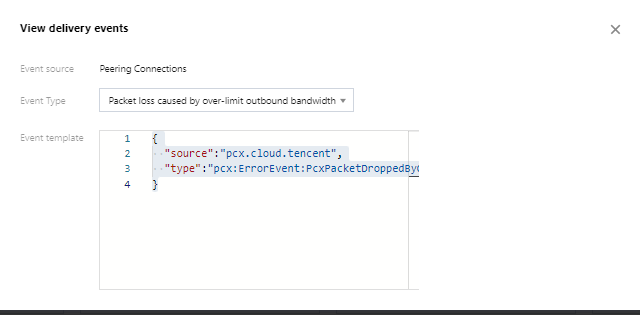
3. You can click Details to view all alarm event types that are currently supported.


Supported Event Sources

ヘルプとサポート

この記事はお役に立ちましたか?

フィードバック