tencent cloud

Tencent Cloud Observability Platform

Release Notes and Announcements
Release Notes
Product Introduction
Overview
Strengths
Basic Features
Basic Concepts
Use Cases
Use Limits
Purchase Guide
Tencent Cloud Product Monitoring
Application Performance Management
Mobile App Performance Monitoring
Real User Monitoring
Cloud Automated Testing
Prometheus Monitoring
Grafana
EventBridge
PTS
Quick Start
Monitoring Overview
Instance Group
Tencent Cloud Product Monitoring
Application Performance Management
Real User Monitoring
Cloud Automated Testing
Performance Testing Service
Prometheus Getting Started
Grafana
Dashboard Creation
EventBridge
Alarm Service
Cloud Product Monitoring
Tencent Cloud Service Metrics
Operation Guide
CVM Agents
Cloud Product Monitoring Integration with Grafana
Troubleshooting
Practical Tutorial
Application Performance Management
Product Introduction
Access Guide
Operation Guide
Practical Tutorial
Parameter Information
FAQs
Mobile App Performance Monitoring
Overview
Operation Guide
Access Guide
Practical Tutorial
Tencent Cloud Real User Monitoring
Product Introduction
Operation Guide
Connection Guide
FAQs
Cloud Automated Testing
Product Introduction
Operation Guide
FAQs
Performance Testing Service
Overview
Operation Guide
Practice Tutorial
JavaScript API List
FAQs
Prometheus Monitoring
Product Introduction
Access Guide
Operation Guide
Practical Tutorial
Terraform
FAQs
Grafana
Product Introduction
Operation Guide
Guide on Grafana Common Features
FAQs
Dashboard
Overview
Operation Guide
Alarm Management
Console Operation Guide
Troubleshooting
FAQs
EventBridge
Product Introduction
Operation Guide
Practical Tutorial
FAQs
Report Management
FAQs
General
Alarm Service
Concepts
Monitoring Charts
CVM Agents
Dynamic Alarm Threshold
CM Connection to Grafana
Documentation Guide
Related Agreements
Application Performance Management Service Level Agreement
APM Privacy Policy
APM Data Processing And Security Agreement
RUM Service Level Agreement
Mobile Performance Monitoring Service Level Agreement
Cloud Automated Testing Service Level Agreement
Prometheus Service Level Agreement
TCMG Service Level Agreements
PTS Service Level Agreement
PTS Use Limits
Cloud Monitor Service Level Agreement
API Documentation
History
Introduction
API Category
Making API Requests
Monitoring Data Query APIs
Alarm APIs
Legacy Alert APIs
Notification Template APIs
TMP APIs
Grafana Service APIs
Event Center APIs
TencentCloud Managed Service for Prometheus APIs
Monitoring APIs
Data Types
Error Codes
Glossary

CLS Log Target

PDF
フォーカスモード
フォントサイズ
最終更新日: 2024-11-01 21:00:33
As an event delivery pipeline on the cloud, EventBridge only filters, routes, and distributes events. If you need to log or store events, you can configure CLS as the delivery target.

Permission Description

To ensure normal log viewing, your account must have at least the read-only permission QcloudCLSReadOnlyAccess of CLS if you are using a sub-account. For how to use the root account to grant permissions for a sub-account, see Authorization Management.

Feature Description

Currently, EventBridge supports two delivery methods: default logset delivery and custom logset delivery.
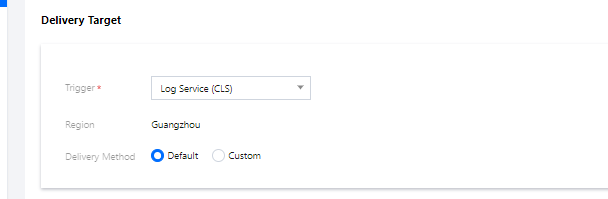
Default Logset Delivery
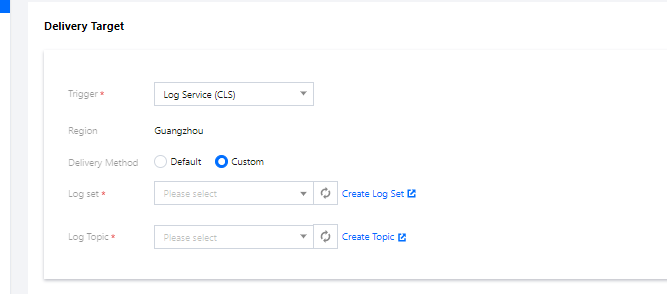
Custom Logset Delivery
When creating a delivery target, if you do not specify the destination topic for log delivery, the default log delivery capability will be used. For default log delivery, EventBridge will activate the CLS service for you and deliver the function invocation logs to the log topic under the EventBridge's default logset. The EventBridge's default logset and log topic are prefixed with EB_logset and EB_logtopic respectively, and will be created automatically if they do not exist. Function invocation logs will be stored for 30 days by default, and you can view and manage them in the CLS console.


Billing Description

CLS is billed separately, and certain fees may incur. For details about the billing method, see CLS Billing Overview.
When creating a delivery target, if you need to specify the destination log topic for log delivery, you can use the custom log delivery capability. Before using this capability, you need to make sure that the CLS service has been activated for your account.


Billing

CLS is billed separately. After a custom logset is bound, the fee deduction rule on the CLS side prevails. For more information, see Billing Overview.

Configuration Instructions

1. View and manage logs After creating a delivery target, you can choose Event Rule > Event Target to view the bound logset and log topic, and click the log topic to go to the CLS console to view and manage logs. EventBridge's default logset is marked with "EB" in the CLS console. If you have requirements such as persistent event storage, perform further configuration and management in the CLS console.
2. Manage indexes Log searching depends on the index configuration of the log topic. For the default logset, EventBridge automatically performs index configuration for you. Currently, the following index fields are supported:
Note:
If you select a custom logset, ensure that the logset is also configured with the following indexes. Otherwise, events cannot be queried on the CLS side after being delivered.
Field Name
Field Type
Delimiter
Allow Chinese Characters
sourceType
text
N/A
No
caller
text
N/A
No
eventbusId
text
N/A
No
status
text
N/A
No
specversion
text
N/A
No
id
text
N/A
No
type
text
N/A
No
source
text
N/A
No
subject
text
N/A
No
region
text
N/A
No
datacontenttype
text
N/A
No
tags
text
N/A
No
data
text
N/A
No
time
text
N/A
No

ヘルプとサポート

この記事はお役に立ちましたか?

フィードバック