1. EventBridge is supported only in some regions. How do I process alarm events in other regions?
Alarm events from all regions can be received and processed by EventBridge, as the alarm events generated by businesses in different regions will be delivered to the Tencent Cloud service event bus in the Guangzhou region in a unified manner. You can manage all events delivered by services in different regions in this event bus.
2. Will global monitoring be performed on instances under the current account in the event alarm scenario?
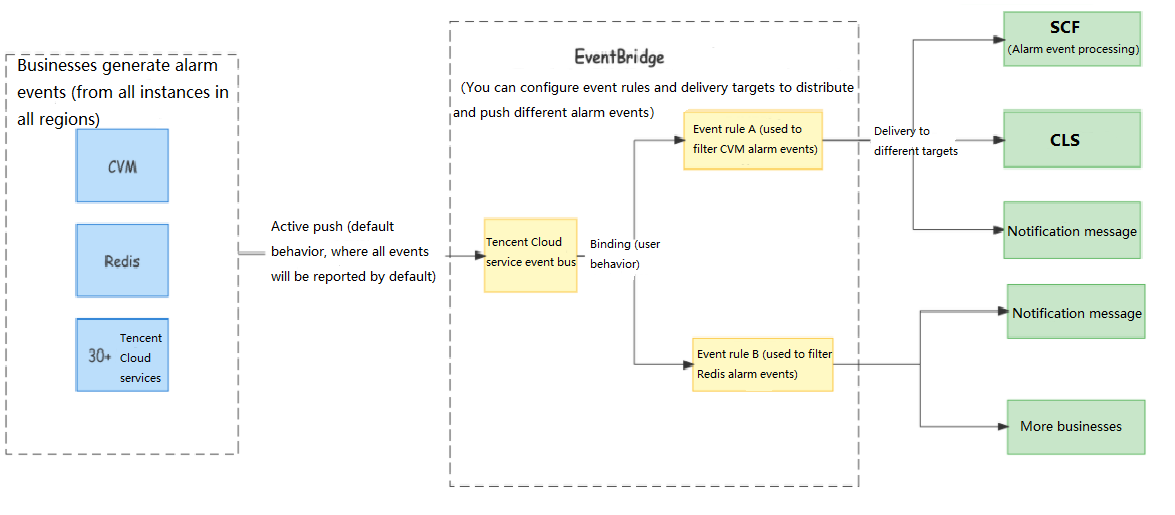
EventBridge can report all instance alarm events, which are actively pushed by businesses. Once an alarm is triggered, it will be automatically sent to EventBridge over the default linkage. You can also configure filter rules and delivery targets in the EventBridge console to determine how to process the delivered events. The process is as follows:
3. How is EventBridge billed?
For Tencent Cloud service event delivery and alarm push event processing, the Tencent Cloud service event bus in EventBridge will be free of charge. If you connect EventBridge to and use other Tencent Cloud services such as SCF and CKafka in the downstream, you will be charged according to the billing rules of the corresponding services. For more information, see Purchase Guide.
Note:
For CLS delivery targets, we provide a free tier of 1 GB per 30 days for log storage to help you manage and trace back event alarm messages.
4. How do I bind an alarm instance?
In an EventBridge Linkage, the events of all instances in all regions are reported automatically by default, and you don't need to manually bind the instances. However, you can configure event rules to determine which events from which instances need to be pushed.
Event rule examples:
Receiving all events
Set source to cvm.cloud.tencent, which indicates to receive and deliver all alarm events from CVM:
{
"source":"cvm.cloud.tencent"
}
Receiving specified events
Only "ping unreachable" events from CVM are delivered. All other events will be discarded.
{
"source":"cvm.cloud.tencent",
"type":"cvm:ErrorEvent:PingUnreachable"
}
Receiving events from the specified instance
Receive and deliver events of the CVM instance "ins-XXX" only. Other events are discarded.
{
"source":"cvm.cloud.tencent",
"subject":"ins-xxxxxx"
}
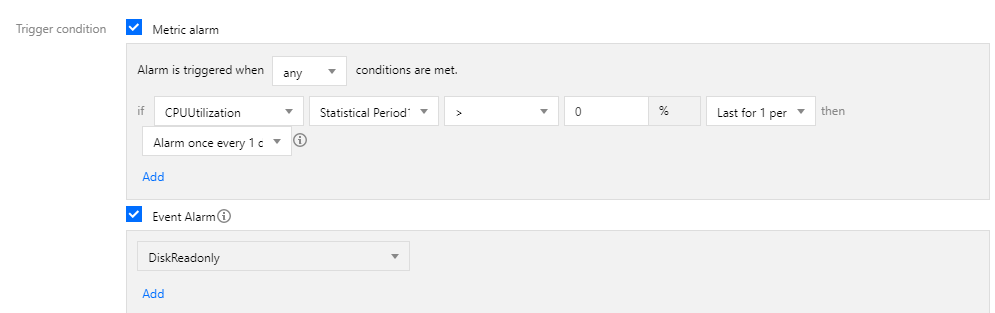
5. How do I configure the thresholds supported by Cloud Monitor in the EventBridge console?
You can migrate only event alarms to EventBridge. Thresholds are metric alarms and still managed in the Cloud Monitor console.
6. Why can't I receive Tencent Cloud service exception alarms after migration from Cloud Monitor to EventBridge?
Typical causes are as follows:
No alarm rule is configured on the Cloud Monitor side, or a new alarm recipient needs to be configured:
Check that you have configured an alarm rule for the Tencent Cloud service event bus (only available in the Guangzhou region). For more information, see Alarm Policy Configuration.
The alarm rule is configured for a custom event bus instead of the Tencent Cloud service event bus:
Cloud Monitor and CloudAudit events generated by Tencent Cloud services can be received only by the Tencent Cloud service event bus. Therefore, you must configure a Tencent Cloud service alarm rule for the Tencent Cloud service event bus.
The event length is too long, causing push failure in some channels:
For SMS message delivery, a notification message can contain up to 500 characters. For phone delivery, a notification message can contain up to 350 characters. If fields such as the instance name are too long, notification messages may fail to be sent due to excessive length. You are advised to configure multiple delivery channels at the same time.
7. How do I view the alarm message history?
The linkage tracing feature is added to EventBridge to help you better trace and backtrack the event delivery history. For how to use the feature, see Linkage Tracing.